


 Arguments


Yes Happer and Spencer, Global Warming Continues
Posted on 3 April 2012 by dana1981
William Happer is a Princeton physicist and Chairman of the Board of Directors at the right-wing fossil fuel-funded think tank George C. Marshall Institute. Although he has not published any climate-related research in his scientific career, Happer nevertheless seems to enjoy making his opinions about climate science known, as we have previously examined here and here. Unfortunately, Happer does not seem interested in taking the time to ensure that those are informed opinions.
Rather than subject his thoughts to the peer-review process, Happer's publication of choice appears to be The Wall Street Journal (WSJ), as he was one of the 16 scientists who recently published a plea for climate inaction in that paper, and a follow-up article defending their previous misrepresentations. Happer has now gone solo, publishing another opinion-editorial in the WSJ with such a Gish Gallop of climate-related myths as to be a truly Moncktonian effort.
Though we will briefly whack each of Happer's moles in the post below, one particular myth caught our attention. This myth was also recently endorsed by Roy Spencer in an interview with John Stossel on Fox News - the myth that the planet has not warmed in the past 10 years.
Global Warming Continues
The quotes relevant to this myth are:
Happer: "What is happening to global temperatures in reality? The answer is: almost nothing for more than 10 years...The lack of any statistically significant warming for over a decade has made it more difficult for the United Nations Intergovernmental Panel on Climate Change (IPCC) and its supporters to demonize the atmospheric gas CO2 which is released when fossil fuels are burned."
Spencer: "...for some reason it stopped warming in the last 10 years, which is one of those dirty little secrets of global warming science"
There are a number of problems with these assertions. First, Happer mentions statistical significance, but global surface temperature trends are rarely if ever statistically significant (at a 95% confidence level) over periods as short as a decade, even in the presence of an underlying long-term warming trend, because of the natural variability and noise in the climate system.
Second, if we filter out some of those short-term (i.e. interannual) influences, as Foster & Rahmstorf (2011) did (the El Niño Southern Oscillation, volcanoes, and solar activity), once we reduce the noise, the global surface warming trend over the past decade does become statistically significant. We can use the new SkS temperature trend tool developed by Kevin C to illustrate this with any data set, but since the argument was made by the University of Alabama at Huntsville (UAH)'s Roy Spencer, we will choose the UAH data set (Figure 1).
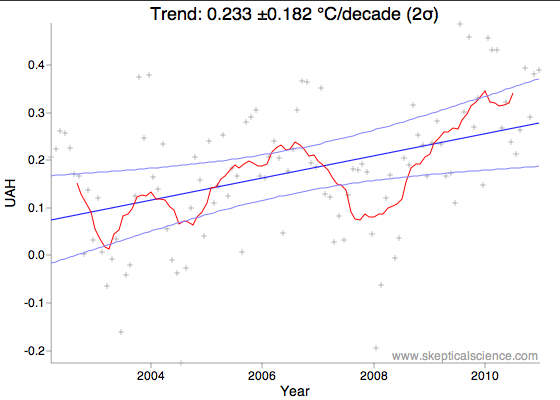
Figure 1: UAH lower troposphere temperature since February 2002 with the Foster and Rahmstorf method applied, and linear trend with two-sigma uncertainty
As Figure 1 shows, the UAH warming trend over the past decade is indeed both positive and statistically significant once these three short-term effects are filtered out.
Third, as Roger Pielke Sr. is fond of pointing out, very little of the global energy imbalance actually goes into heating the surface and atmosphere. The vast majority goes into heating the oceans, and thus if one is to argue that the planet has stopped warming, one must look to see if ocean heat content (OHC) has stopped increasing. So has it? Only if you consider the equivalent of two Hiroshima bomb detonations per second "almost nothing" (Figure 2).
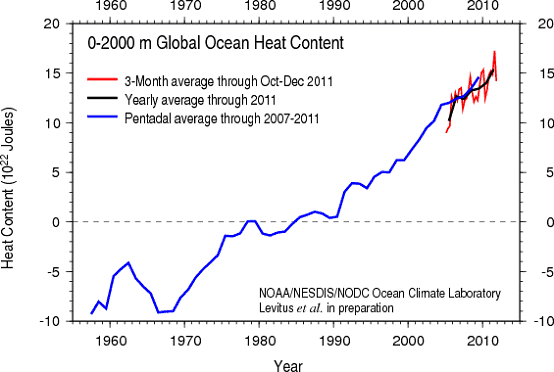
Figure 2: Global OHC for the upper 2000 meters of oceans (Levitus et al. in preparation)
The OHC increase over the past decade is also statistically significant (Nuccitelli et al. in preparation).
In short, Happer and Spencer are committing the classic Escalator fallacy, focusing on short-term noise while ignoring the long-term signal, as well as ignoring the vast heating of the oceans.
Whack Those Moles
As promised, we will take a brief moment to provide the resources to debunk the many other myths from Happer's WSJ article. The quotes below are from Happer's article, and the following discussions and links debunk the myths in those quotes.
Juicy Cherries
"The latest (February 2012) monthly global temperature anomaly for the lower atmosphere was minus 0.12 degrees Celsius, slightly less than the average since the satellite record of temperatures began in 1979."
Does the inappropriateness of focusing on the temperature anomaly from a single month really need to be pointed out to Happer? Monthly temperature data are extremely noisy, and Happer's comparison tells us nothing of use whatsoever. It is a classic cherry pick of a time period influenced by a strong La Niña event, pure and simple.
CO2 is a Pollutant
"CO2 is not a pollutant."
CO2 was Higher in the Past
"Life on earth flourished for hundreds of millions of years at much higher CO2 levels than we see today."
Life on Earth hundreds of millions of years ago was quite different from life today, and the sun was also dimmer at the time.
CO2 as Plant Food Oversimplification
"Increasing CO2 levels will be a net benefit because cultivated plants grow better and are more resistant to drought at higher CO2 levels"
The 'CO2 is plant food' argument is such a gross oversimplification of a complex issue that frankly it is an insult to the WSJ readers that Happer expects them to swallow it.
Fossil Fuels = Prosperity?
"Nations with affordable energy from fossil fuels are more prosperous and healthy than those without."
Certainly high energy consumption is a sign of "prosperity," but there is no reason that energy must come from fossil fuels. The correlation merely represents the fact that 'prosperous' nations which have used more energy have historically primarily relied on fossil fuels to supply that energy. It does not follow that nations must rely on fossil fuels to supply their energy needs, particularly since renewable energy technologies are advancing and becoming rapidly cheaper.
In fact, when all costs are taken into consideration, fossil fuels are already more expensive than many renewable energy sources. Solar photovoltaic power has already reached grid parity (when the cost of the energy matches market electricity prices) in several countries (Australia, Germany, Italy, Spain, Denmark, Portugal, and Brazil) and is expected to reach grid parity in many other coutries within the next few years. Wind power is even cheaper.
Feedbacks are Net Positive, Sensitivity not Low
"The direct warming due to doubling CO2 levels in the atmosphere can be calculated to cause a warming of about one degree Celsius. The IPCC computer models predict a much larger warming, three degrees Celsius or even more, because they assume changes in water vapor or clouds that supposedly amplify the direct warming from CO2. Many lines of observational evidence suggest that this "positive feedback" also has been greatly exaggerated."
There are two false claims in this quote. First, positive net feedbacks are not "assumed," they are observed (i.e. see Dessler et al. 2008). Second, there are not "many lines of observational evidence" suggesting low climate sensitivity. In reality both observational data and models agree that climate sensitivity is likely between 2 and 4.5°C for doubled atmospheric CO2, with a most likely value of 3°C (Figure 3).

Figure 3: Distributions and ranges for climate sensitivity from different lines of evidence. The circle indicates the most likely value. The thin colored bars indicate very likely value (more than 90% probability). The thicker colored bars indicate likely values (more than 66% probability). Dashed lines indicate no robust constraint on an upper bound. The IPCC likely range (2 to 4.5°C) and most likely value (3°C) are indicated by the vertical grey bar and black line, respectively. Adapted from Knutti and Hegerl (2008)
Global Warming is Human-Caused
"the timing of the warming—much of it before CO2 levels had increased appreciably—suggests that a substantial fraction of the warming is from natural causes that have nothing to do with mankind."
Approximately 80% of the global surface warming over the past 130 years has occurred over the past 4 decades (as can be shown with the SkS Temperature Trend Tool). Some warming during the early 20th Century was caused by natural effects such as increased solar activity, but this does not negate the human-caused warming, in particular over the past 50-65 years (Figure 4).
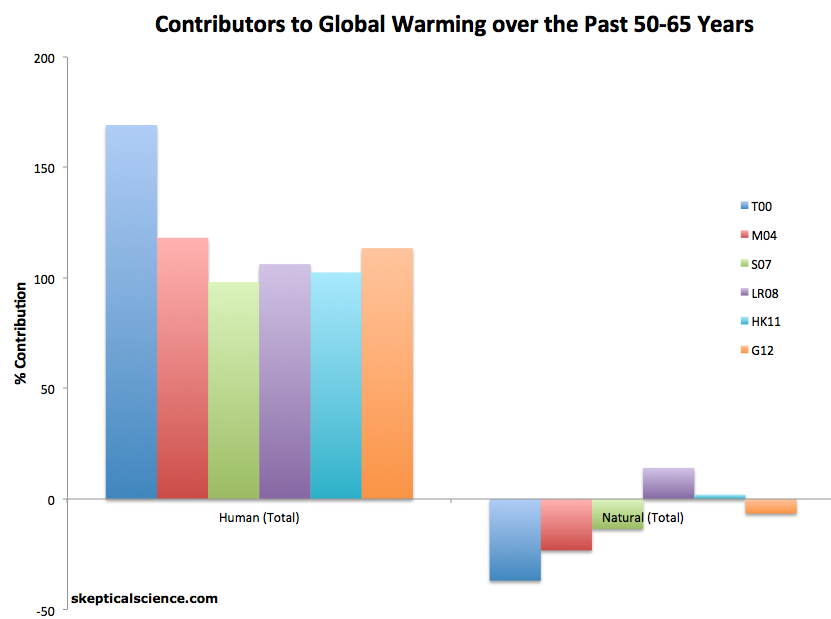
Figure 4: Net human and natural percent contributions to the observed global surface warming over the past 50-65 years according to Tett et al. 2000 (T00, dark blue), Meehl et al. 2004 (M04, red), Stone et al. 2007 (S07, green), Lean and Rind 2008 (LR08, purple),Huber and Knutti 2011 (HK11, light blue), and Gillett et al. 2012 (G12, orange).
Extreme Weather on the Rise
"some IPCC supporters have been claiming that "extreme weather" has become more common because of more CO2. But there is no hard evidence this is true. After an unusually cold winter in 2011 (December 2010-February 2011) the winter of 2012 was unusually warm in the continental United States. But the winter of 2012 was bitter in Europe, Asia and Alaska."
As long as we're cherry picking, since 12 March 2012 (a span of less than 3 weeks), more than 7,000 high temperature records have been equaled or exceeded in the USA. While it is difficult to attribute individual extreme wather events to global warming, increases in some extreme weather events have been observed. Also see Hansen et al. (2011) and Rahmstorf and Coumou (2011) for efforts to quantify the increased frequency of extreme weather events, and the IPCC SREX for an overview of the subject.
Models are Reliable
"The observed response of the climate to more CO2 is not in good agreement with model predictions."
The model results beg to differ (Figure 5).
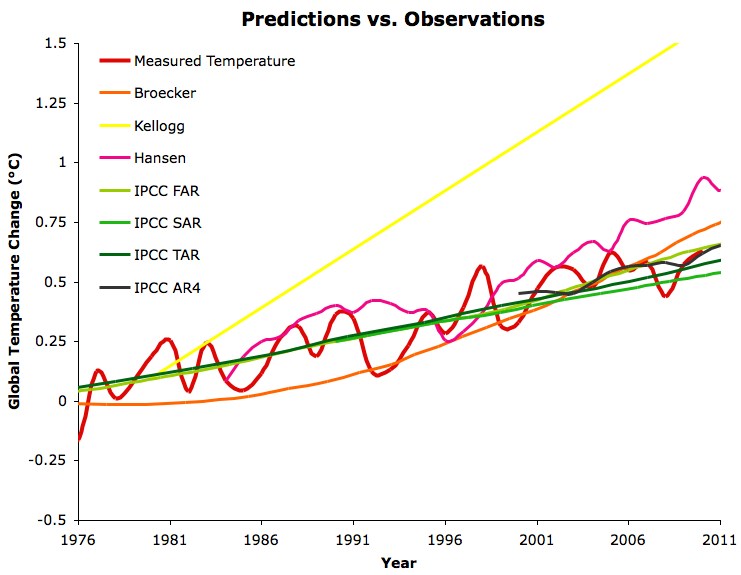
Figure 5: Various best estimate global temperature climate model predictions evaluated in the 'Lessons from Past Climate Predictions' series vs. GISTEMP (red).
Additionally, the observed surface temperature changes over the past decade are within the range of model predictions (Figure 6) and decadal periods of flat temperatures during an overall long-term warming trend are predicted by climate models (Easterling & Wehner 2009).
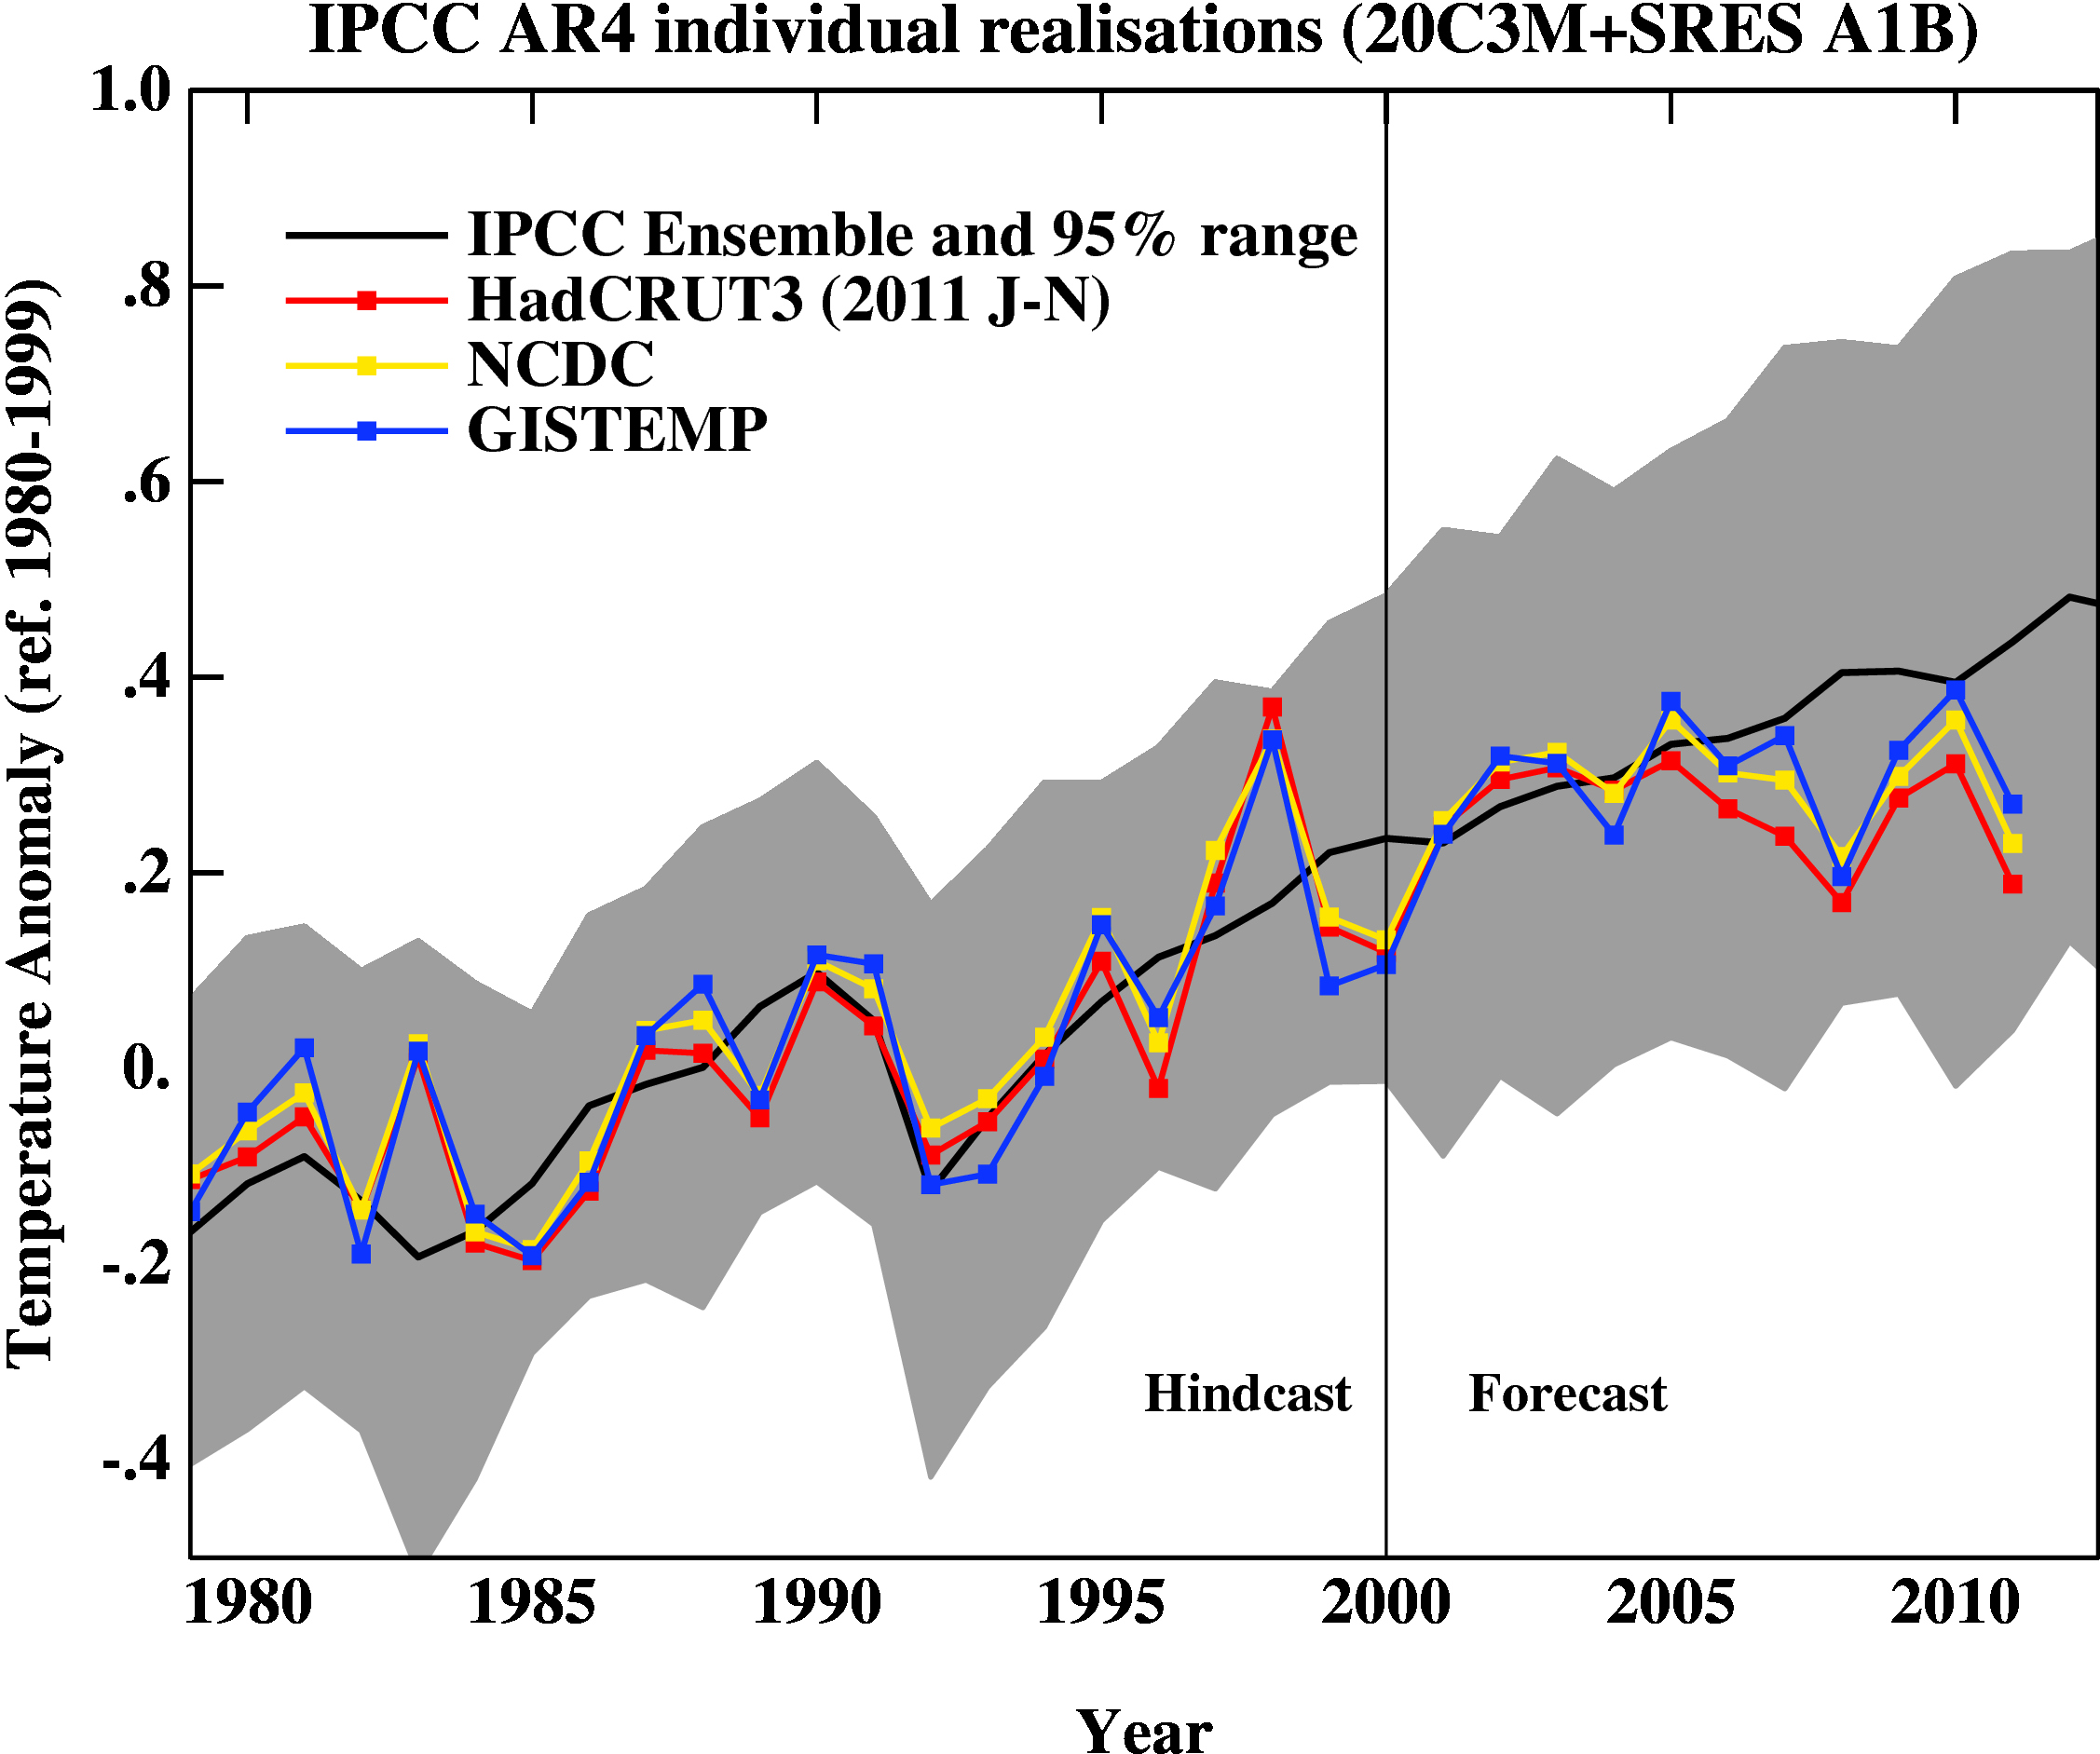
Figure 6: Annual mean anomalies from the IPCC AR4 models plotted against the surface temperature records from the HadCRUT3v, NCDC and GISTEMP products. Everything has been baselined to 1980-1999 (as in the 2007 IPCC report) and the envelope in grey encloses 95% of the model runs (created by Gavin Schmidt).
Gish Gallop Giddy-Up
Rather than publishing uninformed opinion pieces in the Murdoch media, if Happer thinks his climate-related opinions are correct, perhaps he should subjugate them to the peer-review process to see if they can withstand scrutiny. As a physicist, Happer should know that science advances through scrutinized research, not uninformed opinion pieces published in newspapers. Moreover, "skeptics" like Spencer and Happer should cease cherry picking and consider all the data, in which case they will realize that global warming has not magically stopped.


 0
0  0
0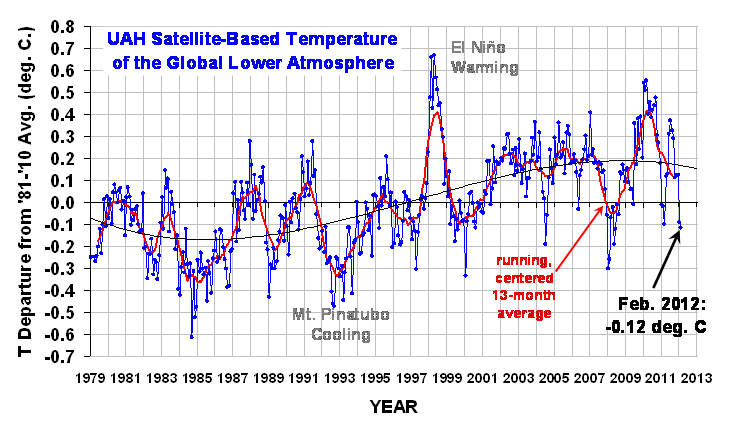 He used to add a caveat that it was just for "entertainment purposes only, and should not be construed as having any predictive value whatsoever.", which he seems to have omitted in his most recent post. Even with the caveat I think this is deeply irresponsible as there are those that will reproduce the figure without the caveat as if it actually meant something (for example, see here and scroll down to the section "Decide for yourself if the trend should be curved ...").
I have to say that fitting models in excel with no attempt to determine their validity or error bars doesn't seem particularly entertaining to me!
He used to add a caveat that it was just for "entertainment purposes only, and should not be construed as having any predictive value whatsoever.", which he seems to have omitted in his most recent post. Even with the caveat I think this is deeply irresponsible as there are those that will reproduce the figure without the caveat as if it actually meant something (for example, see here and scroll down to the section "Decide for yourself if the trend should be curved ...").
I have to say that fitting models in excel with no attempt to determine their validity or error bars doesn't seem particularly entertaining to me!


Comments