


 Arguments


New Study, Same Result - Greenhouse Gases Dominate Global Warming
Posted on 18 March 2013 by dana1981
A new study by Jones, Stott, and Christidis of the UK Met Office (Jones et al. 2013) examines the causes of global warming by using global climate model simulations from the World Climate Research Programme’s Coupled Model Intercomparison Project phase 5 (CMIP5) and comparing those model results to observed global surface temperatures. CMIP5 is one of the largest collaborative efforts for bringing together climate model data for access by climate scientists across the world. The prior phase, CMIP3 was used heavily in studies included in the 2007 Intergovernmental Panel on Climate Change (IPCC) Fourth Assessment Report, while CMIP5 is used in many studies evaluated in the upcoming IPCC Fifth Assessment report, due out in 2013.
Over the past 60 years (1951–2010), the study finds that global average surface temperatures have warmed 0.6°C, while in climate models, greenhouse gases caused between 0.6 and 1.2°C surface warming. This was offset by a cooling from other human influences (mainly from aerosols) of 0 to 0.5°C. These results are consistent with all prior studies of the causes of global warming (Figure 1).
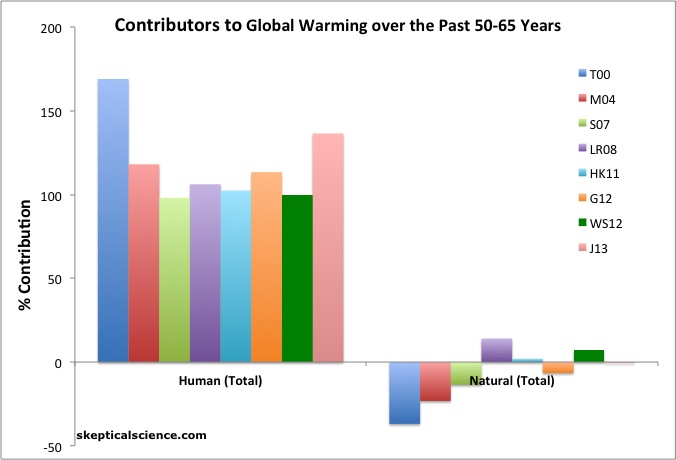
Figure 1: Net human and natural percent contributions to the observed global surface warming over the past 50-65 years according to Tett et al. 2000 (T00, dark blue), Meehl et al. 2004 (M04, red), Stone et al. 2007 (S07, light green), Lean and Rind 2008 (LR08, purple), Huber and Knutti 2011 (HK11, light blue), Gillett et al. 2012 (G12, orange), Wigley and Santer 2012 (WS12, dark green), and Jones et al. 2013 (J12, pink).
The climate model runs considering all external influences on global surface temperatures (mainly greenhouse gases, aerosols, the sun, and volcanic eruptions) simulate the observed temperature changes accurately (Figure 2).
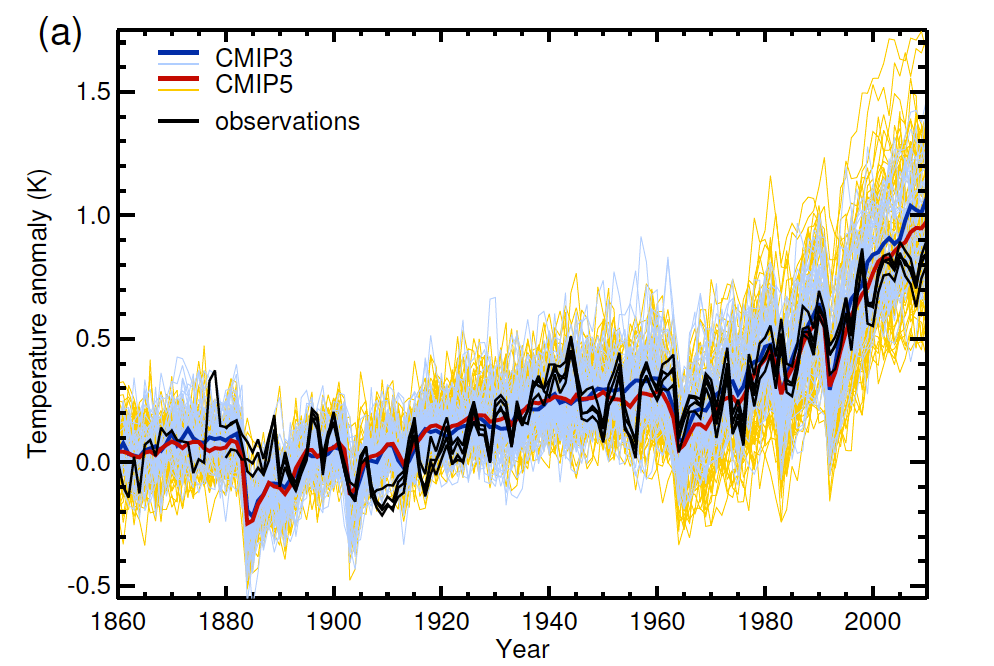
Figure 2: Global annual mean surface air temperature for CMIP3 (thin blue line) and CMIP5 (thin red line) for all external temperature influences (forcings) compared to the four observational datasets (black lines). The weighted ensemble average for CMIP3 (blue thick line) and CMIP5 (red thick line) are estimated by given equal weight to each model’s ensemble mean. All model and observed data have same spatial coverage as HadCRUT4. The baseline is 1880–1919. Figure 4a from Jones et al. 2013.
The average of the models does overestimate the observed surface warming over the past decade. This is why the sum of human and natural contributions from Jones et al. 2013 exceeds 100% in Figure 1 – because the modeled warming slightly exceeds the observed warming.
As we have previously discussed, this is mainly due to the preponderance of El Niño events in the 1990s and La Niña events in the 2000s. This internal variability has had a cooling effect on recent surface temperatures (though not of overall global temperatures) which is not captured in the average of the model simulations. However, it is within the range of all individual model simulations, as is evident by the fact that the observational data in Figure 2 (black) falls within the envelope of CMIP5 model simulations (yellow).
The study also runs simulations for just natural temperature influences (Figure 3), and just greenhouse gas temperature influences (Figure 4).
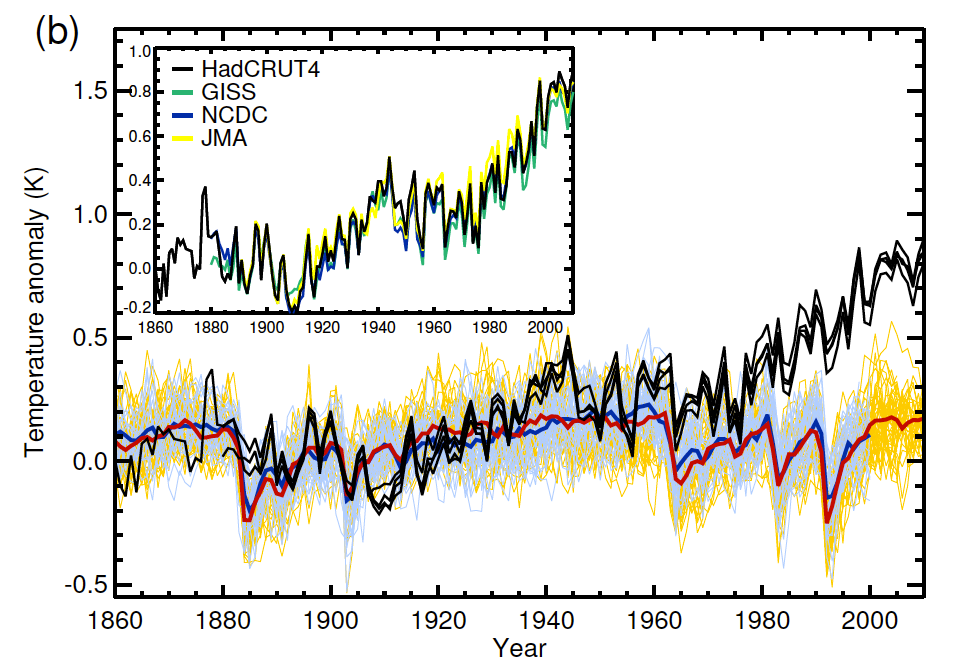
Figure 3: Global annual mean surface air temperature for CMIP3 (thin blue line) and CMIP5 (thin red line) for all natural external temperature influences (forcings) compared to the four observational datasets (black lines). The weighted ensemble average for CMIP3 (blue thick line) and CMIP5 (red thick line) are estimated by given equal weight to each model’s ensemble mean. All model and observed data have same spatial coverage as HadCRUT4. The baseline is 1880–1919. Figure 4b from Jones et al. 2013.
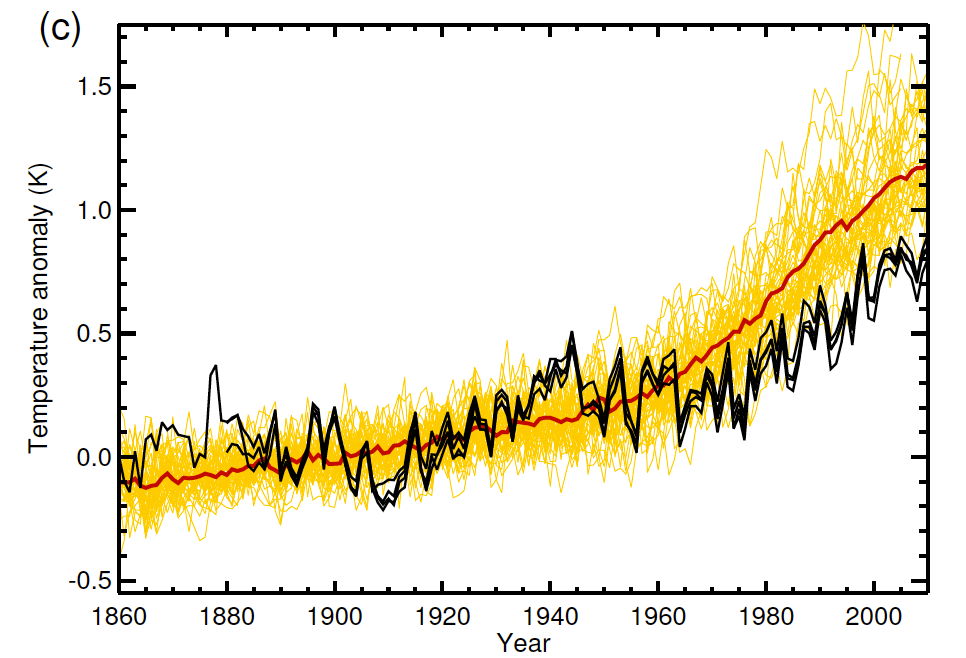
Figure 4: Global annual mean surface air temperature for CMIP5 (thin red line) for greenhouse gas temperature influences (forcings) compared to the four observational datasets (black lines). The weighted ensemble average for CMIP5 (red thick line) is estimated by given equal weight to each model’s ensemble mean. All model and observed data have same spatial coverage as HadCRUT4. The baseline is 1880–1919. Figure 4c from Jones et al. 2013.
The main messages from these two figures are that natural temperature influences cannot account for the observed global warming, especially over the past 50 years, and that greenhouse gases have caused more warming than has been observed, meaning that the net non-greenhouse gas effect is a cooling one (mainly from human aerosol emissions).
The study notes that the spread of CMIP5 model runs is a bit larger than the CMIP3 envelope (yellow vs. blue in Figure 2), possibly because models now include
"...a much wider exploration of aerosol uncertainty than previously carried out in models that now include a much more sophisticated treatment of aerosol physics.
Despite this wider spread of model results, calculations of attributable temperature trends based on optimal detection support previous conclusions that human-induced greenhouse gases dominate observed global warming since the middle part of the 20th century."
Overall, Jones et al. (2013) concludes that greenhouse gases have caused between 100% and 200% of the observed global surface warming over the past 60 years, and other human influences (primarily aerosols) have offset a significant percentage of that warming via cooling effects. Natural temperature influences have had a very slight cooling effect, and natural internal variability appears to have had a fairly significant cooling effect over the past decade, but little temperature influence over longer timeframes.
The results of this study are consistent with the wide body of evidence supporting the settled science that human greenhouse gas emissions are the dominant cause of the current global warming.


Interesting post, especially the part about the spread of the CMIP5 members being broader than those from CMIP3.
Well, say the fake skeptics, scientists must be conpsiring to obtain such similar results from independent studies using different methods, tools and data (/sarc). Nope fake skeptics, it is simply called consilience.
@Albatross #1:
Why not drop the repetitive "fake skeptics" theme. Just because not everyone agrees with your interpretation of the data doesn't make them "fakes". Look at Figure 2 above. The warming rate in the observations from 1910 to 1945 is clearly way higher than the models show it should be. I'm thinking the models are missing something. Does that make me a fake?
Klapper:
The warming in the observations during the period you note appears to be entirely contained within the model spread of CIMP5 models, and very nearly entirely contained within the model spread of CIMP3 models. As such, your claim that "The warming rate in the observations from 1910 to 1945 is clearly way higher than the models show it should be" is incorrect.
Klapper @2 - maybe you shouldn't assume that somebody who isn't talking about you is talking about you.
Your comment about Figure 2 also isn't correct - the 1910 to 1945 observations are within the envelope of model runs. The fact that the observed rate is faster than the multi-model mean is probably due to natural variability, which is also likely the primary explanation for the same multi-model mean vs. observations discrepancy over the past decade.
Yes, Klapper, that does make you a fake. For a start, a real skeptic would have observed that the observations during that period lie within the confidence limits of the model runs, meaning that there is no significant difference between the model runs and the observations.
Thanks for illustrating one of the key markers of the fake skeptic - perfectly happy to sieze on terms like "not statistically significant" when applied to things that you think work in your favour, like "no warming for x years", but completely ignoring them when it would work against you.
Clyde, it would be fascinating to study the amount of research that has been performed solely in response to the denial industry's proven ability to misinform. Note how many investigations were performed based on the never-formalized "climategate" allegations. No other area of science is twisted so systematically by opinion-making organizations. It matters, even if scientists say they try to stay out of politics. If the denial industry is successful, climate science will simply go away, because it will be deemed by the misinformed public to be a fraudulent use of taxpayer money. The denial industry, of course, will move on to another target, just as it moved from tobacco-cancer to climate science.
As for gravity, yes, people are still studying it. (note the time limit on the search)
@dana1981 #4:
Natural variability should be smoothed out over the period I'm discussing (1910 to 1945 or 36 years inclusive). I checked the trend 1910 to 1945 inclusive on your trend calculator for all 3 SAT datasets: answer is 0.15 to 0.14C/decade +/- .04, meaning the minimum temperature trend in that period is about 0.01C/decade.
Using data from the KNMI data explorer website the model ensemble mean of the CMIP3+ runs for the 20th century, the trend is 0.05C/decade. What do you think 2sigma is on that trend? We use the term "within the model envelope". Are you saying that the model envelope is equivalent to 2 sigma on our best guess at the model generated warming rate for this time period?
This is a tricky question but I think the answer to my last question is no.
Clyde - not sure why you think a correction is needed. Aerosols are the main negative anthropogenic forcing.
Come on. Science always investigates what is unknown. The settled bit is that increasing GHG in atmosphere will change climate. Unsettled is things like understanding and predicting short-term variations (eg ENSO); source and relative strength of past forcings; the value for climate sensitivity; etc etc. For gravity - well what is the mechanism? Why the equivalence principle? Do gravity waves exist? (and similar questions around reconcilation of general relativity and quantum mechanics).
@Clapper #11:
You are confusing statistics regarding the MEAN and statistics regarding individual observations. The mean of the model ensemble is what we think we would get if we had thousands of replicate Earths and averaged their trends over the same period. However, we only have one Earth. So, the proper comparison is not the observed trend with the mean, it is with the range of trajectories produced by the model ensemble -- that prediction interval is what the scatter of squiggles in fig. 2 shows. As long as the observed trajectory lies within the prediction interval, it is not inconsistent with our understanding as formalized in the models.
Think of it this way: suppose you measure a single person, and she is 2 m tall, and you want to ask if that person might be Dutch. You would not compare that measurement with the mean height of Dutch people or even the confidence interval on that mean (which gets vanishingly narrow with a large sample size), you would compare it with the overall spread of the height distribution in that country: the prediction interval. If it is within the prediction interval, you can conclude that the person's height is not inconsistent with their being Dutch.
@Mammal_E #14:
If the mean height of Dutch women is 1.56 m +/-.02 at the 95% confidence interval, and the women is 2.00 m tall and the tallest Dutch women ever measured was 2.01 m, you can argue "its not inconsistent that the woman is Dutch", but that's not saying you have high confidence the woman is Dutch.
There is no statistical validity for claiming your GHG driven warming hypothesis, as implemented in the models, is confirmed because the observed trend lies "within the squiggles". (-snip-).
@Klapper: Correct. I order to make inference, we need to compare the relative correspondence between observed data and alternative models. Models without anthropogenic forcing do much more poorly at reproducing the observed trend trajectories (observed data WAY outside the squiggles) than models with anthropogenic forcing. It is also true that models without natural forcings perform poorly. Models combining both factors perform far far better. (http://www.skepticalscience.com/climate-models-intermediate.htm) Until someone can come up with a model lacking anthropogenic forcing that does comparably well, the inference we are left with is that anthropogenic forcing (dominated by GHG) is necessary to explain the observed trajectory. Coupling that statistical result with the physical mechanisms we understand about the radiative property of GHGs, inferring that GHGs are causing climate change is the only sensible one.
As for your "probably"s : (1) show me and (2) the same applies to the poorly performing models without GHGs
Klapper - all you need to do is look at Figure 2 to see the observations fall within the envelop of individual model runs.
@dana1981 - 12
You say in paragraph 2 -
Over the past 60 years (1951–2010), the study finds
Then you have what the abstract says except you put - (mainly from aerosols) - instead of - from other anthropogenic forcings. Then you use 0 to 0.5°C, while the abstract says, 0 to -0.5°C.
@Mammal_E #16:
I'm not arguing that GHG's have no infuence. I'm arguing the models are missing some important forcing. That's a very difficult thing to prove. In science (unfortunately) sometimes 2 wrongs make the appearance of a right. That is to say, your model could be wrong and still replicate the observations.
Which brings us back to the 1910 to 1945 time period. The model ensemble trend (for CMIP3 anyway) is 1/3 the warming rate of the observations. Climate scientists have stated in the past that you need 30 years to capture the climate signal in the observations. Here you have more than 30 years. We can say by analysis of the observations that the lower bound climate signal (in the 95% confidence interval) is 0.10C/decade. The model ensemble trend in the period 1910 to 1945 is still only 1/2 of that.
I know the varibility is very low on the ensemble model trend so I suspect that if you calculated the 95% confidence on it, you would get a very low 2 sigma, even after correcting for autocorrelation. However, I also know that the ensemble trend is a very murky number, coming as it does from a range of models with different parametization factors etc. So I won't rationalize the models fail to replicate the climate signal in the period 1910 to 1945 based on regression statistics of the ensemble compared to the observations.
However, all that being said, don't you think that the scientific method would have you question why you have a marginal fit in the 1910 to 1945 period between the models and observations.
Clyde @18 - so basically your complaint is that I didn't just copy and paste the abstract?
As I already explained, aerosols are the primary negative anthropogenic forcing. Also "0.5°C cooling" and "-0.5°C" mean exactly the same thing.
At some point, the Chineese people are going to force their government to clean up their air. There goes a large part of the aerosols. The other elephant in the room is CH4. While it is 20 times more powerful than CO2 on a hundred year basis, it is more than 100 times more powerful in the short term. Methane is at present at about 1.7ppm and rising. It only has to reach about 3.5ppm to equal the effect of the present concentration of Carbon dioxide. I seem to have read about kilometer wide patches of methane bubbling to the surface north of Russia and enough clathrates around just the coast of America to supply her energy needs for centuries.
http://mtkass.blogspot.co.nz/2013/03/the-real-strength-of-methane.html
@Dana1981 #17:
I think the best way to test the hypothesis that the models replicate the climate signal in the period 1910 to 1945 is to compare individual models with fixed parametizations, with the input varying according to the 95% confidence we have on intial conditions and forcing magnitudes. Of those runs, how many would pass conventional regression statistical comparisons against the observations is a very good question.
As noted above the ensemble "envelope" is a very murky number, coming as it does from 20 or so different models, with different parametization factors, and different levels of resolution/sophistication. My guess is they don't even necessarily use identical inputs for forcing and/or initial conditions, although hopefully they're close since the runs are part of a model intercomparison process.
Doing model by model, run by run statistics against the observations might allow you to reject some models and tighten up the ensemble envelope. Right now I don't see a good fit between the model ensemble and the observations in the period 1910 to 1945. Climate science should be digging deeper as to why that is.
Actually, Dana, I think Clyde is just trolling - trying to get your goat. Earlier in the thread (currently #8), he quotes you as using the phrase "is consistent with", and then tries to pretend that this means that the referenced paper had nothing new in it beyond "settled science". I'm quite sure that Clyde is not so stupid as to think that they mean the same thing, so he must have had some other reason for posting.
Relativity is consistent with Newton's laws - i.e., they give pretty much the same results within the region of overlap of speeds much less than the speed of light - but relativity is obviously a significant extension of the science imbedded in Newton's laws.
Klapper:
You keep beating the horse of model comparisons to observations in the period 1910-1945. Unfortunately, until someone invents a time machine, we're not going to get greater accuracy on our values for such things as solar output, atmospheric aerosol loading, surface albedos, vegetation cover, etc. for the period. We may be able to improve on proxy reconstructions of some of those things, but there will always be greater uncertainties in model inputs for that period (compared to now).
One could always play around with various bits of the model in an effort to reproduce a particular historical pattern, but there are diminishing returns from this excercise (as far as science is concerned). At some point, you just have to accept that there are uncertainties in the input, and thus uncertainties in the output. It makes more sense to look at more recent periods with greater input data availability to focus on model improvements.
Klapper - Looking at Fig. 2, which represents the models run with all of the forcings both natural and anthropogenic, I would have to say that the model mean and standard deviation matches the observations quite well. Observations for that period are well within the 2-sigma model range, and mostly within the 1-sigma range, with two 10-year excursions above/below the model mean at about 1905-1915 and 1935-1945.
Please remember, as others have pointed out, that observations are a singular run of the real thing - which statistically has a 1/20 chance of exceeding a 2-sigma range. In addition, while the models appear quite good, they certainly are not perfect. They just might, however, be very useful.
Odd - that appears to be exactly what you are doing - over multiple comments...
Then you have clearly not reality-checked your assertions - see the CMIP5 Model Intercomparison Project for the forcing data used, and A Summary of the CMIP5 Experiment Design for details on the various runs of the comparison project. Initial conditions do vary, but given the boundary constraints of energy balance all of the models tend to settle down to a near mean-centered behavior after only a few years of the run. Which is part of what makes them useful - inter-model variation helps establish the range of possible climate responses bounded by forcings, feedbacks, and conservation of energy.
I'm sorry to say this, but your complaints strike me as concern trolling.
Klapper, as a further note, I would say it is wrong to confuse the envelope of multiple model runs with a 95% confidence interval. Also, there is no way that you expect any actual climate to follow an ensemble mean. This would imply dont think climate interal variability is present. You do however expect 20-30 trends to match the 20-30 trend of the model mean. You also expect the actual to be within the envelope. You dont have evidence of an unknown forcing unless it is outsite. I would also second Bob's comment - estimating early 20th C forcing is plain difficult.
So, basically, natural forcings drove the warming from the first half of the 20th century and earlier, via the sun and solar cycles.
After the solar cycles and temp response diverges in the late 70's, it was anthropogenic ghg that drove the warming. I know it wasn't a switch, and there was some ghg before the 70's, but relatively minor.
What happened to the feedback loops for CO2 and H2O? According to other debunking threads here (CO2 lags/leads temp - Coming out of LIA - Water is greatest ghg) there should be a feedback warming contribution from both of the gasses.
If there was 0.8 C warming from LIA to 1940, shouldn't there also be about the same warming from these feedback loops? If there was, it can't be both natural and anthropogenic.
You absolutely get an H2O feedback. Carbon feedbacks however are very slow - most AR4 models assumed them to be zero for purposes of predicting climate 100 years in advance. For longer periods you would have to consider them.
@Bob Loblaw #24:
I doubt the error bars on CO2 growth rate in the 1910 to 1945 interval are significant to the discussion we are having here. There is one major aerosol event (Katmai) at the very start of the period but none after. The correlation between TSI and SSN are pretty good so I can't see a large error in that parameter. It would be better if the major SAT datasets were truly independent which would allow us to check the confidence on the observations, but since SSTs in the Southern Hemisphere are pretty sparse that is somewhat of a weak link.
In short, while I acknowledge your point of data accuracy weakness in the 1st half of the 20th, I think the period in question is a very interesting one that deserves more investigation.
Kevin, Jungclaus et al. (2010) may answer your LIA-carbon cycle concerns, and Lemoine et al. (2010) may also be informative.
@KR #25
The ensemble "envelope" as presented in Figure 2 is not the 2 sigma range of the mean ensemble trend. I've been saying this all along. This is what I meant in my post #15. "Within the squiggles" has no statistical validity. I clearly stated that I was not claiming the 2 sigma range of the ensemble trend was a valid way to disprove the models (tempting as it might be).
On the topic of CMIP5, I have downloaded a number of 20th century runs from different models and do not agree with your statement: "models tend to settle down to a near mean-centered behavior after only a few years of the run". Put some numbers on that and we can discuss further. Keep in mind my period of interest is 1910 to 1945. This is a good time interval for checking your assertion since it is long enough to detect the climate signal, but not so long that agreement is guaranteed.
@scaddenp #26:
Please re-read my posts. I am completely aware the ensemble envelope is not any kind of 2 sigma error boundary. This psuedo-error boundary is used over and over in graphics presented by the IPCC, and also at sites like RealClimate.org. Yet it's statistical validity is murky at best.
There has to be a better way of rationalizing model output against observations, whether in the period 1910 to 1945, or the last 15 years. I've put some rough ideas on the table in my post to Dana (#22).
Klapper @ 29:
I would agree that errors in our knowledge of CO2 forcing in the period 1910-1945 are likely small, simply as a result of there being no reason to think that it varied significantly.
Would you care to explain to me why you are confident about the estimates of atmospheric aerosol levels that are available for that period? Perhaps you'll wish to compare the methods used during that period with the kinds of estimates we can obtain today with networks such as AERONET, or satellite data?
As well, perhaps you are willing to explain how accurate the measurements of solar output (you've used the acronym TSI, wich is Total Solar Irradiance) for that period are? Please feel free to compare that accuracy to those recently available from satellite data used in this PMOD analysis. Feel free to be as technical as you wish - I have worked with people from PMOD, and I am quite familiar with the types of instruments used to measure TSI on these satellites.
Note that I consider phrases such as "the correlation between TSI and SSN are pretty good so I can't see a large error in that parameter" to be nothing more than handwaving (regardless of what you are referring to as SSN, which is an acronym that escapes me at the moment). A correlation with something that is not the item of measurement is not a fundamental estimate of the accuracy to which that element (TSI) is measured.
I suspect that you are confusing the accuracy of an input to a model with the accuracy of the model, but I can't be sure where you are going wrong until you give a more elaborate explanation of your thought process.
With unlimited computing power - maybe. The different runs produce outputs from different initialisations. Changing parameterisation adds another dimension as would changing the forcings. I am not convinced that early 20th C forcing are well enough known to make statements that evaluate model skill independent of forcing uncertainities. What you can say is the observed temperatures are consistent with model outputs giving a particular set of forcings. There may well be other forcings at work or various forcings might be incorrect but the model runs do not supply evidence to support this.
@Bob Loblaw #33:
Previous to this conversation I'd downloaded both PMOD/ACRIM data, binned them by month and calculated correlation coefficients against SSN (Sunspot number). The R-Squared for PMOD is 0.80, for ACRIM it's 0.61 for all months 1992 to 2012. I used the reconstructions which splice the data from different satellites by correcting as they see fit the baseline shifts between them. My guess is the PMOD people adjusted the baseline shifts to maximize the correlation with SSNs. No problem with that. Maybe ACRIM went more on first principles and said this is our best guess of the shifts, irrespective of the correlation with SSNs. Either way the correlation is still pretty good. In both datasets, the scatter is much lower for lower SSN months. In the period 1910 to 1945 we generally had lower SSNs through the cycle peaks, than post 1950.
As for aerosols, the volcanic record is what it is, after Katmai there are no major eruptions, so that simplifies the aerosol record somewhat. As for man-made aerosols, 2 facts aid the interpretation of the limits of aerosol change in the 1910 to 1945 period. Number 1, the was no major regulation of emissions in that period, so unit emission per unit consumption did not change much, although there was some displacement of coal by oil. Number 2, the consumption was fairly linear for both oil and coal through this period, the big inflection point in consumption being about 1950.
All that being said, what forcing parameter could we expect to change by a lot in the period 1910 to 1945. My argument, as elaborated above, is that no known climate forcing parameter changed by a lot in this period and the ones that did, we have a reasonable handle on. At times I've thought the aerosol output from WWII is one of the wildcards (burning cities/towns/millions of tonnes of high explosive kicking up particulate matter etc.), but if anything that would have cooled things down, yet there is a distinct temperature peak during the war.
So that brings us back to the question at hand. What caused the rapid warming from 1910 to 1945, given we can't realistically see rapid changes in anthropogenic or solar forcings during this period, which is also more or less free from major vulcanism?
Klapper @35, the a significant portion of combustion in WW2 would have produced black smoke, and hence Black Carbon (BC), a warming factor. In fact, the less controlled the combustion, in general, the higher the proportion of aerosols is in the form of BC. This is likely to have contributed to the spike in warmth in 1940, but there is insufficient BC in glacial records at that time for it to be the primary explanation.
The root cause behind Klapper's Komplaint may be another case of the models being correct and the observations being wrong.
SST Instrumental Biases in 1945
“A large discontinuity in the mid-twentieth century in observed global-mean surface temperature”
David W. J. Thompson, John J. Kennedy, John M. Wallace & Phil D. Jones
Nature, 29 May 2008
Apply this correction and the observed 1910 to 1945 warming rate will decrease to what models understand should have happened according to known forcings.
Link
@Soundoff #37:
Since we've discussed this before, you know there's a step in the land SAT circa 1945 too. However, as I've been informed to take my commentary to a dormant thread, I'll leave it at that.
Klapper@35:
After I had posted my previous comment, it occured to me that you might be referring to Sun Spot Number. Sadly, sunspots are not a measurement of TSI. SSN and variations of it (umbra-penumbra ratios, etc.) are one of the wasy that some people have estimate past TSI. Moderator DB has pointed you to a post here that discusses reconstruction of TSI. Your correlation of TSI to SSN confirms a link, but you have not presented any results that would tell me what the uncertainty in that correlation means in terms of TSI input to a model.
As for aerosols, you seem to be under the illusion that the only thing that matters is volcanic events, and even then only that they happen. Estimating the actual optical properties of the ejecta is important, as is the background level of aerosols from other sources (e.g. industrial).
From that point, all you seem to have is Feelings. You certainly haven't convinced me that you actually understand the importance of the accuracy of inputs to a model for studying past climates, how those inputs can be estimated (in the lack of direct readings), or the limitations that places on what we can do with such a model run.
If you wish to continue this, I will follow you to the What caused early 20th Century warming? thread. Nothing here at SkS is truly dormant - all comments will show up in the Recent Comments thread (in the middle of the main menu bar just under the masthead of each page here at SkS).
Is there any credible graph that shows the relation between green house gases and surface temperature on a time scale of days or weeks instead of years and decades ! Could temperature increase be leading and not lagging the green house gases increase?
TNiazi - No, nothing credible. On the short term the noise from basic weather, not to mention the seasonal CO2 signal seen from hemispheric growth cycles (drop in CO2 over hemispheric spring/summer, rise over the fall/winter), far outweigh the slow changes from greenhouse gas forcings.
A number of 'skeptic' blogs have made such short-graphs, often removing long term trends (differencing or just detrending), and attempting from that to argue a disconnect between GHGs and climate - but such attempts are invariably flawed depictions of short term trendless variation with the long term changes removed.
TNiazi,
No.
3a is difficult, because based on all other known climate factors (solar activity, aerosols, etc.) the earth should be cooling.
3b is difficult, because the basic theory of greenhouse gas effects on climate has been proposed, studied and reinforced through a variety of fields (physics, chemistry, atmospheric physics, paleoclimate studies, etc.) over hundreds of years. You need to disprove several hundred years of science to make and prove the claim that GHGs do not influence temperatures.
So, in the end, your request is a fool's errand. You need to erase a million other points of data in order to get to the conlusion you are hoping to reach with a simple graph of daily temperatures versus GHG levels.
And, of course, it would be strange if CO2, CH4, etc. exhibited different behavior if put into the atmosphere by natural process versus being put into the atmosphere by human emission. CO2 can be a forcing or a feedback.
TNiazi wrote: "Is there any credible graph that shows the relation between green house gases and surface temperature on a time scale of days or weeks instead of years and decades !"
Depends on which greenhouse gases you are talking about. Gases like CO2 and methane quickly mix throughout the atmosphere and thus take a long time to accumulate a significant change in any given area. Water vapor, on the other hand, can vary wildly in concentration by locale. You might have a 100 degree Fahrenheit day in both Florida and Utah, but the humidity (i.e. water vapor level) in Florida is almost always going to be much higher. As a result, once the sun goes down Florida and other humid areas lose heat more slowly than Utah and other arid regions due to the difference in greenhouse gas levels. That is, as most people know, deserts get cold fast once the sun goes down while humid areas can stay hot and sticky all night.
Offhand, I don't know of any graphs showing this greenhouse impact of water vapor on temperatures over short time frames, but it generally falls into the realm of 'common knowledge'.
This line seems to be poorly written: "Overall, Jones et al. (2013) concludes that greenhouse gases have caused between 100% and 200% of the observed global surface warming over the past 60 years"
The other statements seems to accurately portray conslusions of the Jones paper (aerosols and other natural variability caused us to warm slightly less than expected by balancing/off-setting a portion of the GHG-caused energy gain), but your wording above seems to have confused some folks. Thanks.
clarification: As you did correctly summarize in your post, Jones et al's main conclusion was that GHGs dominate the observed warming. But that statement of having cause 200% of observed warming is just bad wording. Thanks again.