


 Arguments


The latest global temperature data are breaking records
Posted on 15 June 2015 by John Abraham
Just today, NASA released its global temperature data for the month of May 2015. It was a scorching 0.71°C (1.3°F) above the long-term average. It is also the hottest first five months of any year ever recorded. As we look at climate patterns over the next year or so, it is likely that this year will set a new all-time record. In fact, as of now, 2015 is a whopping 0.1°C (0.17°F) hotter than last year, which itself was the hottest year on record.
Below, NASA’s annual temperatures are shown. Each year’s results are shown as black dots. Some years are warmer, some are cooler and we never want to put too much emphasis on any single year’s temperature. I have added a star to show where 2015 is so far this year, simply off the chart. The last 12 months are at record levels as well. So far June has been very hot as well, likely to end up warmer than May.

Global surface temperature estimates from NASA GISS.
So why talk about month temperatures or even annual temperatures? Isn’t climate about long-term trends?
First, there has been a lot of discussion of the so-called ‘pause.’ As I have pointed out many times here and in my own research, there has been no pause at all. We know this first by looking at the rate of energy gain within the oceans. But other recent publications, like ones I’ve written about have taken account of instrument and measurement quality and they too find no pause.
Second, there has been a lot of discussion of why models were running hotter than surface air temperatures. There was a real divergence for a while with most models suggesting more warming. Well with 2014 and 2015, we see that the models and actual surface temperatures are in very close agreement.
When we combine surface temperatures with ocean heat content, as seen below, a clear picture emerges. Warming is continuing at a rapid rate.
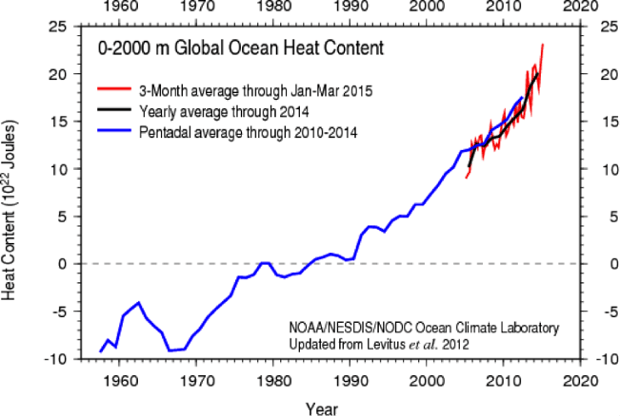
Global ocean heat content estimates from NOAA.
There is an emerging view that the so-called surface warming slowdown was caused from poor instrument coverage around the globe, volcanic eruptions, and a multi-year oscillation in the oceans. The issue of instrument coverage is being fixed as we speak.
But, any short term fluctuations can only temporarily influence the long term trend. In the ocean heat content image above, you might notice a slight change in the trend around 2005. The trend change has since disappeared; it was associated with the ocean oscillations I mentioned earlier.
The recent warming skyrocket has put the contrarians in a bad position. In 2013, when contrarian Christopher Monckton repeated a claim that temperatures might decrease by 0.5°C in two years, I challenged him to a $1000 bet. He never took that bet, but we can see he would have lost handily if he had.
More recently, contrarian Judith Curry was reported as warning about decades of cooling (or perhaps lack of warming) stretching out to the 2030s. We see that this prediction is not looking very likely. Other contrarians have made similar predictions and it makes one wonder how much evidence will have to pile up before they climb down.
Just a few months ago, Roy Spencer (another climate contrarian) claimed, “We are probably past the point of reaching a new peak temperature anomaly from the current El Niño, suggesting it was rather weak.” While it remains to be seen whether or not he is correct, his own data have shown an uptick in temperatures, and the most recent months have continued the very warm trend. Barring something really unusual, the trend will continue until the end of this year.
I asked climate expert Dr. Joe Romm, Founding Editor of Climate Progress for his thoughts. He reminds us,


"2015 is a whopping 0.1°C (0.17°F) hotter than last year"
So where does that put us wrt pre-industrial levels?
It seems to me that this is the temperature that should always be referenced in such articles. It's hard enough for those of us who follow this stuff closely to keep these various metrics straight. A casual reader, remembering that he had heard that we were already at about .8 degrees C a few years ago might take these latest readings as good news.
Clear, consistent communications and all that...
What to make of the satellite records that post 1998 look considerably flatter than GISTEMP? The new version of UAH seems to be much more in line with RSS. Does that mean that this looks now like a consistent measurement, but with satellites measuring something other than the surface temperatures? Or is it likely that they are measuring same thing as the surface stations, but the differences mainly arise from biases and errors? If the satellites are measuring something different, can they be compared to the corresponding values in models? If the satellites are more sensitive to El Nino warming then should we expect to see them really shoot up with the next El Nino peak? Where can I find the best discussion of these questions?
[TD] What scaddenp wrote. A consequence of those satellite-measured altitudes' temperatures varying more than the surface is that confidently detecting trends in satellite tropospheric data requires data across longer spans of time (the trend is the signal that must be teased out of the noise). Also, satellite temperature measurements are far more complicated to construct and rely on a great many more assumptions than surface measurements do, making them inherently more finicky and suspect than surface measurements. For example, because the satellites peer down through the stratosphere that cools due to greenhouse gas increase, satellite measurements of tropospheric temperatures must be constructed by removing the temperature of the stratosphere, else tropospheric temperatures will be measured as not warming as much. (RSS relies on a climate model to construct its measurements.) Similarly, satellite measurements of "upper troposphere" and "mid troposphere" and "lower troposphere" all must be constructed by attempting to remove the other layers. But those "layers" are not really sharp layers, making the whole exercise quite fuzzy. And then there is the disagreement between balloon-borne radiosondes and satellites. Read the Basic, Intermediate, and Advanced tabbed panes of the post "Satellite Measurements of Warming in the Troposphere." Then read the "More Evidence" section of this post about the tropospheric hot spot.
JoeK -RSS and UAH attempt to estimate lower troposphere temps (the lower 4km approx of atmosphere) rather than surface temperature. These temperature parameters shows a much stronger response to ENSO than surface temperature does (colder in La Nina, hotter in El Nino). 1998 and 2010 were El Nino years and 1998 was a monster. We have had an unusual run of La Ninos/neutral condition since 1998. You would not expect a record in RSS or UAH unless El Nino is present (there is a few months of lag). El Nino is building. I would expect a new record at a smaller ONI value than 1998. 2015/2016 might be that year if the index gets to 1.6-1.8 or so.
Actually the wikipedia article on UAH contains a lot of useful information about MSU-based measurements.
it is time for us to all realize that we have effectively doubled the Top of Atmosphere energy imbalance in only the last 7 years.
The energy imbalance value used in the "hiroshima bombs" graphic is only 0.6 Watts per Meter squared. These Ocean Heat Content and observed surface temperture records indicate that we are rapidly approaching 1.2 Watts per Meter squared of additional energy being absorbed by the planet, over the entire surface of the earth.
Your article states:
"I asked climate expert Dr. Joe Romm, Founding Editor of Climate Progress for his thoughts. He reminds us,
Historically, the global temperature trend-line is more like a staircase than a ramp. It now appears we are headed for a step-jump in global temperatures that scientists have been expecting."
But on your home page you have an animated gif titled The Escalator which shows "How Contrarians View Global Warming" as a staircase then shows "How Realists View Global Warming" as a ramp.
Does this mean that Joe Romm is a contrarian?
The escalator shows that deniers can always say the temps are decreasing if you intentionally misinterpret noise hard enough. The ramp shows that if you look at appropriate lengths you get a linear rise.
The escalator does not show, though such a graphic could be made, that at short intervals the temp gain is not smooth. But that was not it's purpose. No one understanding the science ever expected a smooth, monotonically precise increase month over month year after year. As such, "pauses" and "jumps" have to occur over short runs when the trend is an order of magnitude less than the noise.
Of course you know this.
OK, so it's correct to call it a "staircase" but completely incorrect to call it an "escalator"?
Depends on how you like your metaphors. Given how greenhouse gas warming works, "escalator" works fine for me. We are indeed being carried upward. I suspect it works fine for most people who understand the science.
Maybe you should ask the authors.
Sean,
The contrarians are not calling the increase a staircase. They are claiming the temperature is going down by selecting short periods. Either a staircase or an escalator is fine, as long as you acknowledge that you are always going up.
Sean, where I a moderator I would delete your posts as off topic sloganeering, ie, for deliberate violation of two requirements of the comments policy. As you well know, the pseudo-skeptics repeatedly argue during any interval of flat or negative short term trends that those flat or negative short term trends "show global warming has stopped" or "falsify the models". They do not project continuing long term warming at the long term trend. Rather they project it at the short term trend, or less. The escalator comes about solely because every few years the lumpy progress results in a new record high temperature, and a new "pause" that "shows global warming has stopped" or "falsifies the models", at least according to those pseudo-skeptics.
That contrasts sharply with Joe Romm who projects long term trends at or above the current levels but merely points out that the long term temperature evolution, while consistent with the long term trend, will show a series of flatter short term trends, each followed by a short term rapid rise in temperature.
But, of course, as jgnfld has noted, you already know this. You are in fact deliberately ignoring that which you know in order to make an empty rhetorical point (hence off topic and sloganeering). That you resort to such underhanded tactics shows the bankruptcy of your intellectual position.
> where I a moderator I would delete your posts as off topic sloganeering
That's a strange thing to say as I'm only pointing out that the final piece of text in the actual article itself seems to contradict how Skeptical Science has been telling us *NOT* to view rising temperatures as.
Either you should view the rising temperature as a staircase/escalator or you shouldn't. I can't see how you can be of the point of view that climate scientsist can say it's a staircase but then berate contrarians for saying it's an escalator.
'I'll take,"What is statistical significance?", for $500, thanx mom'! (Who happens to be a maths teacher btw lol!!)
@6, consensus starts with nomenclature: you can't deal with logic like that!
Sean O'Connor, either staircase or escalator is a reasonable analogy. The reason "escalator" fits slightly better is that it illustrates very nicely that "Time's Arrow" is pushing us up those steps whether we like it or not. It's been 17 years since we've had a really powerful El Nino and this year looks like it's building to a record-breaking size. This year's "step up" may be twice (or more) the size of 1998. Time will tell. The hideous stripe of red stretching across the the Pacific to the Indian Ocean may signs that a fair amount of that so-called "hiatus" heat is being kicked out into our faces. IMHO, this year will convince a lot of genuinely skeptical folks that AGW is very real. The ideologues...probably not.
> either staircase or escalator is a reasonable analogy.
OK, then why have an animated gif on the front page of Skeptical Science deriding contrarians for saying the warming is an escalator?
Is it? Or isn't it?
Who has derided anyone for saying warming is an escalator?
Q: How is warming like an escalator?
A: a. No matter what you do scampering around like a child, you generally get carried upwards.
b. If you track the line of the stairs as they go by through a slit on the side they wiggle in a saw tooth way.
c. So long as the power stays on, you will continue to climb.
Methinks you are strugging mightily to no particular purpose.
Sean, think of it this way: stairs consist of a rise and a run. Contrarians stubbornly focus on the "run" while ignoring the "rise." On a real set of stairs, a head injury is usually in the offing. Whether you use a "stairs" or "escalator" analogy is unimportant. Both inevitably step up and not down. In order to reduce the size of the rise on those steps, we need to reduce the amount of carbon we're pumping into the atmosphere. There's no other way...as yet.
> Who has derided anyone for saying warming is an escalator?
Just go scroll up on this very page until you see the animated gif called "The Escalator"
Part of the time it is labelled "How Contrarians View Global Warming".
It could equally well be labelled "How Joe Romm Views Global Warming".
Sean, where you are going wrong is in the belief that, "Skeptical Science [is] deriding contrarians for saying the warming is an escalator".
The 'escalator' terminology for that graph was created by SkS... not 'contrarians'. The derision comes in reference to their insistence on looking only at the 'flat' periods and not the overall trend.
Sean,
You are misinterpreting the figure Sean and that is why you are talking past people. This figure is not deriding contrarians for saying that temperatures have risen like an escalator. We wish that climate contrarians would see the temperature graph as an esacalator. That would be a step forward...or upward! Instead, we get repeated claims that climate has stopped warming in recent years, that climate is a flat runway, or a cycle that will return to some long term mean.
Th animation points out that these claims of stasis in global temps are just a form of cherry picking...if you pick a short enough interval, you can depict virtually the entire tempreature record as a series of pauses in warming. Adopting this approach since the 70s would have lead you to the conclusion that the climate had "stopped warming" for 40 years!
But of course that isn't the case, because each of these supposed flat periods are each higher than the next, forming an escalator or staircase. The repeated periods of stasis are a statistical artifact, a result of short-term natural variability in the climate system superimposed on the longer-term upward trend.
After this El Nino they will probably start doing it again, using 2015-2016 as a starting point for their trends showing no warming.
No, the title of the graph is "The Escalator". Escalators don't just have 'flat periods'.
It's clear from that title that the point of the graph is to deride contrarians for thinking that the temperature has gone up like an escalator.
If not, then I'd advise updating the animated gif so when it shows how realists view global warming it shows the flat periods and the steps up. In other words exactly how Joe Romm has described it: as a "staircase".
[JH] As has been pointed out to you by more than one commenter, you are completely missing, or stubbornly refusing to acknowledge, what the Escalator graphic was desgined to illustrate. In any event this conversation has run its course. You have violated the SkS Comments Policy's prohibition of escessive repetition and your future posts on this topic will be summarily deleted.
Sean wrote 'Part of the time it is labelled "How Contrarians View Global Warming"'
I find it hard to see why you don't understand that the phrase means that 'contrarians' see only the short term trends (blue lines) and not the long term trend (red line). By looking at short term trends which are influenced by things other than greenhouse gas forcing, 'contrarians' see one cooling/pause phase after another and proclaim these to the world as some sort of evidence of the invalidity of cliamte science. They do this by turning a blind eye to a long term trend, which is what the global warming signal shows up as.
Stephen, the mistake is assuming Sean does not know that already. He is clearly being disengenuous in order to make a vacuous rhetorical point. Anybody who doubts that need only follow "The Escalator" link on the right sidebar, and from their to the first article, "Global Surface Temperature: Going Down the Up Escalator, Part 1", posted 5th Nov, 2011 where they will read:
In other words, from the first introduction of the escalator, the point very clearly being made was that pseudo -skeptics focus on short term trends to argue that AGW has stopped (and ergo that the next "tread" of the global temperature series will be no higher than the one from which they draw their inference); whereas history shows that there are many such treads, each of which has been successively higher generationg a long term rising trend in temperature; and that ergo it is foolish to argue from the existence of the latest tread that AGW has stopped.
This point has been explained very clearly to Sean, several times. If he was at all honest in his rhetoric, his response to jgnfld @7 would have been to acknowledge his misunderstanding of the escalotor rhetoric, and to acknowledge further that properly understood he had no point.
Instead he doubles down.
Nobody is that stupid. He is deliberately indulging in dishonest rhetoric. Possibly he is doing that just to generate noise in the discussion, or because he gets a kick out of generating responses to ridiculous claims (ie, he is trolling), or maybe he just wants to get a rise. Whatever his motivation, treating his comments as serious is a mistake. He is making an absurd, empty point and the only thing he proves thereby is his dishonesty or his atonishing stupidity. End of story.
That has been duly noted and the only response he should now recieve is to be ignored until the moderators undertake the tedious task of cleaning up yet another denier vomitus utterings.
Tom,
I agree, one should be able to understand the point without too much effort, especially if you actually read the associated text. And Sean should be able to make the point as a suggestion for improvement rather than as a point of confrontation.
But, I'm not so sure that there isn't some original confusion that ended up with some doubling down when pride got in the way. I'm also not sure no one is that stupid...pride can make people pretty dumb.
If we take the initial confusion at face value, I think there could be a subtle problem with the header to the animation, which states "How "skeptics" view global warming". That's confusing because a skeptic would not characterize the record up to each step in temperature as indicating global warming. It might be less confusing to say "How "skeptics" view the temperature record."
It's a small thing, but being in the classroom all the time, I get to see first hand how subtle things like that can send people completely off into the blue. And once there, they don't want to fall to earth in a heap.
Like Tom, I don't for a moment think Sean is stupid enough to believe he has a substantive point... But there is a subtle issue with the combination of the graph and the wording. 'Skeptics' do not see the temperature trend as a series of similar steps. They see (or claim to see) all previous steps as unimportant noise on a ramp and the last step as the one true step that indicates waming has stopped.
The graphic might be better to replace all previous steps with a ramp, and highlight the one true step (which is always the last step) as being somehow magically different to the previous ones. Or the previous steps could be labelled false steps with the final step being highlighted as the true step. The animation imples that 'skeptics' are willing to see a series of similar steps, when in fact they only want to talk about the last step.
Sean's rhetorical argument misuses three important details. I think these are important in a general sense for considering the techniques of denialism, even in the face of record-setting global temperatures (whcih is the toic of this thread).
1) The difference between the denialist view and the staricase/escalator view is that denialists refuse to acknowledge one step is connected to the next. Each step is seen in isolation. Joe Romm et al would draw connecting lines from one step to the next. Denialists do not, and instead use each step as "proof" that nothing is happening (or even that the Earth is cooling). This matters in a general sense, as denialists argue in part by taking short-term data in isolation. 2) Sean is attempting to argue that denialists and Joe Romm actually agree on what's happening, i.e., that there are "steps". Yet, as has been pointed out, no denialist has argued that the Earth is warming in steps. This matters in a general sense as an example of dishonest argument; Sean is implying (though refsues to state, since it is so absurdly and obviously not true) that Joe Romm agrees with and supports the denialist argument.
3) Sean is arguing about the analogy as a way to distract from the actuality. Analogies are a useful pedigogical tool in teaching complex concepts. Their danger is that all analogies have limits. Denialist can seize on the limits of any analogy, and use it to argue that the underlying concepts are themselves false. Ex: since the atmosphere isn't made of wool or any other woven fabric, carbon dioxide cannot really "act as a blanket". Same here; by engaging in argument about the escalator/staircase analogy, Sean is attempting to cast aspersions on the whole science of climatology.
It's useful to be aware of the techniques being used, so as to not get caught in the content-free traps being set by denialists. Sean should simply be asked if he prefers to say the Earth's temperatures are rising in the form of a staircase or an escalator, or if he prefers to conentrate on the even longer-term trendlines that smooth the shrot noise into insignificance. In all cases, the overall trend is upward. Right, Sean?
dcpetterson - "...no denialist has argued that the Earth is warming in steps..."
Actually, that's not the case. B. Tisdale who frequently posts at WUWT often claims 'step changes' based upon ever-shrinking areas of Pacific sea surface temperatures. Neglecting ocean volume data and the rest of the sea surface, the effects of a warming atmosphere on ocean energy loss, and for that matter anything resembling statistical significance by claiming steps separated by as short as 5-10 years.
The trick there is he's claiming these steps are some kind acyclic variation of and by themselves, that ENSO is driving all of recent climate change (he participated for a while on SkS discussing this here, before leaving in a huff without answering any real questions), and that CO2 changes have had no effect. In short, "it's not us".
Sean, on the other hand, is just being disingenuous.
KR,
Thanks for the correction and additional information. Was B. Tinsdale actually arguing that the Earth is warming (perhaps as an ENSO-caused natrual phenomenon unrelated to human activity), or that there are ENSO-caused sawtooth cycles that keep resetting the overall global temperature back to where it previously was?
dcpetterson - You know, it's really hard to tell exactly what Tisdale is arguing at any one time. He tends to write these spews of text and meaningless graphs going on and on for pages at a time...
That said, he appears to feel that it is indeed warming (although I seem to recall him engaging in conspiracy theories about temperature adjustments and how much), but that it's entirely due to recent ENSO variations rather than any anthropogenic influences. Despite the fact that warming atmosphere and warming oceans make an ENSO-only cause thermodynamically impossible...
You get similar arguments from the cycle enthusiasts (think astrology and cosmic influences, or just natural climate Mysterious Unknown Cycles/MUCs), all of whom acknowledge some degree of climate change but claim no human influence. Nicola Scafetta is a prime example of the former, Fred Singer among others has pushed the latter. All examples of the climate denial meme 'it's not us'.
Leto,
I like your suggestion that the escalator gif can perhaps be improved by making each of the "skeptic" steps in turn cause the previous one(s) to vanish--perhaps accompanied by a tag at each new step that says, "See? No warming HERE!" while each recently-vanished one is labelled, "That earlier step wasn't lower!"
The essence, of course, as this thread underlines, is that we're at record high temperatures, as part of a well-documented upward trend, despite denialist noise.
Nah, I think the Escalator graphic is clear enough - folks like Sean are just trying rhetorical nonsense in an attempt to discredit the graphics very clear communication. Because it is so very effective.
If you want an example with denial claims highlighed at each step, though, look at the Arctic Ice Escalator graphic:
Yes, that one's excellent. And yes, denialists are now claiming there is yet another "recovery". They are claiming, in fact, that Arctic sea ice is back to where it was a decade ago, as if the last ten years didn't happen.
Isn't it time to place ocean heat content at the forefront of public (as opposed to specialist) discussion?
Most people are familiar with the fact that water has a much higher heat capacity than gases. Since the measurement and analysis of atmospheric temperature is so complex and in practice open to denialist arguments (false, but enabling doubt to be introduced), it seems to me that ocean temperatures would provide more "clout" in the media.
Wol, I think you're right, it's an argument that should be made. However, denialists are clever in their capacity to disunderstand fact.I've actually had this conversation with some deniers.
Yes, water has a higher heat capacity than gas. That means it's a good heat sink, and can absorb all that nasty heat without causing problems. Heat is vanishing into the oceans, where it is hardly raising ocean temperatures at all. This is just more reason why we needn't do anything about global warming--all that heat is vanishing down the ocean hole.
Believe it or not, that is the argument I've heard. Of course, you and I know that heating the oceans, even a little bit, is dangerous--it affects sea level, and chemical balance, and ocean currents, and changes zones where various ocean creatures can live, and changes precipitation, and on and on with dozens of dangerous consequences. The problem is that these are at least as hard to explain as the truth about (say) tropospheric temperatures, whereas it is very easy for deniers to just keep repeating how very little oceans have actually warmed up.
As a former solar heating system designer and sales person, I am acutely aware of the difference between temperture and heat, heat transfer functions, and the relationship of "delta-t" (temperature differential) to the rate of heat transfer in liquid-based systems. So I understand oceanic heating pretty well for a non-scientist.
Because the oceans are so vast, and have such a high heat capacity, the slow increase in temperature is not easily seen as significant. If you talk about zettajoules of heat added to the oceans every year, you will get a blank stare in response from most laypersons. And the oceans are where most of the heat from AGW is going.
I believe that until climate and weather disruptions are so severe that no one can ignore them, we will still have many contrarians and deniers. And then, it will likely be too late to prevent serious disruptions to human civilization.
The increasing impacts of the heat and temperature spike from each major El Niño event are likely to be obvious. The currently developing - possibly very strong - El Niño, coupled with Pope Francis' soon to be released encyclical, will likely cause some very interesting reactions and flailings in the denialist community. (This has already started.)
I am already getting angry and truly nasty replies to my e-mails from a couple of denialist friends here in my home in an expat comunity in the mountains of western Panama. I have decided to no longer send them articles about current climate issues, because the conflicts are so contentions, that it would jeopardize the friendships.
KR, and team, talking about the Arctic sea ice excalator, has it been updated to 2012? As I recall, it was a record low, that went beyond the already exceptional 2007 but the sea ice graph shows 2007 as the lowest year.
The 'mysterious step-change' is an idea JoNova has promoted before. The notion being that something strange happened in 1998. In her world, temperatures are slowly rising, but there was an inexplicable jump in temps at that point. And because 'we don't know what happened' then it means 'we need more research' and we shouldn't act until we know what caused this mysterious behaviour. In her mind, it's lucky for everyone that eminent scientists like Tisdale are on the case, trying to puzzle out this phenomenon.
The comments that accompany this article just demonstrate the frustration with the AGW CC debate of contrarians versus advocates. There has been an esoteric distracting discussion about, is warming an escalator or a staircase when it is the trend line that is important, as KR@32 highlights with the Arctic Ice record. It is the signal in the noise that is important. Also, it is the 30 years that WMO uses to define a climate period that is important. Not some year to year and decadal length analysis. Not has it slowed down because some peak year is compared against some trough year during the past decade. It is the regression analysis over the last 30 years compared to the previous 30 years, comared to the previous 30 years before that, and so on and so on that is important. This is after all a discussion about climate, not about extreme weather events. There has been nothing that a contarian has said that changes the basic fundamental scientific tenet that CO2 is a greenhouse gas, that CO2 is increasing and because it is there will be warming. Also, there are many lines of evidence that indicate that this basic scientific fact is in fact is true and is actually happening. So where is the surprise in this article. There should be warming and there is. What would be a surprise is that there is no longer warming and it is reversing as the contrarians are trying to argue. To imply that the planet will somehow cool down while greenhouse gases are increasing at the rates they are, is a bit like saying that the Earth will magically reverse the direction of it's orbital motion or direction of rotation at the behest of the hand of God. The only argument relevant is about how much warming will occur due to this and the predicted rise in greenhouse gases, and on the evidence so far over the last century, it would seem that Tindale got it about right.
mancan18,
I agree that a 30 year period is a more valid way of monitoring climate change. However, it is not necessary to compare a 30 year period with the previous 30 year period. The contrarians would have a field day with that. They would say we should wait for another 30 years of data to be sure. And 30 years from now they would say they are starting to be convinced but want to see another 30 years of data just to be sure.
A better application of the 30-year principle would be to report the trend of the 30-year average. A new 30-year average value can be calculated when every new month of data is available. And the 30 year average of global average surface temperature has not leveled off or shifted to a hiatus. And the 30 year average of arctic sea ice has not recently 'recovered' either.
Using the SkS Temperature Trend Calculator with the Moving Average value at 360 months shows a nice continuing to rise line. And the 30-year average is currently rising at about 0.17 C per decade.
Of course I anticipate there would be criticisms from the usual suspects that this is just a trick to try to hide the decline. But it may help others better understand what is going on.
The Decadal comparison (1981-1990; 1991-2000; 2001-2010) has also helped show that warming has continued but it still leads to a claim that we need to wait until 2020 to know if the hiatus was just another of the many temporary leveling off steps on the stair/escalator, then 2030 just to be more certain, then 2040 to really be sure ...
KR: "You know, it's really hard to tell exactly what Tisdale is arguing at any one time. He tends to write these spews of text and meaningless graphs going on and on for pages at a time..."
Everybody can reproduce these graphs from readily avalable data series; the sources are clearly cited. Now tell us what's wrong with these graphs?
@Tristan Actually, the climatic system is chaotic. You do expect such jump from one attractor to another. However, this does not invalidate the law of thermodynamics.
[PS] Please take this to here. Read both tabs.
topal - Yes, the data is real data, but it's so isolated and cherry-picked (small area SST, not global data or volume data) as to show nothing but noise, with deceptive and erroneous baselines, highlighting 'step changes' that he calls significant, but cover periods as short as 5-12 years (i.e., short term variations and not climate trends), etc.
The data is real. But Tisdale looks at leaves, and only those turned the way he likes, not the forest as a whole - making them useless for analyzing global changes. And worse yet he draws utterly unsupportable (and unphysical) conclusions from them. They are meaningless, and in fact deceptive, if your goal is discussing climate change.
While it is true that the first five months of this year have set a record compared to previous years, the difference is not as much as the graph with the red star implies. Strictly speaking, we should only compare annual averages with annual averages.
The corresponding figures for the first five months of the year would also have broken the chart in 2002. 2007 and 2010.
Of course, with the El Nino this year, the annual figure for 2015 may well break the chart and require a new y-axis.
@Yvan
Ah. Can you show me some of the literature that relates to air temperatures 'stepping' from one 'attractor' to another?
Weather is chaotic - do you have evidence to support the assertion that climate is chaotic? The fact that temperate summer average is always warmer than winter average is strong evidence that while weather is chaotic, it is bound by limit of the energy balance.
Any further comment on chaos should go on the thread "climate is chaotic and cant be predicted". Lots of useful stuff there.
Andy Skuce @ 44,
I agree that annual averages would be a more appropriate comparison to previous annual averages.
The average of the 12 months ending in May 2015 is 0.72 C, which is indeed lower than the 0.77 C average for the first 5 months of 2015.
The highest 12 month average in the NASA data set was the 12 months ending in March of 2015 (0.728 C). Using the Temperature Trend calculator it is easy to see that these 12 month averages are higher than any other 12 month period.
And if the El Nino condition continues and strengthens then it is likely that the 2015 values for June and July will exceed the values of 2014 (June 0.61, and July 0.50), by enough to make the 12 months ending in June and then July each the highest 12 month averages in the data set to date. And that is without a strong El Nino increase like 1998.
The 12 months ending in March 2015 should be enough to convince people that the expected warming of the global average surface temperature due to increased CO2 can continued to be seen in the global average surface temperature records, except the most made-up minds or easlily impressed minds that prefer messages dismissing or discrediting that type of information.
Even warmer 12 month averages ending in June or July should not be necessary to convince someone who is open to understanding what is going on. Those results would just make most of those people more uncomfortable, not more inclined to change their minds.
The last sentence was meant to be "Those results would just make most of those other type of people more uncomfortable, not more inclined to change their minds."
With NOAA's release of their May globl average surface temperature it can be stated that the 12 months ending in May 2015 are the warmest in the NOAA data set. It can also be said that in eth NOAA data set the 12 month averages ending since March 2014 have been warmer than the warmest 12 month average that occured during the very strong El NIno of 1997/98. The 12 month average ending in May 2015 is 0.799 compared to 0.672 (the highest value during the 1997/98 El Nino event).