Climate Science Glossary

Term Lookup

Enter a term in the search box to find its definition.

Settings

Use the controls in the far right panel to increase or decrease the number of terms automatically displayed (or to completely turn that feature off).

Term Lookup

Settings


All IPCC definitions taken from Climate Change 2007: The Physical Science Basis. Working Group I Contribution to the Fourth Assessment Report of the Intergovernmental Panel on Climate Change, Annex I, Glossary, pp. 941-954. Cambridge University Press.

Home Arguments Software Resources Comments The Consensus Project Translations About Support

Bluesky Facebook LinkedIn Mastodon MeWe

Twitter YouTube RSS Posts RSS Comments Email Subscribe


Climate's changed before
It's the sun
It's not bad
There is no consensus
It's cooling
Models are unreliable
Temp record is unreliable
Animals and plants can adapt
It hasn't warmed since 1998
Antarctica is gaining ice
View All Arguments...


Username
Password
New? Register here
Forgot your password?

Latest Posts

Archives

Vanishing Arctic Sea Ice: Going Up the Down Escalator

Posted on 7 September 2012 by dana1981

Over the past three decades, Arctic sea ice extent, area, and most importantly, volume have declined dramatically, to levels unseen in millennia.  2012 is absolutely shattering previous record lows, and we expect the continued long-term sea ice decline (which is predominantly human-caused) to have some serious adverse consequences.  This is a difficult reality to face, and when faced with a difficult reality, denial is often a natural, inevitable reaction.

The easiest way to deny that a long-term change is happening is to focus on noisy short-term data, where it is easy to find any desired trend through cherrypicking - one of the 5 characteristics of scientific denialism.  As we explored in Global Surface Temperature: Going Down the Up Escalator, one just needs to choose a few data points where the short-term trend goes in the opposite direction of the long-term trend and voilá!  Nothing to worry about.

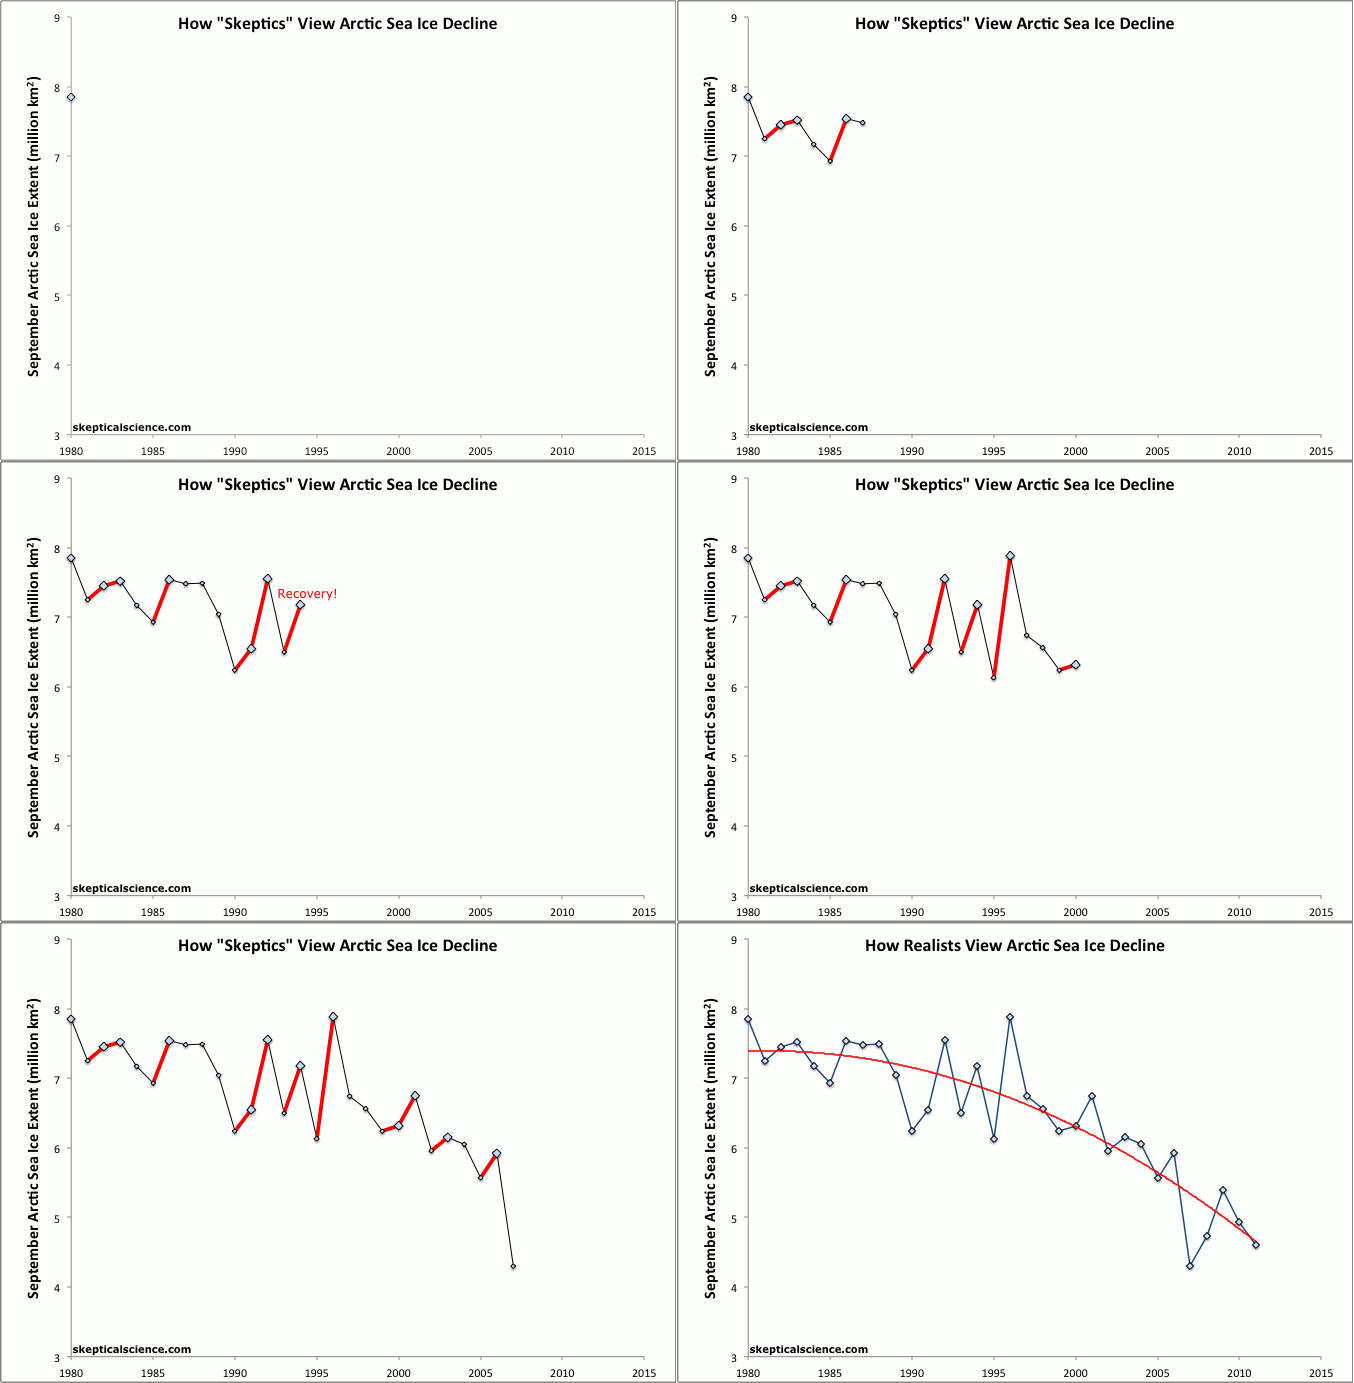
We have created a new animated GIF to depict in a simple and straightforward manner exactly why this focus on short-term data is misguided.  The principle is very similar to 'going down the up escalator' for global temperatures.  In this case, climate contrarians are trying to go up the down escalator, finding very brief periods during which Arctic sea ice extent increases, and proclaiming that it has "recovered," all the while ignoring the accelerating long-term decline (Figure 1).

down escalator

Figure 1: NSIDC September Arctic sea ice extent (blue diamonds) with "recovery" years highlighted in red, vs. the long-term sea ice decline fit with a second order polynomial, also in red.

The Neverending Recovery

2007 was the previous year in which the Arctic sea ice decline shattered all records.  There is a principle in statistics known as "regression toward the mean," which is the phenomenon that if an extreme value of a variable is observed, the next measurement will generally be less extreme, i.e. we should not expect to observe record lows in consecutive years.  This is because when extremes are reached and records are broken, a number of different variables generally have to align in the same direction to make this happen. 

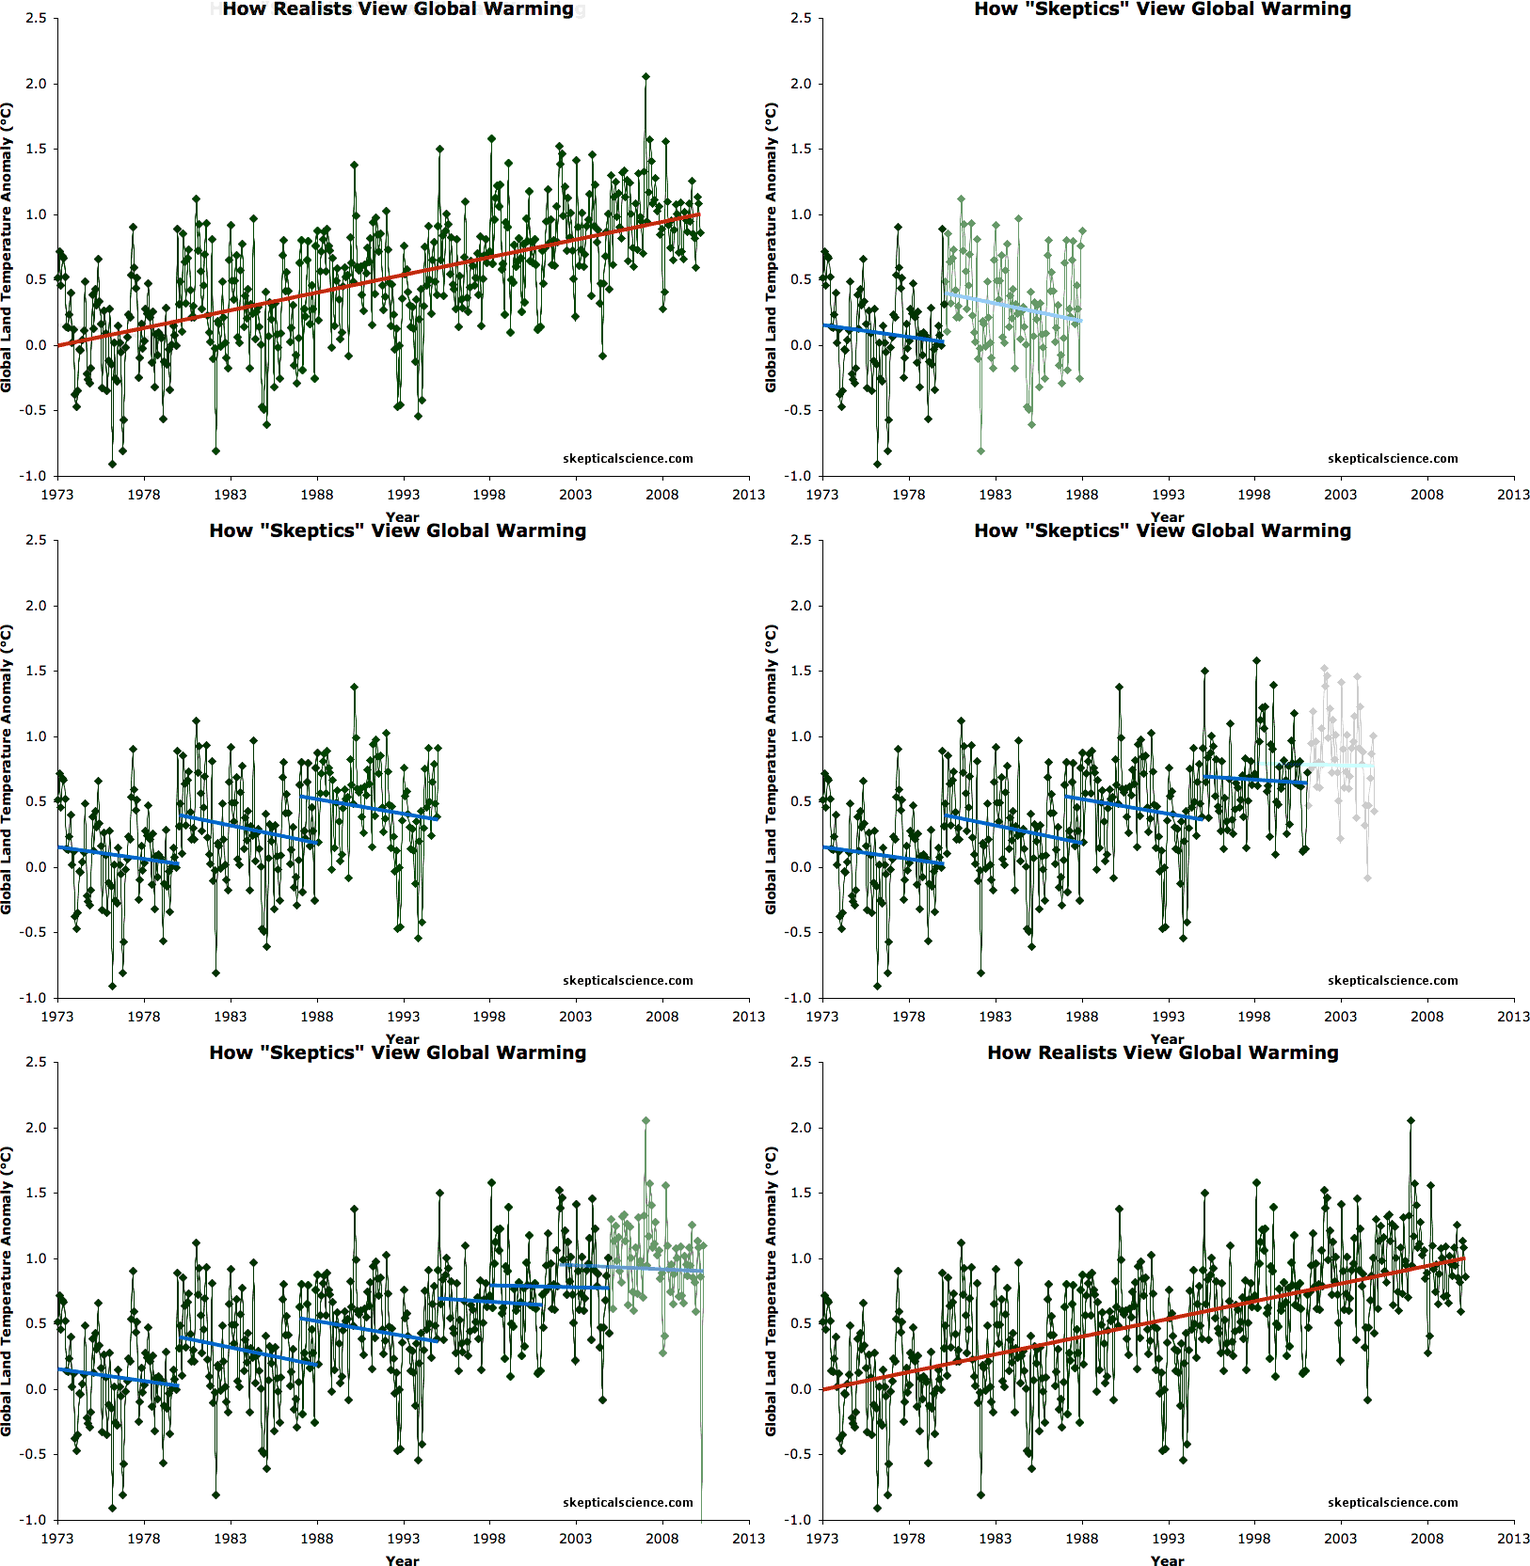
For example, 1998 was the hottest year on record and remained the hottest until 2005 because it involved a combination of an exceptionally strong El Niño, fairly high solar activity, low volcanic activity, and the increased human-caused greenhouse effect.  All of the most important variables happened to align in the warming direction in 1998, which is why 1998 is often used as the starting point to argue that global warming has magically stopped, as illustrated in the global surface temperature escalator (Figure 2).

up escalator

Figure 2: BEST land-only surface temperature data (green) with linear trends applied to the timeframes 1973 to 1980, 1980 to 1988, 1988 to 1995, 1995 to 2001, 1998 to 2005, 2002 to 2010 (blue), and 1973 to 2010 (red). The baseline period is 1950-1980.

Likewise, the record low Arctic sea ice extent in 2007 was not broken for another five years because on top of the long-term human-caused decline, 2007 involved a perfect combination of weather events and natural cycles contributing to even further sea ice loss.

Thus even when there is a long-term trend, extreme events are often followed by a regression toward less extreme values.  This presents an opportunity for those who want to deny the existence of the long-term trend to characterize these regression years as "recoveries," claiming there is nothing to worry about because temperatures seem to be cooling (as in Figure 2) or because Arctic sea ice seems to be bouncing back to normal levels (as in Figure 1).

Slipping Down the Icy Escalator

For example, climate contrarians claimed that after the record low sea ice extent in 2007, the regression years of 2008 (e.g. here and here) and 2009 (here) showed that Arctic sea ice was recovering back to normal, and thus that there was nothing to worry about.  This focus on this short-term two-year "recovery" while ignoring the long-term trend led the contrarians to make some very optimistic predictions about 2010 sea ice extent (here), which turned out to be very, very wrong as the brief "recovery" mirage ended and the long-term trend in Arctic sea ice decline continued to accelerate.  Undeterred, the contrarians continued to make overly optimistic predictions in 2011 and 2012, which similarly turned out to be very, very wrong.  We will have a blog post examining various Arctic sea ice predictions over the past several years once we have reached this year's minimum.

Figure 1 has been added to the Skeptical Science's Animated Climate Graphics Page, and is free for anyone to use and distribute.  We suspect it may very well come in handy next year, as another regression toward less extreme values is likely, and if there is another regression, we can certainly expect the climate contrarians to once again proclaim that Arctic sea ice is on its way to a full recovery. 

We wish their optimism were not misplaced, but sadly it is only a matter of time before the Arctic becomes ice free in the summer.  Denying this reality will only allow the problem to continue doing more damage to ecosystems around the world.

Note: a little late, but my Arctic sea ice post from earlier this week, Record Arctic Sea Ice Melt to Levels Unseen in Millennia, has been incorporated into new rebuttals to the myths Arctic sea ice loss in the 1940s was similar to today's, Arctic sea ice extent was lower in the past, and used to update the Intermediate rebuttal to Arctic icemelt is a natural cycle.  The two new rebuttals also have short URLs http://sks.to/arctic1940 and  http://sks.to/pastarctic.  Our list of short URLs https://skepticalscience.com/shorturls.php is also a useful resource for tweeting and posting in blog comment threads.

0 0

Printable Version  |  Link to this page

Comments

Comments 1 to 32:

  1. Dana, make sure you update it with 2012's figure once the melt season ends! If we're lucky, it will fit on the bottom of the chart...
    0 0
  2. Planning on it, skywatcher! Look for an update in October.
    0 0
  3. It is likely the neverending story will repeat itself in 2013, as there is a sizeable chance 2013 levels will be (a bit) higher than 2012. And, when everything will go horribly wrong, they still will be able to shout "recovery !" when some ice will reappear after the first ice-free Arctic summer. The most important question is : will they still have the mainstream media audience they get nowadays, allowing policymakers to sit on their thumbs ?
    0 0
  4. Very nicely done. I would love to be facile with animation like that. It really makes the point beautifully.
    0 0
  5. If you look at this graph described in neven's blog you understand very well why Arctic Ice is misbehaving starting from middle 2010. You don't need to play silly "WUWT predictive games". Basic data that ridicules those games is available for 2 years already. Wieslaw Maslowski was spot on when he anounced in 2006 that the then trend was leading to ice free sumer 2016. About "recovery". Classic denialists, in my experience, will never stop trumpeting it. It's not only about ice: after 120F summer in USA, there will be "recovery" in winter. Then, there will be "recovery" of oil/gas in Alaska/NWT/Greenland. Sad but very true. If those people are not forcibly shut up, there is no upper ceiling to AGW.
    0 0
  6. Good article, but one point of 'dissent'. I'm not sure it is very likely that we will see a 'regression towards the mean' next year. As stated in the article, this is usually the result after a number of factors have aligned to produce an exceptional anomaly. However, I've read several analyses which say that conditions for melt in the Arctic this year weren't particularly unusual. The 2007 record low ice extent and 1998 record high temperature anomaly were both driven by several major factors all happening to line up in the same direction... but the 2012 record low ice extent was just a 'normal' year so far as melt conditions were concerned. There was one significant storm in early August, but given that extent is still dropping a month later any ice impacted by the storm likely would have melted anyway. The only other 'exceptional' factor I've read about impacting this year's melt was how thin the remaining sea ice has become... but that will be even more true next year. Of course, weather factors could align to produce an anomalously low melt next year... but we could also get weather factors like 2007 and see another profound drop. Thus, the only real point I'm making is that by all accounts I've read this year wasn't an outlier in terms of melt conditions... it was 'business as usual' and the resulting extreme melt thus may be a 'new normal' rather than an anomaly unlikely to be repeated soon.
    0 0
  7. Further to Chris and CB's remarks about what we might expect going forward, there's another startling graph at Neven's blog here, detailing the annual behavior of Arctic Basin sea ice area. Area is of course one of the less favored metrics of sea ice, but it's not the absolute numbers shown in that graph that are interesting but rather the dynamics year-on-year. When I look at ABSIA graph, I don't see an obvious reason why it would revert back to the previous mode of behavior. After 7 years of being "stuck" in an apparently new mode, what's going to change it back to the previous mode?
    0 0
  8. And speaking of dynamic things, that's a very thought-provoking visualization you've created, Dana.
    0 0
  9. Thanks doug. I'm no Arctic expert, but given the huge amount by which 2012 will shatter the previous record, and be well below the exponential trend line, I have to think there were some natural factors at play in this minimum that will likely lead to one of those 'recoveries' over the next year or two. I could certainly be wrong, but that would be my guess.
    0 0
  10. Your graph shows that we can certainly expect recovery to be just around the corner, Dana. It seems we can always count on a corner, though we'll probably soon have to begin restricting the seasonal coverage of the graph in order to find one. What's interesting about the ABSIA graphs and all the others recently behaving in similar hysterical fashion is indeed the superficial appearance of "recovery" from year to year. I suppose that's pretty much perfectly in keeping with what we've learned of diminishing volume. We can see the same behavior in mud puddles-- thick ice takes longer to vanish. Folks new to the topic and who are intrigued should be sure to pay a visit to Neven's Arctic Sea Ice Blog
    0 0
  11. The next question seems to be the developing hypothesis that the dramatic changes in the northernmost latitudes are having a significant influence in the jet stream leading to increasing “blocking” events. These blocking events might be responsible for the extremely persistent patterns in the North America this year that have resulted in the damaging drought and fire events in the US and a wetter than normal summer in the Rockies of BC and Alberta. After three weeks of smoke in Western Montana, I’m certainly ready for it to end!
    0 0
  12. Unpossible! Anthony Watts says that the ice has started to turn a corner this week, and he's always right, isn't he? Sea Ice News Volume 3 number 12 – has Arctic sea ice started to turn the corner? And Joe Bastardi says the ice is "rapidly growing back". When was the last time he was wrong about something? :)
    0 0
  13. It's really astonishing that anyone still takes Bastardi seriously isn't it?
    0 0
  14. Funny thing is, Bastardi links to a map that is labelled "Sea Surface Temperature". On the same website there is an actual map showing extent, and it shows what everybody else is showing. What Bastardi thinks is sea ice extent "rapidly growing back" What the website actually shows for sea ice extent:
    0 0
  15. Robert Murphy, I won’t subject myself to the nonsense at Watt’s webpage, life is too short for that sort of thing. But I note the following alarming statistics: according to my own simple calculations on the NSIDC’s MASIE data, the average loss of sea ice extent for the first 5 days of September 2012 is running at 87,188 square kilometers per day. According to NSIDC’s write up of Sept 5, the average loss of sea ice extent during August in the previous record overall low year of 2007 was 66,000 square kilometers per day. And in 2008, the year with the previous highest monthly August ice loss, the rate was 80,600 square kilometers per day. Finally, the 2012 August average ice loss rate per day was 91,700 square kilometers. So in the first 5 days of September of this year the loss per day is only marginally lower than it averaged for the entire drastic loss month of August, 2012. But it is substantially higher than the August 2007 average loss per day rate and non-trivially higher than the 2008 August average loss rate per day. To quote George W. Bush (late in 2008 and of course referring to the fate of the US economy at the time): “This sucker is going down.”
    0 0
  16. There was a tweet from Ed Hawkins, climate scientist at the University of Reading, UK, this morning to say, "About 80% of scientists at #Bjerknes conf on high latitude climate think there will be more Arctic sea ice in Sept 2013 than 2012". I guess the thinking is that if the last record melt was in 2007 (5 years ago) then the odds on next year being a greater extent than 2012 are around 4 out of 5 (~80%). If that's how the scientists represent the probability then this could very easily become a denial meme that "scientists predict there's an 80% chance ice will recover." Whereas in fact all they're saying is that there's a significant degree of variability overlying the long term trend.
    0 0
  17. Jeff Masters does his usual good job of explanation at his Wunderground blog. Masters features Jim Pettit's interesting plots of Arctic sea ice, using Pettit's depiction of ice extent. The increasingly obvious cardioid shape is a useful cue to changes in annual behavior, plus of course the graphs have a built-in pun.
    0 0
  18. Dana I wonder if your very nice animation was a sceptics bank balance or share portfolio would they be as optimistic for total recovery of their money? Bert
    0 0
  19. If I had to bet, then I would go with "recovery" in 2013 as well. However, I would also bet on a new record low within 5 years.
    0 0
  20. Bert from Eltham: I am constantly struck that so many people who are so passionately committed to the Free Market™ apparently cannot detect a clear long term trend in an unsurprisingly noisy graph. Perhaps this explains the GFC? ;-)
    0 0
  21. Great post. Looking forward to the arctic predictions Vs Reality article, that one will really hold people to account.
    0 0
  22. yocta @21 - thanks. Yes, that should be a fun post.
    0 0
  23. @John(16), were those scientists talking about ice extent, or volume?
    0 0
  24. Sorry, @Mark, #23, I just got the tweet didn't question it. I'll tweet Ed Hawkins and see if he'll respond here. My own (lay) thought is that as multi-year ice has decreased, volume is more closely becoming a function of extent/area and therefore the distinction is becoming less important. Would that be right?
    0 0
  25. Hi John, Mark, My straw poll of scientists was referring to area rather than volume. Mainly because volume is not well observed. Ed.
    0 0
  26. HAHAHAHA!! I went to one of the linked posts by Watts. It's from 2008 and claims "that the recovery is at a significantly faster rate than in recent years." Clumsy old Watts hotlinked the extent graph from JAXA instead of hosting it himself. The thing is, that image is updated every day, so his post from 2008 now proudly shows a picture from 2012. "Look at the red line!"
    0 0
  27. Daneel @26 - Let's be fair to Watts. That graphic would indeed show a quick sea ice extent recovery if you would just flip it upside-down. I'm sure that's what he meant. After all, Watts seems to view the world upside-down and backwards.
    0 0
  28. @ dana1981 #27: I do believe that you are being a tad too harsh on Watts. After all, he and the Wattsonians come from a parallel universe where the laws of physics and chemistry are entirely diffeerent than those that apply here on Earth.
    0 0
  29. I've made a new animated graph of Arctic Sea Ice Volume with PIOMAS data to 2012-09-02. The previous version was used last week by the BBC's Newsnight programme: Arctic ice melt 'like adding 20 years of CO2 emissions' - a nice surprise!
    0 0
    Moderator Response: [DB] Fixed text.
  30. dana@27: Which came first..the chicken or the parallel egg? Parallel Earths I *thought* I'd run into Watts, somewhere before I began visiting here...all of these threads showing what's going on in the Arctic, are really, truly becoming frightening. I don't easily frighten, either: my ex was an Aussie...;)
    0 0
  31. The "Climate Realists" website has republished Bastardi's claims about the "rapid recovery" of Arctic sea ice this month, along with his picture. Even after I pointed out the picture was not what he claimed it is, the site moderator yelled "Squirrel!!" and changed the subject, but the picture still stands. They really don't care if it's correct or not, as long as it fools enough people. http://climaterealists.com/index.php?id=10209
    0 0
    Moderator Response: [Sph] Link added by request.
  32. It's typical. However wrong you may be, never admit a mistake. I found this trait relatively common. For a real professional it would be the end of the career but apparently this simple concept does not apply in certain quarters. It's a mistery.
    0 0

You need to be logged in to post a comment. Login via the left margin or if you're new, register here.


The Consensus Project Website

THE ESCALATOR

(free to republish)


© Copyright 2024 John Cook
Home | Translations | About Us | Privacy | Contact Us