


 Arguments


Arctic sea ice extent in the past
What the science says...
While there have been times in the distant past when Arctic sea ice extent was lower than today's, the current sea ice extent is the lowest in the past several thousand years.
Climate Myth...
Arctic sea ice extent was lower in the past
"...there [is] anecdotal and other evidence suggesting similar melts from 1938-43 and on other occasions." (John Christy via Jonathan Leake)
It's important to note that we expect the Arctic to have been cooling over the past ~6,000 years due to the Earth's orbital cycles. Thus if we look back far enough in the past, we can certainly find a period during which the Arctic was hotter and Arctic sea ice extent was lower. However, this actually contradicts the argument that the current sea ice decline could be natural, because that long-term orbital forcing has not reversed, and thus cannot account for the sudden and rapid Arctic warming and concurrent sea ice decline.
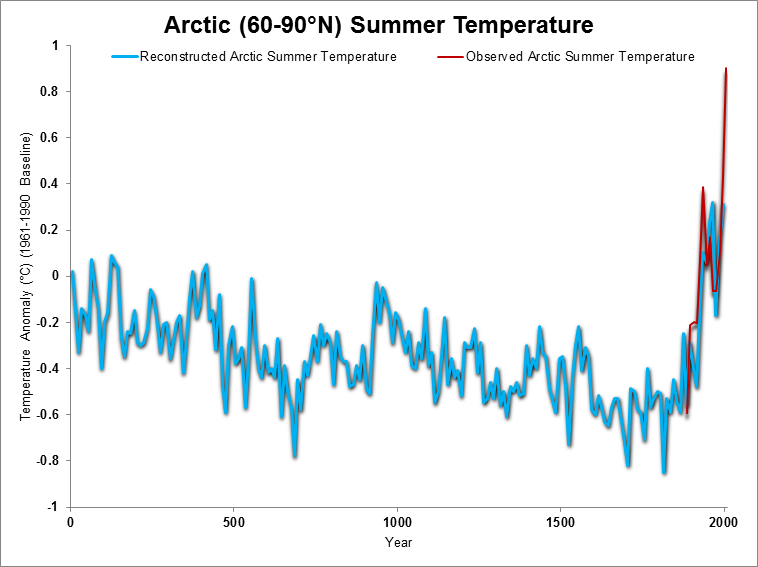
Kaufman et al. (2009) reconstructed past Arctic temperatures, and confirmed that the Arctic had been cooling for at least the past 2,000 years prior to the 20th Century, and found an Arctic temperature 'hockey stick' (Figure 1).
Figure 1: Arctic temperature change reconstructed by Kaufmann et al. (2009) including data updated for corrigendum and including instrumental measurements for the Arctic region (60 to 90° N) from NASA.
Perhaps the authoritative paper on Arctic sea ice extent over the past 1,450 years is Kinnard et al. (2011), which used a combination of Arctic ice core, tree ring, and lake sediment data to reconstruct past Arctic conditions. The results are shown in Figure 2.
Figure 2: Arctic sea ice extent over the past 1,450 years reconstructed from proxy data by Kinnard et al., with a 40-year low pass filter applied. Note that the modern observational data in this figure extend through 2008, and thus it is a close approximation of current conditions, even though the extent is not as low as current annual data due to the 40-year smoothing.
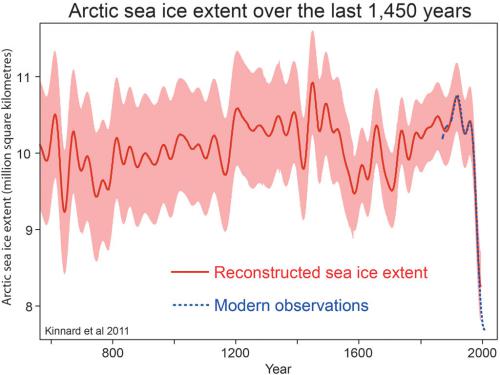
Based on the Kinnard results, Arctic sea ice extent is currently lower than at any time in the past 1,450 years.
Polyak et al. (2010) looked at Arctic sea ice changes throughout geologic history and noted that the current rate of loss appears to be more rapid than natural variability can account for in the historical record.
"The current reduction in Arctic ice cover started in the late 19th century, consistent with the rapidly warming climate, and became very pronounced over the last three decades. This ice loss appears to be unmatched over at least the last few thousand years and unexplainable by any of the known natural variabilities."
Last updated on 19 September 2013 by dana1981. View Archives


Good information, thank you. There is nice irony in an argument put forward by a "sceptic" in reality providing evidence for AGW. I have a question of fine detail - not because I want to criticise, but to fine tune my understanding. The OP mentions changes in the Earth's "orbital" motion: is it really the orbital motion that's operating here, or is it the Earth's rotational motion? I can envisage the Earth's precession around its rotational axis as having exactly the effect discussed, and that font of all knowledge, Wikipedia, tells me that the period of Earth's precession is around 26,000 years, which seems to fit in with the argument.
Hi. I came looking for historical Arctic sea ice coverage and saw this article for the first time. The figures looked wrong. You say the Arctic sea ice extent has rumbled along at about 10 to 10.5 million sq. km for 1450 years before suddenly plunging to 8.5 m sq. km about 1950 (maybe later - hard to tell with that resolution). But Cryosphere Today reports 12.8 m sq. km today, and the 1979-2008 mean they use is about 13.7 m sq. km. This means no modern decrease as shown on your graph. What's going on?
Richard, the first problem is that you are treating two different things as if they were the same. Cryosphere Today reports sea ice area. The second graph above shows sea ice extent.
The precise meaning of 'extent' varies from source to source, but the majority use something like 'the area of ocean surface with at least 15% ice coverage'. So, if you had a 100 meter x 100 meter section of ocean with 15% of it covered by ice that'd be a sea ice extent of 10,000 square meters, but a sea ice area of only 1,500 square meters.
Second problem - You are comparing daily values to decadal values. Look at the Cryosphere Today charts again and instead of looking at the current (near winter maximum) values look at the annual minimums instead... 1979-2008 mean below 5 million sq km... OMG, that's far lower than anything in the chart above! There must have been a huge sea ice collapse! Or not. Obviously the ice extent and area vary wildly throughout the year. Since the chart above is showing the extent averaged over decades these inter-annual fluctuations are averaged out.
Third problem - What constitutes 'the Arctic'? Just the 'Arctic circle'? The 'Arctic basin'? Any region north of the equator which has ever had sea ice coverage? Different data sets are looking at different regions.
Richard Treadgold @2, Cryosphere Today is reporting an area 12.8 million km^2 as we approach the spring maximum in sea ice area (and extent). Kinnard et al reports on the sea ice extent at the "late summer" (September). As can be seen from the Cyryosphere today graph (below), the September Minimum is has recently been around 4 million km^2, ie, significantly less than approximately 8 million km^2 shown at the end of the Kinnard et al reconstruction.
The reasons the final reconstructed values are near double the comparable values in the Cryosphere today chart are because it is a reconstruction of extent, whereas the graph shows area; because the reconstruction is unlikely to have achieved resolution of a single month, and therefore shows a two or three month average; and because late summer sea ice extents have reduced significantly since the end of the reconstruction (1995).
Thank you, gentlemen. Let me absorb this.
I have been looking for reliable information on this specific issue. For one it's kinda important, and another reason is I am buying a home in florida on the water and dont want it "underwater" in my kids lifetime.
My worry about the northern ice cap is that if it gets too small it will "detach from underlying land masses" and essentially be a huge iceberg banging around up there. If you have ever lived on (or near) a lake that freezes from shore to shore you think every spring "wow that is really thick this year its never gonna melt", then a little lake level rise from runoff "floats the solid ice", cracks form, huge ridges between two sheets pushed by wind rise up, and poof just like last year its gone and you are out fishing.
I would like to relate this to a personal observation that happens when I have a party (lame I know but stick with me). If I buy soda the day before and put it all in the fridge, and for the party take it out and serve chilled two liter bottles I dont run out of ice from my fridge's icemaker. If I need to run to get more soda from the store I grab some bags of ice, because the warmer soda will need more ice in the glass to cool the drinks and my ice maker cant keep up.
The Chart in the post above that tracks the ice through the season as the sun melts it and then cold temps in winter refreeze it (we are talking about sea water here, and I understand that the thermocline of the ocean is in play here), will the ice being able to rotate end up solving the problem as deeper colder water can mix to the surface faster, promoting earlier ice formation after the equinox? Or the opposite, that mixing would not allow ice formation because the cooling surface water would sink faster before it crosses the 4C density inflection where cooler water starts floating above warmer?
Sorry to ramble a bit, I am just projecting my little lake here in Colorado (Lake Dillon) melting in spring compared to an area larger than I can comprehend.
Outinthe snow,
Where in Florida are you moving? All of ocean front Florida is pretty low. New houses are built on 2 meter pads with the ground floor being sacrificial. They are "safe" from 15 feet of water. Is yours a new home or an old one at ground level?
No-one will garantee that your home will be safe. You will have to read the data carefully. Virtually any ocean waterfront property in Florida is at risk from sea level rise. This Climate Central map app gives some idea of how high the sea will rise in a best case and buisiness as usual case.
Unfortunately, none of these cases tells us how fast the sea will rise. For the West Antarctic Ice sheet recent analysis have said it could melt in decades to centuries. That will not help you much. If it is decades your children will see your house submerged while if it is centuries they will be fine.
This Realclimate post gives expert opinion on sea level rise to 2100. it ranges from .5-2.0 meters. The Antarctic data came out after the experts were surveyed, they might increase their estimates now. Most of that rise is likely to happen after 2050, is that long enough for you?
I wonder how much flood insurance will go up the next time a city is inundated. After Sandy they were talking about insurance rates higher than mortgages. I think these rises are more likely going forward, what do you think?
Good luck. Post what you decide to do. If a lot of people decide not to buy in Florida it will start to affect nvestors. Perhaps the government will notice.