


 Arguments


Prudent Path Week: Polar Regions
Posted on 25 February 2011 by robert way
 As discussed recently, this week is Prudent Path week where we address some of the scientific missteps and contradictions in the two skeptic documents that have recently gained some attention through being referenced in a "skeptic" letter to the US Congress.
Today’s contribution to the series will specifically address some claims concerning the Polar Regions. In particular this post discusses Arctic and Antarctic temperature trends as well as the state of the Greenland and Antarctic ice sheets.
Unprecedented Arctic Warming?
As I discussed previously, the Arctic has warmed rapidly over the last century but this warming has occurred in two phases with an early century warm period (1910-1950) and a late-century warm period (1975-present). The argument presented by the Prudent Path document is that the current Arctic warming phase is lesser in magnitude than the early century one. The authors of the document rely on peer reviewed papers such as Chylek et al (2004, 2006), Polyakov et al (2003) and Wood et al (2010) to support this argument. Although I have to commend the Prudent Path authors on investigating *some* of the actual peer reviewed literature on the subject, the papers presented either include only a small number of stations, do not cover the entire Arctic-wide basin (excluding the Canadian Arctic, White et al. 2010), or do not include data up to present. In order to assess the actual state of the Arctic, it is necessary to combine all the stations across all parts of the Arctic.
I have previously done this using clear climate code’s variation of NASA's Gistemp temperature reconstruction supplemented by additional data from Environment Canada. The results are shown in Figure 1. 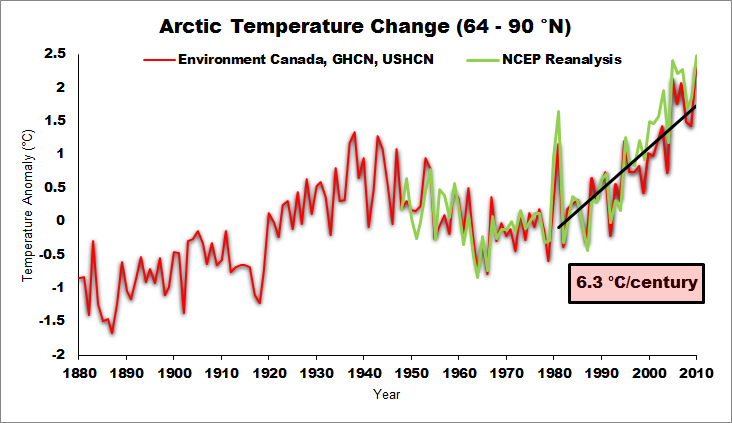
Figure 1:Temperature Anomalies (1951-1981 Baseline) for the Arctic region (64-90°N) over the past 130 years according to ccc-gistemp analysis and NCEP reanalysis.
Based on this Figure, it is widely apparent that the current warm period far exceeds the early century warm period in both rate (slightly) and magnitude. Further supporting this point, only 2 of the warmest 10 years on record occur prior to 2000, with 2010 being by far the warmest on record. For those of you who love quantification, the warmest 10-year period in the early century warming was from 1936 to 1945 and had a magnitude of 0.78 °C above the baseline. The warmest late century 10-year period occurred from 2001 to 2010 with an anomaly of 1.56 °C, 2x greater than the early century warming.
But how does this result compare with the long term context? The co2science authors do in fact touch on this subject through referencing a 1997 paper (Overpeck et al, 1997) which analyzes proxies to determine Arctic temperature changes from 1600 to 1995 AD. However, the Prudent Path authors fail to reference a recent paper (Kaufmann et al. 2009) which analyzed Arctic temperature changes over a 2000 year period (0 to 1999 AD) and concluded that “the most recent 10-year interval (1999-2008) was the warmest of the past 200 decades” and that “4/5 of the warmest decades occurred during the last century". Figure 2 illustrates quite nicely how unprecedented Arctic temperature changes are over the last millennium with the 2000-2009 instrumental average being the last point.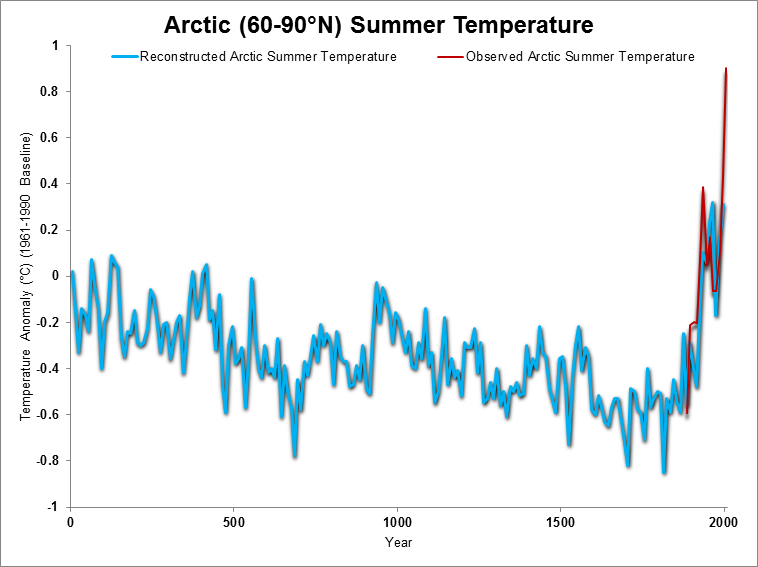
Figure 2: Arctic temperature change reconstructed by Kaufmann et al (2009) including data updated for corrigendum and including instrumental measurements for the Arctic region (60 to 90 N) from NASA.
Antarctic Temperature Changes
“But what about earth’s other polar region: the Antarctic? Here, too, one can conclude nothing about the influence of atmospheric CO2 on surface air temperature. Why? Because for the continent as a whole (excepting the Antarctic Peninsula), there had been a net cooling over the pre-1990 period, stretching back to at least 1966. And when the real-world air temperature declines when the theoretical climate forcing factor is rising, one cannot even conclude that the forcing has any positive effect at all, much less determine its magnitude.”
-Prudent Path-
This paragraph is interesting because it contains a few testable hypotheses. First of all, were temperatures really decreasing between the 1960s and the 1990s? Were the observations over that period of time inconsistent with greenhouse gas forcings? And finally, what is the overall state of the continent? I have prepared a graphic which I think should be able to answer several of these questions (Figure 3).
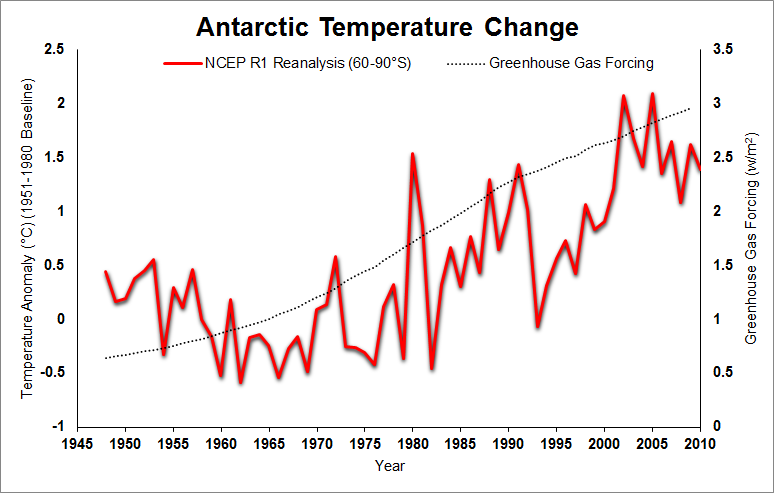
Figure 3: Antarctic temperature change according to NCEP Reanalysis with Greenhouse Gas forcings from NASA's ModelE forcing data (Linearly extrapolated from 2003-2010).
The Verdict?
The answer is quite clear — warming occurred between the 1960s and 1990s, the pattern matches greenhouse gas forcings well, and overall the continent is warming. These results have been further verified by two studies (Steig et al, 2009 and O'Donnell et al, 2010) which both conclude that the Antarctic continent overall has a warming trend.
It is perhaps interesting to note the qualifier that the co2science document used in making their statement, they said "excepting the Antarctic Peninsula". Why would they exclude that region from their analysis? Perhaps O'Donnell et al's (2010) figure can shed some insight. 
Figure 4: Reconstructions of Antarctic temperature change according to Steig et al, 2009 and O'Donnell et al, 2010. The black square denotes the Antarctic Peninsula. Adapted from Supplementary Figures provided by O'Donnell et al (2010).
Polar Ice
The Prudent Path document paints an interesting picture for the state of the ice sheets. In particular the authors give the impression of a significant debate in the literature as to the current state of the Antarctic and Greenland Ice Sheet. So is there actually a significant debate?
The answer is clearly a resounding no. Although there are large uncertainties as to exactly how much ice is being lost from Greenland and Antarctica, there are two things that should become abundantly clear to anyone who reads the literature, they're both losing ice, and these losses are accelerating (Rignot et al, 2011).
Although the Prudent Path authors do review *some* of the literature, here at skeptical science we prefer to include all of the evidence before answering a research question. See Figure 5. 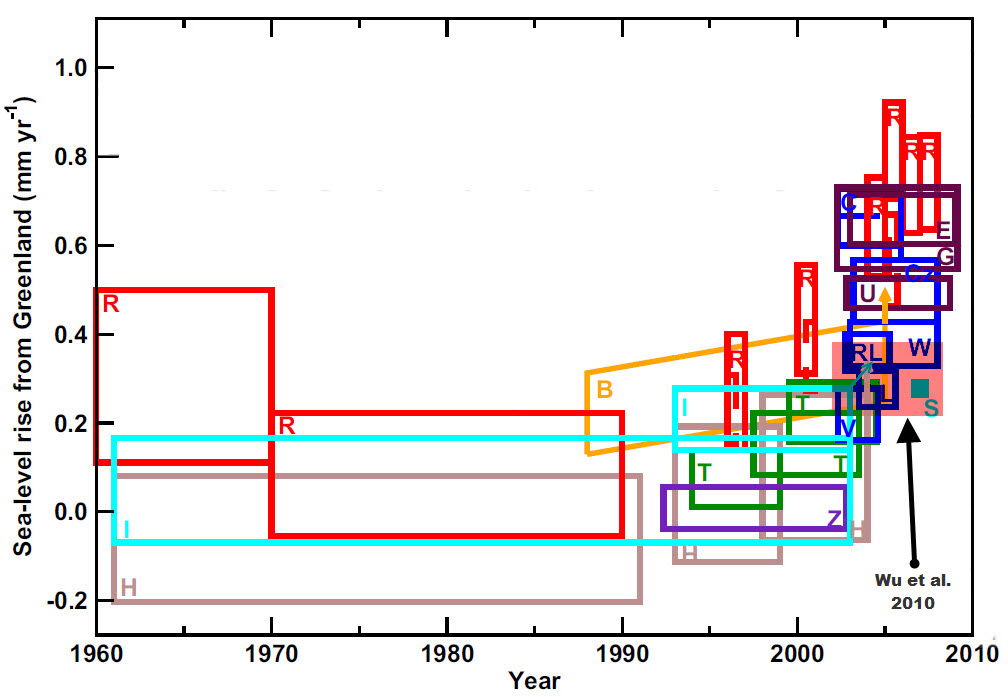
Figure 5: Reconstructions of the Greenland Ice Sheet's contributions to sea level rise. Adapted from Alley (2010).
What this figure does not include is three recent estimates for the polar ice sheets that came out over the last month. They include Rignot et al (2011), Schrama and Wouters (2011), and Zwally et al (2011).
Party like it's 2007
"Even including these likely ice-wastage-inflating properties and phenomena, however, the two researchers (Shepherd and Wingham, 2007) concluded that the current "best estimate" of the contribution of polar ice wastage to global sea level change was a rise of 0.35 millimeters per year, which over a century amounts to only 35 millimeters or a little less than an inch and a half."
-Prudent Path-
Although the fine details of the exact amount of ice loss vary because of different time periods covered and methods use, all recent estimates conclude that the ice sheets are contributing significantly to sea level rise and that their losses are accelerating. The Prudent Path authors quote a paper from 2007 on the subject but considerable advances have occurred since that time and many papers have adjusted that number upwards (see Allison et al, 2009). The most recent of which is Rignot et al (2011) paper which includes many of the top polar researchers on the planet (Rignot, Velicogna, Van Den Broeke, Monaghan, and Lenaerts), and actually quantifies the total contribution and the rate of acceleration for these contributions. Using two independent methods they conclude that in 2006 the polar ice sheets were contributing between 0.9 and 1.7 mm/year to sea level rise and that the acceleration of ice sheet losses over the last 18 years has occurred at a rate of 36.3 Gt/yr.
Less than an Inch?
which over a century amounts to only 35 millimeters or a little less than an inch and a half."According to the analysis presented by Rignot et al (2011), if this rate of acceleration continues (assuming no further acceleration occurs), we will be looking at a contribution of at least 53 cm to sea level rise over the period 2006 to 2100 (Figure 6).
-Prudent Path-

Figure 6: Extrapolated total contribution to sea level rise from the Antarctic and Greenland ice sheets after Rignot et al (2011).
The Actual "Prudent Path"
I hope to have presented an adequately thorough analysis that addresses the main issues brought up by the Prudent Path documents with respect to the polar regions, I would not accuse of deliberate deception on their part but I think this post highlights the dubiousness of not examining the full literature and data available.
In examining the full range of evidence it is clear that the Polar regions are both warming and losing ice extensively. The balance of evidence suggests that over the last 50 years anthropogenic forcing has dominated these processes and that the actual prudent path is to move away from business as usual and to begin to take action to reduce the human influence on climate.


 0
0  0
0 "Heigh-ho, heigh-ho, it's off to melt we go..."
The Yooper
"Heigh-ho, heigh-ho, it's off to melt we go..."
The Yooper


Comments