Climate Science Glossary

Term Lookup

Enter a term in the search box to find its definition.

Settings

Use the controls in the far right panel to increase or decrease the number of terms automatically displayed (or to completely turn that feature off).

Term Lookup

Settings


All IPCC definitions taken from Climate Change 2007: The Physical Science Basis. Working Group I Contribution to the Fourth Assessment Report of the Intergovernmental Panel on Climate Change, Annex I, Glossary, pp. 941-954. Cambridge University Press.

Home Arguments Software Resources Comments The Consensus Project Translations About Support

Twitter Facebook YouTube Mastodon MeWe

RSS Posts RSS Comments Email Subscribe


Climate's changed before
It's the sun
It's not bad
There is no consensus
It's cooling
Models are unreliable
Temp record is unreliable
Animals and plants can adapt
It hasn't warmed since 1998
Antarctica is gaining ice
View All Arguments...


Username
Password
New? Register here
Forgot your password?

Latest Posts

Archives

Lindzen Illusion #2: Lindzen vs. Hansen - the Sleek Veneer of the 1980s

Posted on 29 April 2011 by dana1981

In 1988, Hansen et al. published a global temperature projection which thus far has turned out to be quite accurate, and yet which numerous "skeptics" have widely criticized and misrepresented.  As brought to our attention by Skeptical Science reader Jimbo, noted "skeptic" climate scientist Richard Lindzen gave a talk at MIT in 1989 which we can use to compare to Hansen's projections and see who has been closer to reality over the past two decades.  Although to our knowledge Lindzen has never made any specific global temperature projections, he did make some statements in this talk which we can use to extrapolate what his temperature predictions might have looked like.

For example, Hansen and colleagues at NASA Goddard Institute for Space Studies (GISS) began compiling a global surface temperature record (GISTEMP) in 1981.  As of 1988–1989, their temperature record showed that the average surface temperature had risen approximately 0.5 to 0.7°C since 1880, when the record begins.  Lindzen, however, disputed the accuracy of GISTEMP:

"The trouble is that the earlier data suggest that one is starting at what probably was an anomalous minimum near 1880.  The entire record would more likely be saying that the rise is 0.1 degree plus or minus 0.3 degree....I would say, and I don't think I'm going out on a very big limb,  that the data as we have it does not support a warming.  Whether it contradicts it is a matter of taste"

It turns out that Lindzen's first statement here was incorrect.  According to the slightly longer temperature record of the Hadley Centre, 1880 was closer to a local maximum than a minimum.  But more importantly, he is claiming here that the average global surface temperature trend between 1880 and 1989 is approximately 0.1°C.  Lindzen proceeds to effectively assert that any greenhouse gas warming signal is swamped out by the noise of natural internal variability.

"I personally feel that the likelihood over the next century of greenhouse warming reaching magnitudes comparable to natural variability seems small"

As we recently discussed, natural variability rarely results in more than 0.2 to 0.3°C warming on decadal timescales, so Lindzen is clearly predicting a very small amount of greenhouse warming over the next century.  Using these quotes, I reconstructed what I think are two reasonable approximations of global temperature projections based on Lindzen's belief of the small warming effects of greenhouse gases.  I want to be explicit that these projections are my interpretation of Lindzen's comments, not Lindzen's own projections.

In both reconstructions, I used the 1880 GISTEMP temperature anomaly (-0.3°C) as the baseline and added some random noise with an amplitude consistent with internal variability (approximately 0.4°C).  In the first reconstruction, I then simply added in a linear trend of approximately 0.1°C warming per century. 

In the second Lindzen reconstruction, I first calculated, assuming Lindzen's purported 0.1°C warming between 1880 and 1989 were accurate and was caused by CO2 (since the net non-CO2 forcing has been approximately zero), what the climate sensitivity would be, using the following formula and the CO2 levels in 1989 (353 ppm) and pre-industrial (280 ppm):

For a temperature change of 0.1°C, this results in a climate sensitivity parameter (λ) of 0.08 Kelvin per Watts per square meter, or 0.3°C for a doubling of atmospheric CO2.  For comparison, the IPCC most likely climate sensitivity value is ten times larger, at 3°C for doubled CO2.

I then used this sensitivity in the same formula above with the annual CO2 levels to add the annual CO2 temperature change to the 1880 baseline plus random noise for Lindzen reconstruction #2.

Alongside these reconstructions I also plotted Hansen et al. (1988) Scenarios A, B, and C.  As discussed by NASA GISS's Gavin Schmidt, Scenario B was the closest to the actual radiative forcing changes since 1998, but was approximately 10% too high in this regard.  Thus I also created an "adjusted" Scenario B to reflect what Hansen's data would have looked like had he correctly projected the greenhouse gas increase.

In the first figure below, these projections are compared to the average of GISTEMP's land and land-ocean temperature records, which may be the most relevant for comparison to Hansen et al. 1988.  As in Hansen's original 1988 paper, we begin plotting the data in 1957, and of course as we have previously discussed, GISTEMP is consistent with all the other surface and satellite temperature data sets.

Hansen vs. Lindzen projections all data

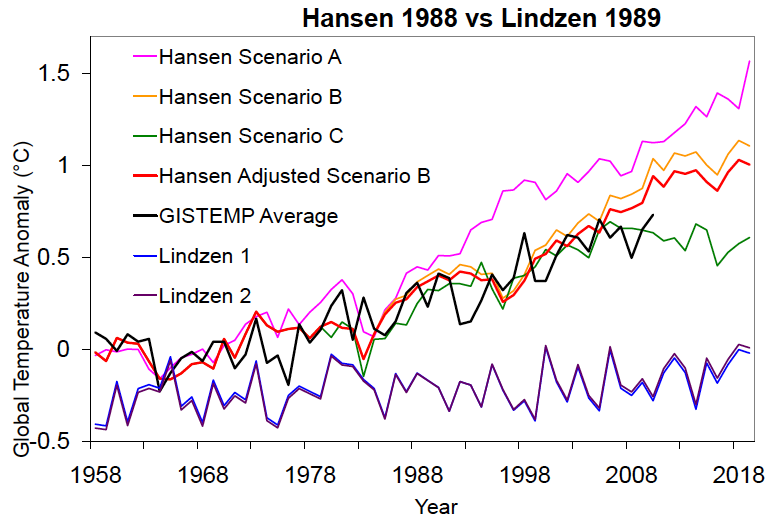
As you can see, Hansen's Scenario B is not far from reality, with a warming trend since 1984 (0.26°C per decade) approximately 30% too high (compared to our average GISTEMP trend of 0.20°C per decade), and the adjusted Scenario B even closer, with a warming trend just 17% higher than observed.

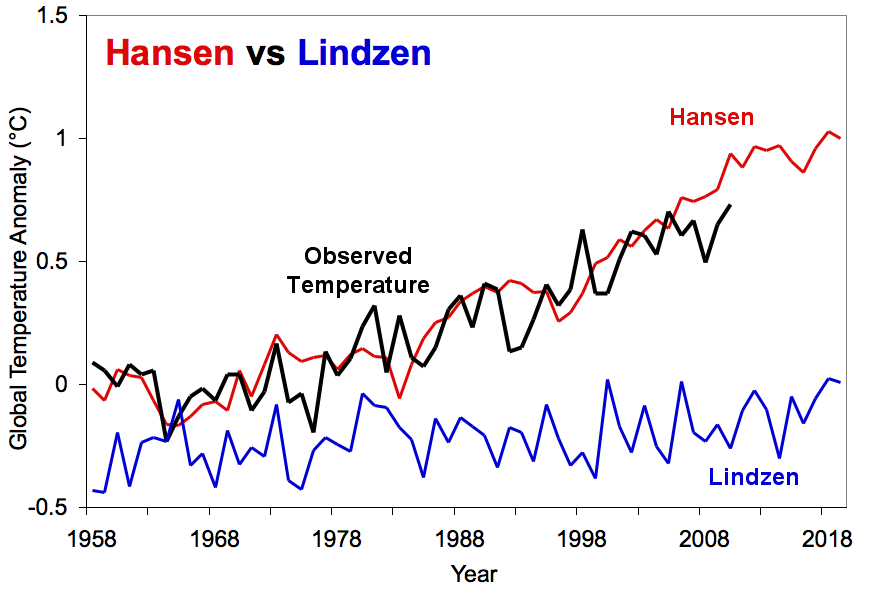
Our reconstructions of Lindzen's projections, on the other hand, increasingly diverge from reality.  His warming trend of approximately 0.01°C to 0.02°C per decade is 90 to 95% too low.  This is further illustrated in the figure below, which isolates the adjusted Scenario B, our second Lindzen reconstruction, and the GISTEMP average (we have also added this figure to the high resolution climate graphics resource page).

Hansen vs. Lindzen projections

Additionally, Dr. Hansen's 1988 climate model was a bit more sensitive to greenhouse gas changes than the models used by climate scientists today, with a sensitivity of 4.2°C for a doubling of CO2.  We can further adjust his Scenario B to reflect the IPCC climate sensitivity of 3°C to determine what today's climate model projections would have looked like in 1988.

Hansen 3°C Sensitivity

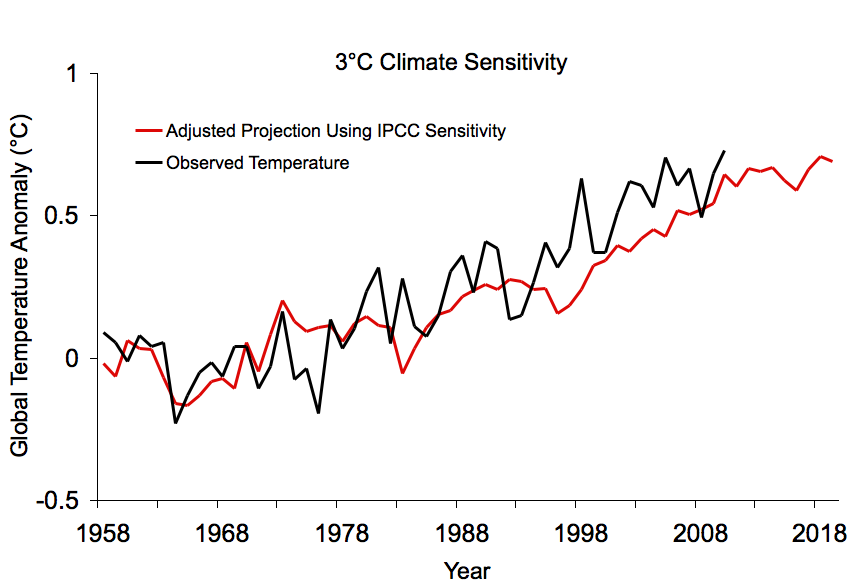
As you can see, the projection matches up very well with the observed temperature increase.  This supports the IPCC most likely climate sensitivity value of 3°C for doubled CO2.

This analysis demonstrates that Hansen has a record of highly accurate climate projections over the past two decades, while Lindzen has a record of inaccuracy.  Indeed, Lindzen continues to argue for low climate sensitivity to this day (not quite as low as 0.3°C, but he continues to argue it's below 1°C for doubled CO2 [i.e. Lindzen and Choi 2009]).

Given all the heat "skeptics" have directed towards Hansen for his projections' slight overestimate of the subsequent warming, one can only wonder what they must think about the massive underestimate of this warming based on Lindzen's 1989 comments.

0 0

Printable Version  |  Link to this page

Comments

1  2  3  Next

Comments 1 to 50 out of 112:

  1. It was a good idea to put this together. Thanks, Dana.
    0 0
  2. Thanks dana! It's clear Lindzen's sensitivity is way too low to explain current warming. Of course, if all goes to form, we will hear the circular argument that, since Lindzen has to be right, the fact that the temps don't agree with his predictions indicates that we must be missing some low frequency intrinsic variablitity, or that there is a conspiracy among those collating the temp data...and on and on... Luckily there are places to go right here to show how little evidence for such factors there are... A question though, isn't the 3C/2xCO2 a measure of the climate sensitivity at equilibrium (minus long term C cycle/ice albedo feedbacks)? Did you downweight the IPCC projections for the transient non-equilibrium sensitivity? If not, that temp increase actually suggests a sensitivity higher than 3C/2xCO2, no?
    0 0
  3. Stephen #2 - yes, 3°C is the equilibrium sensitivity, but remember, we're just showing the model output at any given time. So by scaling down from 4.2 to 3°C, I'm showing what the model output would have looked like had that been its sensitivity. The transient sensitivity is already incorporated into Hansen's model.
    0 0
  4. Yes, of course, I get it. Those are the IPCC predictions based on the model runs...you didn't calculate them based on the sensitivity on your own. Sorry...Need more coffee...
    0 0
    Response:

    [dana1981]Well, they're Hansen et al.'s projections based on their model (this is pre-IPCC), but yes, you got the idea

  5. The article ends with the mildly provocative, "...one can only wonder what they must think about the massive underestimate of this warming based on Lindzen's 1989 comments." Well, I don't wonder, because I am very confident of the answer. The answer is that they and Lindzen are really hoping we just don't notice how massive the underestimate is. Unfortunately, they know that in the diffuse public debate, this massive underestimate will be challenged by far too few.
    0 0
  6. So by scaling down from 4.2 to 3°C, I'm showing what the model output would have looked like had that been its sensitivity.
    Well. Approximately, perhaps. Sensitivity tells you how high you'll end up, but it doesn't fix the shape of the path you take to get there. To scale down, you need to assume that global mean temperatures are at every stage a linear function of sensitivity, which probably isn't true in general. It may be sufficiently close to the truth to get in the ballpark. But Hansen's original projections are already in the ballpark. I'm not convinced there's any real benefit to going further than that. In this instance, it gives a nice result, but it's not clear that the agreement between your adjusted curve and the observed temperatures is actually meaningful.
    0 0
  7. Tsumetai - sure, it's just a very rough adjustment to show that a model with 3°C sensitivity would have fit the data pretty well.
    0 0
  8. dana1981, I am not sure this is an accurate representation of Lindzen's position. It seems to me from the quote that he is arguing that 1880 was an "anomalous minimum" so if it had been closer to the norm the difference between 1880 and 1981 would have been quite small, 0.1C. The Hadley data you link to indicates that he was incorrect about that but I think it a bit unfair to create the graph that shows him to be completely wrong about the average temperature in 1981, a value he surely knew.
    0 0
    Response:

    [dana1981] I disagree.  Lindzen disputed the accuracy of GISTEMP, and was wrong about 1880 being anomalously cold.  The bottom line is that Lindzen claimed the planet only warmed 0.1°C between 1880 and 1989.  That's precisely how I depicted his comments.

  9. I appreciate getting credit for pointing out the 1989 interview with Lindzen, but in the interest of full disclosure I must report that I discovered that interview in Hansen's "Storms of My Grandchildren," Appendix 1, "Key Differences with Contrarians." In it, Hansen points out other errors that Lindzen has made in addition to those dana1981 describes above. If there is one thing that points out the difference between science and anti-science, it is that even though Lindzen has been consistently wrong for at least 20 years, his stature among deniers has risen.
    0 0
  10. dana1981 "The bottom line is that Lindzen claimed the planet only warmed 0.1°C between 1880 and 1989" That is not at all how I read the statements from the article: Nor, he said, was the temperature data collected in a very systematic and uniform way prior to 1880, so comparisons often begin with temperatures around 1880. "The trouble is that the earlier data suggest that one is starting at what probably was an anomalous minimum near 1880. The entire record would more likely be saying that the rise is 0.1 degree plus or minus 0.3 degree." ==== He is (incorrectly) saying that 1880 was abnormally cold and therefor a poor starting point. I don't think he is disputing the temperature in 1981.
    0 0
  11. pbjamm - either Lindzen thought that 1880 was much hotter than it actually was, or that 1989 was much colder than it actually was. Either way he was wrong, and this point doesn't change the slope of his graph, or the fact that it's 90% lower than reality.
    0 0
  12. Pbjamm @10, To this day Lindzen disputes the amount of warming, and makes every effort to downplay the amount of warming and/or caste doubt on the values. For example, when he testified to Congress recently he stated that part of the warming trends because the thermometers are more sensitive to warm perturbations than they are cold ones. The one part I might take issue with in this article is that Lindzen stated a warming of +0.1 with an uncertainty (unsubstantiated) of +/- 0.3 C. Even so, allowing for a warming at the upper end of his range (+0.4 C) by 1988/1989 (not 1981) still does not improve his situation much. The inconsistencies and inadequacy of Lindzen's statements are quite striking. The recent words of wisdom by Dr. Emanuel come to mind (yet again!): "[B]eware those who deride predictive science in its entirety, for they are also making a prediction: that we have nothing to worry about. And above all, do not shoot the messenger, for this is the coward’s way out of openly and honestly confronting the problem."
    0 0
  13. Jimbo @9, "If there is one thing that points out the difference between science and anti-science, it is that even though Lindzen has been consistently wrong for at least 20 years." Good point, yes Lindzen has been peddling the same misinformation for decades, and what is perhaps worse, he has not adjusted his position or acknowledged his errors (to my knowledge) when he has been shown to be wrong. That is the very antithesis of good science.
    0 0
  14. Albatross #12 - according to Lindzen, it was just as likely that the planet had cooled 0.2°C as warmed 0.4°C! #13 - indeed, as another example Lindzen continues to make the demonstrably wrong "Earth hasn't warmed as much as expected" argument, at least since this 1989 talk. He seems to have no qualms continuing to peddle disproven claims for decades on end. Yet he's one of the most highly-revered and referenced scientists by "skeptics"
    0 0
  15. dana81, "it was just as likely that the planet had cooled 0.2°C as warmed 0.4°C!" You are right, of course Dana-- I was trying to give him the best possible benefit of the doubt and in doing so had to force myself to turn a blind eye to that major faux pas by Lindzen. It is truly sad (and scary) that disingenuous people like Lindzen can do no wrong in some peoples' eyes, heck he is even revered by the "skeptics" and those in denial about AGW.
    0 0
  16. We seem to be taking very different things away from his statement that I quoted @10. To me he was saying that 1880 is essentially an unintentional cherrypick. The instrumental record begins then, but it was unusually cold so an unfair starting point. However... He is wrong on that point, "the entire record (Hadley data) indicates that 1880 was pretty average (or a bit above). Perhaps I am being too generous to him since he has a history of 'misstatements' of fact. Even if you were to spot him the 0.2C on the starting point, raising the whole whole graph by that amount, the projection would still be off by a very large margin.
    0 0
  17. It's also worth noting that while Lindzen claimed the temp change was -0.2 to +0.4°C, GISTEMP had measured it at 0.5 to 0.7°C. The measurements weren't even within his range of possibilities!
    0 0
  18. pbjamm - the key aspect Lindzen was wrong about was the temp *change* (a.k.a. global warming). You can shift his graph upwards with a different interpretation of his comments, but it's still equally wrong about what matters. He was wrong about both the temp record accuracy and the warming effects of CO2.
    0 0
  19. This email sent by Lindzen to denier Anthony Watts speaks volumes about how those in denial and 'skeptics' collaborate and scheme to obfuscate and mislead by cherry picking the data for a predetermined outcome. Scientific misconduct much Dr. Lindzen? "Look at the attached. There has been no warming since 1997 and no statistically significant warming since 1995. Why bother with the arguments about an El Nino anomaly in 1998? (Incidentally, the red fuzz represents the error ‘bars’.) Best wishes, Dick ================================================== Richard S. Lindzen Alfred P. Sloan Professor of Atmospheric Sciences MIT Cambridge, MA 02139 USA”
    0 0
  20. Dana, Terrific post. Are there records for Spencer and Christy for a comparable post for them? I think all three of them claimed that the satelite record was better than the surface record. That has been proved incorrect. The skeptics like to say Hansen's predictions are bad becasue they are not exactly correct. By comparing Hansen to the skeptics it becomes clear who has been more accurate over time.
    0 0
  21. Having read the article quoting Lindzen it seems to me that Lindzen is mostly concerned with the measured rise being comparable with the magnitude of natural variability. I think Dana has misinterpreted Lindzen's comments. He was not trying to claim that the temperature rise was 0.1C but rather that the effect excluding natural variation was only 0.1C since noise renders it pretty much impossible to detect a meaningful signal. "As far as the data goes, I would argue that we really don't have the basis for saying it's a half degree plus or minus 0.2. That is false use of science. What we have is data that says that maybe it occurs, but it's within the noise." When we compare 1880 decade with average temperatures of the next 100 years we see that it is below average but not so far below as to make us believe it could not have dropped to this level by natural variability. In other words the 1880's are colder than the norm, ie. in Lindzen's anomalous minimum. Likewise we see that the 1970's are above average but again no more than can be explained by than magnitude of natural variation. In other words he believes that most of the warming is explained by chance switch from an unlikely cold state to an unlikely warm state. It is just unfortunate that the GISS record happens to begin and end on these extremes. Therefore we must attribute most of the surface temperature rise to natural noisy redistribution of heat and only a small amount 0.1C could be due to heat input to the system and even that estimate is very uncertain. He states "Even if the Sun's output were fixed, even if the radiative input were absolutely constant, even if there were no change in the absorbing gases, the ocean itself can take up and store heat and release it..." and later he states "On the planet the most wonderful constituent is water with its remarkable thermodynamic properties. It's the obvious candidate for the thermostat of our system, ...." The real problem for Lindzen in 1989 is natural variability. The oceans an clouds are clearly important but are poorly understood. Greenhouse warming may be occurring but he feels that given the size of observed effects natural variation is the more important given the amount of noise it creates. He believes the noise is clearly drowning the signal of CO2 induced warming and therefore CO2 warming must be small and will remain of little significance. "I argue that the greenhouse effect does not seem to be as significant as suggested." He was wrong. There was a signal and it was indicating a rising CO2 effect. Jim Hansen spotted it despite the noise. "The predicted CO2 warming rises out of the 1sigma noise level in the 1980s and the 2sigma noise level in the 1990s" In 1989 Lindzen had some excuses. There was less data and it was noisy. By 1981 a good deal of the temperature rise was natural or at least not due to CO2 and much was masked by poorly understood aerosols. 23 years later he still appears to be clinging to this position that natural variation in the oceans and/or clouds can explain the warming even though no one has yet made a case that indicates this is possible. And this despite the fact that the signal is well out of the noise of natural variability and consistent with the warming expected due to greenhouse gases. It would appear that no matter how high temperatures rise this is, for him, an indicator that natural variability is ever greater than we had supposed.
    0 0
  22. michael - thanks. Spencer and Christy screwed up the satellite temp data analysis, but acknowledged when it was corrected. It's not really a comparable situation. mdenison - I'm not really sure why you think I misinterpreted Lindzen. Your interpretation seems no different than mine.
    0 0
  23. Mr. Cook, I have just read a critique of this post from Steve Goddard. He says you are wrong about almost everything related to this comparison. http://stevengoddard.wordpress.com/2011/04/29/skeptical-science-cheating-4x/ 1. "he says that ONLY scenario A is reasonable to compare to Hansen's predictions."Hansen made three forecasts, Cook picked scenario “B” which Hansen described as “a reduced linear linear growth of trace gases.” Obviously that has not happened and is not the correct one. He should be comparing against scenario A. Joe Romm says that greenhouse gases have been “accelerating super-exponentially.” 2 "He used Hansen’s temperature data to verify Hansen’s predictions. That is like trusting Al Gore’s lawyers to count ballots in Florida." I assume by this he means that Hansen himself decides what the figures are after manipulating the the numbers from the satellites, and there is no confirmation of the accuracy from other sources. 3. You "offset Lindzen’s start point downwards by half a degree. Obviously the data needs to be normalized before comparing." "4. He drew scenario B below Hansen’s actual scenario B. Note the red line above is too low." "5. He drew Hansen’s measured data too high. The thick red line below and horizontal bars are from the GISS web site. The black line above it is what Cook drew. Hansen reported 0.63 for 2010, Cook placed it above 0.7" "In summary, he used the wrong projection, he let Hansen officiate, he didn’t normalize Lindzen’s data, and he misplaced both the projection and the results on the graph." Mr. Goddard has repeatedly said you are dishonest and that global warming alarmists websites ignore comments from skeptics who try to correct their mistakes. I commented that I would be willing to post his objections since I like to hear both sides of a disagreement. I have pointed out to Mr. Gorddard that he repeatedly misrepresents Hansen's original graph, by ignoring that Hansen acknowledges the 4.2° CO2 doubling to have been wrong, so I am glad to see that he did not question that. Finally a commenter on the site says this is a straw man argument since Lindzen has never made any actual predictions. It seems rather odd to me that that would be used as a defense of Lindzen, since being the most cited ACC skeptic, it would give him much credibility to have done so and therefore have show the greenhouse effect to be as inconsequential as he maintain. Mr. Goddard did not show an adjusted graph where Lindzen's parameters would show a better fit than Hansen's using any standard source of temp data.
    0 0
    Response:

    [dana1981] I wrote the post, not John.  Goddard's comments reveal that he either didn't read or didn't understand the post, as it addresses all his points.  My response is in Comment #28 below.

  24. "Mr. Goddard did not show an adjusted graph where Lindzen's parameters would show a better fit than Hansen's using any standard source of temp data." Well, duh. Goddard is the guy inept enough to maintain that CO2 could deposit as carbonic snow in Antarctica even after being presented with the phase diagram. What do you expect? Stop wasting your time at WUWT if you're really interested in learning stuff. There is such a thing as objective reality in these matters. The comment about alarmist ignoring skeptics trying to correct their mistakes is rather amusing. See this for what is done by Watts when someone tries to correct his. Seriously, there is not one minute spent on WUWT that is not wasted time.
    0 0
  25. Goddard: "ONLY scenario A is reasonable to compare to Hansen's predictions" Reality: The total increase in greenhouse gas forcings projected by Hansen's scenario B was slightly higher than actual readings as shown here. Ergo, scenario A is much higher than what actually happened and scenario C much lower. Leaving scenario B (slightly higher than actual) as the only reasonable comparison. Goddard: "He used Hansen’s temperature data to verify Hansen’s predictions." Reality: Irrelevant. The variation between the various temperature anomaly datasets are negligible. Swap in any of the others, even the outlier UAH results, and it would not change any of the conclusions. Goddard: "He drew scenario B below Hansen’s actual scenario B. Note the red line above is too low." Reality: The red line is not scenario B... the yellow line is. The red was created by adjusting scenario B downwards slightly to reflect the fact that it assumed higher greenhouse gas accumulations than have actually taken place. All of which is clearly explained in the chart legend and article above. I'm still looking at the other comments, but you get the gist. Goddard's objections vary between unfounded and false.
    0 0
  26. Tonydunc @23, I would really not concern myself about what someone so throughly discredited as Goddard thinks. Goddard has a very long reputation for mangling and misrepresenting the science and for being inept in scientific matters. Note too how Goddard chooses to misinform from the safety of his blog rather than come here and try to pass of his misinformation. I could say more, but this is Dana'sa post, so I'll let him reply if he feels so inclined. PS: Philippe, Goddard no longer "works" for Watts, apparently Goddard's standards are event too low for Watts. And let us not forget that Steve Goddard is a pseudonym, yet Watts allowed him to frequently post on his blog even though he allegedly has a rule about not allowing people to post under pseudonyms.
    0 0
  27. tonydunc @23 With regard to point 1. Hansen forecast levels of CO2, Methane, Nitrous Oxides and other trace gases for his three scenarios. Whilst CO2 levels are approximately at Hansen's scenario A, all other trace greenhouse gases are below his scenario C predictions. That means none of the emission scenarios Hansen envisaged actually reflects what has happened. To determine the best emissions scenario you need to consider the nett forcing from all the GHG's he considered. When you do that scenario B emerges as the closest match.
    0 0
  28. tonydunc - this is my post, not John's. Goddard's comments are a bunch of baloney, to put it nicely, but since you asked I will respond specifically.
    "Cook picked scenario “B”...He should be comparing against scenario A"
    Actually the plot in question shows Scenario B adjusted to reflect the actual radiative forcing based on measured GHG changes, as I explained in the post. Scenario A is nowhere near reality, nor is Goddard's comment #1.
    "He used Hansen’s temperature data to verify Hansen’s predictions."
    As I noted in the post (and linked to supporting evidence), GISTEMP ("Hansen's temperature data") is not statistically different from any other temperature data set. I'm already seeing a pattern in these comments, that Goddard needs to work on his reading comprehension.
    "Cook offset Lindzen’s start point downwards by half a degree."
    Again, I explained that my "offset" was based on Lindzen's own comments. This is all discussed in the post.
    "He drew scenario B below Hansen’s actual scenario B"
    Again, as explained in the post, I adjusted Scenario B to reflect actual GHG changes.
    "He drew Hansen’s measured data too high."
    Shockingly, this is also explained in the post. I took the average of the GISS land-only and land-ocean data because it is most comparable to Hansen's 1988 study. In short, Goddard might want to try actually reading the posts he's going to comment on before criticizing them. Every single one of his criticisms was wrong and was explained in the post. This is pretty sad even by Goddard standards.
    "Finally a commenter on the site says this is a straw man argument since Lindzen has never made any actual predictions. It seems rather odd to me that that would be used as a defense of Lindzen"
    Yes, it's a pretty sad defense that Lindzen has never been willing to make a specific prediction of his own. It's easier to criticize than to produce. Nevertheless, Goddard and co. don't seem to dispute the accuracy of my reconstruction.
    0 0
  29. tonydunc @23: 1) "he says that ONLY scenario A is reasonable to compare to Hansen's predictions." In the original paper Hansen says that scenario A is . He also says (page 9361) that in scenario B the rate at which CO2 growth increases will decline so that by 2010 (and after) the increase will be a constant 1.9 ppm per year. The following is the increase in CO2 content in ppm per year as plotted by Tamino: Turns out that in 2010, CO2 growth was under 1.9 ppm, although the trend was probably very close to it. Hansen also said the annual growth of the increase in CO2 concentration in scenario A is 1.5%, or a 1.015^30=~= 1.56 increase in the annual growth rate over the 30 years from 1980 to 2010. With a start value of 1.4 ppm growth in CO2 concentration in 1980, that predicts around 3 ppm growth rate for 2010, or 50% greater than the trend or nearly double the actual value. Clearly scenario B is much closer to what occurred. 2) "He used Hansen’s temperature data to verify Hansen’s predictions. That is like trusting Al Gore’s lawyers to count ballots in Florida." For this argument to make any sense, it would be necessary that using a different temperature series would make the data fit Lindzen's "prediction" better than Hansen's. Well, take your pick: No matter which temperature series you use, the data still supports Hansen's prediction. Indeed, John Cook explicitly pointed that out in the article when he said, "GISTEMP is consistent with all the other surface and satellite temperature data sets." 3) "You "offset Lindzen’s start point downwards by half a degree. Obviously the data needs to be normalized before comparing."" Lindzen's comment quoted in the article indicates that temperatures have increase by from 0.1 to 0.2 degrees from their start point around 1880/89. That makes 1880/89 the start point of his prediction (and retrodiction) and hence the point from which his prediction should be plotted. As the graph only plots from 1958, that creates an apparent offset. At least, that is how I understood the graph. 4) "He drew scenario B below Hansen’s actual scenario B. Note the red line above is too low." 5) He drew Hansen’s measured data too high. The thick red line below and horizontal bars are from the GISS web site. The black line above it is what Cook drew. Hansen reported 0.63 for 2010, Cook placed it above 0.7" I cannot respond to these points as I do not know the details of the plot. However, given the purpose of the graph, ie, to compare Hansen's and Lindzen's "predictions", would it make Lindzen's "prediction" look any better if the graph was adjusted as Goddard suggests? It strikes me that Goddard is quibbling to distract the punters from how wrong Lindzen got it. "Finally a commenter on the site says this is a straw man argument since Lindzen has never made any actual predictions." From the first paragraph of the article, "Although to our knowledge Lindzen has never made any specific global temperature projections, he did make some statements in this talk which we can use to extrapolate what his temperature predictions might have looked like." It would be hard to be more up front than that. The suggestion that Cook's article is a strawman argument is a form of special pleading. It is an insistence that the logical consequences of critics of climate science should not be examined. If you want, however, an example of a real strawman, it is Chilli's claim that, " Cook made the bogus graph by simply removing CO2 from Hansen’s temperature model." Cook, of course, used to methods to arrive at a hypothetical prediction for Lindzen, both of which he clearly described in the article. Apparently Cook's methods were to reasonable for Chilli (afterall, he surely wouldn't be so dishonest as to criticize an article he hasn't actually read?) so he invented a suitably bogus method to attribute to Cook.
    0 0
  30. Hansen set the following interrelated parameters in his 1988 paper. "In scenario B the growth of the annual increment of CO2 is reduced from 1.5%/yr today to 1%/yr in 1990, 0.5%/yr in 2000 and 0 in 2010; thus after 2010 the annual increment in CO2 is constant, 1.9 ppmv/yr. The annual growth of CCI3F and CCI2F2 emissions is reduced from 3%/ yr today to 2%/year in 2000 and 0 in 2010. The methane annual growth rate decreases from 1.5% today to1% in 1990 and 0.5%/yr in 2000. N2O increases are based on the formual of Weiss (1981), but the parameter specifying annual growth in anthropogenic emission decreases from 3.5% today to 2.5% in 1990, 1.5% in 200, and 0.5% in 2010. No increases are included for other chlorofluorocarbons, O3, stratospheric H2O, or any other greenhouse gases." In order to claim that the Hansen Scenario B is the closest to reality is to accept that each of the above has come to pass, otherwise any similarity of the prediction to reality is more due to accident rather than design. Of course there is one more condition that it all relied on, that is the conditions in the oceans, “Our procedure is to use simple assumptions about ocean heat transport. Specifically we assume that during the next few decades the rate and pattern of horizontal ocean heat transport will remain unchanged and the rate of heat uptake by the ocean beneath the mixed layer can be approximated by the diffusive mixing of heat perturbations”
    0 0
  31. "In order to claim that the Hansen Scenario B is the closest to reality is to accept that each of the above has come to pass, otherwise any similarity of the prediction to reality is more due to accident rather than design." No johnd. As has been discussed in other posts, it doesn't matter what leads to the forcing. As long as the forcing in scenario B and the realized forcing are approximately the same, scenario B and reality are comparable.
    0 0
  32. johnd @30, Hansen described three scenarios. In order to claim that scenario B is closer to reality than either of the others we need only show that it is closer to reality than either scenario A or C - which it is. Are you seriously suggesting that because Hansen's scenario B (not prediction, bu scenario) is not a perfect match to reality that denier's continuously insisting that scenario A is a better fit is justified?
    0 0
  33. 30, johnd,
    In order to claim that the Hansen Scenario B is the closest to reality is to accept that each of the above has come to pass, otherwise any similarity of the prediction to reality is more due to accident rather than design.
    You don't seem to understand matters. The scenarios aren't predictions, they're... scenarios. Hansen isn't and was never in the business of predicting economic growth and fossil fuel use, and he couldn't very well make a prediction for every possible variation in CO2 output. So he came up with three broad scenarios modeling future CO2 emissions, each using a set of assumptions. That the assumptions were wrong, but reality's CO2 levels track closer to one scenario than the others, and so makes the predictions which accompany that scenario the best to consider. It's one thing to claim his climate predictions were wrong (which they obviously weren't), but... to claim his economic "predictions" were wrong? Sheesh.
    0 0
  34. As Stephen noted in #31, what matters is the net forcing, not how much came from CO2 or methane or ozone etc. Scenario B was closest to the actual observed net forcing, and I adjusted it to more accurately reflect the actual forcing in "Adjusted Scenario B." To be honest, I don't really know what point johnd is trying to make.
    0 0
  35. Illuminating post Dana but you neglect to mention that Hansen's Scenario C actually gives the best fit to the GISS temperature data, not Scenario B. See the chart below.
    0 0
    Moderator Response: [DB] Umm, no. See here for robust discussion, where you previously advanced this misunderstanding and were provided edification (please put future discussions of this there as well). Repeating a misunderstanding does not unmake it as a misunderstanding.
  36. angusmac @35, Dana clearly shows the correlation between the data the "prediction" for scenario C in figure 1. This correlation, however, is purely a consequence of Hansen using a climate sensitivity of 4.2 degrees C per doubling of CO2. Dana shows the consequences adjusting the prediction for the IPCC accepted climate sensitivity in figure 3, in which the adjusted scenario B prediction underestimates the temperature data. Of course, the scenario C prediction using a climate sensitivity of 3 would perform far worse than does the scenario B prediction.
    0 0
  37. Looking at the decadal averages of the temperature since 1880 and comparing them with Hansen et al. 1981, 1988 (solution B) and the prediction of 2007 looks as follows: Natural variability as defined in Hansen et al. of 1981 (hatched gray areas) looksbad. For more information start at http://www.xs4all.nl/~pduinker/Problemen/Klimaat%20Verandering/Warming/index.html
    0 0
  38. dana1981; Thanks for this excellent analysis. I would love for Lindzen to leave a comment!
    0 0
  39. Dana @22 I think you misinterpret Lindzen because the model you use to produce a Lindzen prediction is based on random noise and a small bias of 0.1C per century to allow for greenhouse gas warming. Lindzen's 1989 comments suggest he believes that there is a heat source (the ocean) that allows for more warming than just 0.1C and that this produces the long term temperature changes observed. You could possibly model this with low frequency noise. Not to model a heat source (or sink) it is to misrepresent Lindzen's position. So far as I can tell in 1989 Lindzen could mainly see noise. He did not have a model that could explain past events nor make predictions; so he made none. The main difference between Lindzen and Hansen is that Hansen had a model with cause and effect that could be tested and make predictions, Lindzen had none.
    0 0
    Response:

    [dana1981] No, I strongly disagree.  Lindzen clearly said the surface warming was only 0.1 +/- 0.3°C.  Noise does not cause long-term trends, and I represented the effects of the oceans in the random noise.

  40. This post clearly illustrates that global surface air temperature (SAT) chronology (as predicted using a climate sensitivity of + 3 K and the observed CO2) forcing is tracking very well with observations. In contrast, we have Lindzen, a complete outlier, with estimates of global surface air temperatures based on his arguments shown to, even now, be in negative territory (and would not even feature in the graph shown @35. I find it incredibly telling that Lindzen and his fellow contrarians have not ventured to produce long-term temperature predictions of global SATs in the reputable peer-reviewed scientific literature, but instead rather choose to adopt the rather cowardly and wholly unproductive tact of nit-picking others hard work and sincere efforts to advance the science. I'm seriously beginning to think that Lindzen is not a self-styled maverick or contrarian or "skeptic", but at this point is in fact in deep denial about what is unfolding before his very eyes. His reticence to concede error, to change his position is the very antithesis of good science, and for this reason the annals of scientific history will not paint a flattering picture of him, despite all his accolades. d82, neat graphs!
    0 0
  41. Mdenison @39, Please read my post @40. There is a very easy way for Lindzen to clarify this and settle this matter-- and that is for him to actually step up to the plate and produce an AOGCM of his own, and generate his own global temperature chronology. He has not and will not. Instead he chooses to play this game of nit picking, being ambiguous, and obfuscating. How people can defend that is completely beyond me. It is very clear, his estimates of a climate sensitivity of <1 K for doubling CO2 is horribly wrong, that much has been obvious for decades now, and is only going to continue to diverge further from reality.
    0 0
  42. The global temperature is already back to what it was over 30 years ago in 1980. Virtually the entire trend was wiped out in one year. This is fundamentally the problem with this. Without the two large El Ninos, there wouldn't even be a much of warming trend at all. Even a 0.3 C warming is ant crumbs - you couldn't even feel that on your skin.
    0 0
    Moderator Response: [DB] Fixed text. BTW, the Lower troposphere isn't necessarily the best temp record (or even UAH among satellite records, either); GISS LOTI probably is best overall. Anyway, UAH LT since 1979: GISS LOTI: Yup, no problem.
  43. UAH trend is 0.14C per decade, and yet someone can claim that the trend has been "wiped out in one year" ! Does that mean that a cold week in mid-Summer means that Summer is then over ? Or is it better to look at long-term trends rather than rely on two cherry-picked data points ? It is easy to see the difference between those who want to know the true picture and those who don't.
    0 0
  44. The point is the amount global average temperature can fluctuate from year to year is greater than the whole of the 30 year trend. This means the trend is well within the range of natural variability and not statistically significant. Furthermore, the 0.3 to 0.4 trend is barely even outside the margin of error. Talk about trying to make Mt. Everest out of a mole hill. No wonder Lindzen has trouble taking any of this kind of stuff seriously.
    0 0
    Moderator Response:

    No, you are incorrect. You need to learn the basics of statistical trend analysis.

    [dana1981] Indeed, it's hard to take you seriously when you can't seem to learn the difference between signal and noise.

  45. RW1@42, There is more than UAH data to look at. See the NOAA webpage of the tropospheric data up to 2010. Taking the decadal averages of these data since 1958 (including the balloon data) and comparing them with the decadal averages of the combined Land-Ocean data and the predictions of the NASA/GISS group of Hansen et al. in 1981, 1988 (solution B) and the 2007 update (red square for the 2010's) gives the following picture:
    The trend is up, and natural variability is out. For more details click here.
    0 0
  46. d82 #45: "trend is up, and natural variability is out." It's also relevant that the temperature anomaly curve is strongly concave up. That behavior is impossible to duplicate with low sensitivity to CO2, as some claim, usually without benefit of any evidence such as these graphs.
    0 0
  47. RW1, Please stop trolling.
    0 0
  48. Ah, I see RW1 uses all the typical Denialist tricks-first by trying to make a trend out of a single month of data (apparently he is unfamiliar with monthly variability), ignores the fact that March still lay within a relatively strong La Nina & also relies on data that specifically excludes the polar regions-those parts of the globe that are warming the fastest. I think this guy has achieved the Denialist Trifecta.
    0 0
  49. Some days in winter are warmer than some days in summer - so why cant I grow tomatos in winter then? Oh and if 0.3C was nothing to get concerned about then I guess 0.4 colder (LIA) is also no problem?
    0 0
  50. "The fact that the developed world went into hysterics over changes in global mean temperature anomaly of a few tenths of a degree will astound future generations. Such hysteria simply represents the scientific illiteracy of much of the public, the susceptibility of the public to the substitution of repetition for truth, and the exploitation of these weaknesses by politicians, environmental promoters, and, after 20 years of media drum beating, many others as well. Climate is always changing." - Richard Lindzen
    0 0
    Moderator Response: [DB] RW, it is simply unacceptable here to post a quotation without providing both context for the quote and a linked source for the quote. That part of Skeptical Science ain't a-changin', despite the clamor of "skeptics".

1  2  3  Next

You need to be logged in to post a comment. Login via the left margin or if you're new, register here.


The Consensus Project Website

THE ESCALATOR

(free to republish)


© Copyright 2024 John Cook
Home | Translations | About Us | Privacy | Contact Us