A Comprehensive Review of the Causes of Global Warming
Posted on 20 January 2012 by dana1981
At Skeptical Science, we have examined several recent studies which have used a number of diverse approaches to tease out the contributions of various natural and human effects to global warming. Here we will review the results of these various studies, and a few others which we have not previously examined, to see what the scientific literature and data have to say about exactly what is causing global warming.
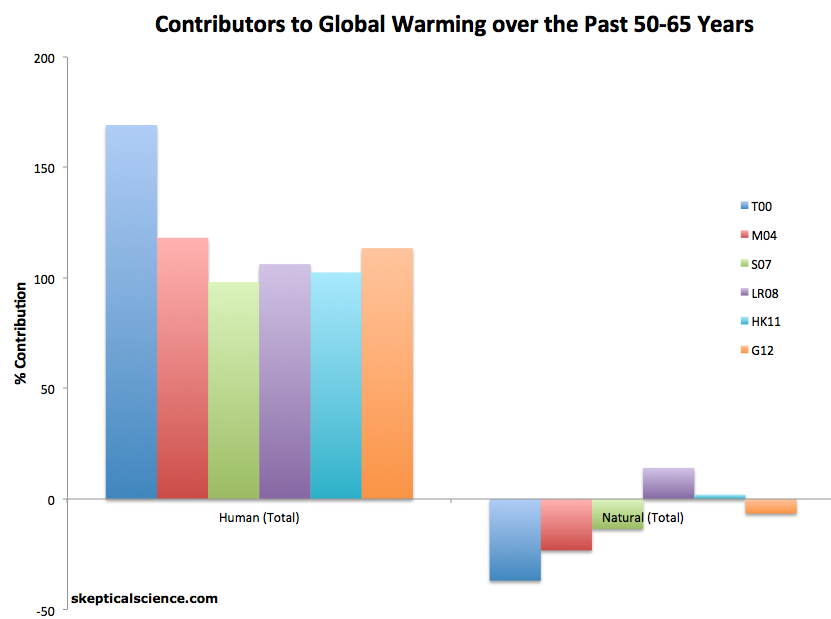
All of these studies, using a wide range of independent methods, provide multiple lines of evidence that humans are the dominant cause of global warming over the past century, and especially over the past 50 to 65 years (Figure 1).
Figure 1: Net human and natural percent contributions to the observed global surface warming over the past 50-65 years according to Tett et al. 2000 (T00, dark blue), Meehl et al. 2004 (M04, red), Stone et al. 2007 (S07, green), Lean and Rind 2008 (LR08, purple), Huber and Knutti 2011 (HK11, light blue), and Gillett et al. 2012 (G12, orange). This has been added to the SkS Climate Graphics Page.
Note that the numbers provided in this summary post are best estimates from each paper. For the sake of simplicity we have not included error bars, but we have provided links to the original research for those who would like to see the uncertainty ranges in each estimate.
A Quick Look at the Various Effects on Global Temperature
Most of the studies discussed below looked at the same few influences on global temperature, because they are the dominant effects.
As we know, human greenhouse gas (GHG) emissions warm the planet by increasing the abundance of greenhouse gases in the atmosphere, thus increasing the greenhouse effect.
Solar activity also warms or cools the planet by increasing or decreasing the amount of radiation reaching the Earth's atmosphere and surface.
Volcanic activity generally cools the planet over short timeframes by releasing sulfate aerosols into the atmosphere, which block sunlight and reduce the amout of solar radiation reaching the surface. However, unlike many greenhouse gases, aerosols are washed out of the atmosphere quickly, mostly after just 1-2 years. Thus the main volcanic impact on long-term temperature changes occur when there is an extended period of particularly high or low volcanic activity.
Human aerosol emissions (primarily sulfur dioxide [SO2]) also tend to cool the planet. The main difference is that unlike volcanoes, humans are constantly pumping large quantities of aerosols in the atmosphere by burning fossil fuels and biomatter. This allows human aerosol emissions to have a long-term impact on temperatures, as long as we keep burning these fuels. However, because aerosols have a number of different effects (including directly by blocking sunlight, and indirectly by seeding clouds, which both block sunlight and increase the greenhouse effect), the magnitude of their cooling effect is one of the biggest remaining uncertainties in climate science.
The El Niño Southern Oscillation (ENSO) is an oceanic cycle which alternates between El Niño and La Niña phases. El Niño tends to shift heat from the oceans to the air, causing surface warming (but ocean cooling), whereas La Niña acts in the opposite manner. As we'll see, a few studies have begun examining whether ENSO has had a long-term impact on global surface temperatures. Because it's a cycle/oscillation, it tends to have little impact on long-term temperature changes, with the effects of La Niña cancelling out those of El Niño.
There are other effects, but GHGs and SO2 are the two largest human influences, and solar and volcanic activity and ENSO are the dominant natural influences on global temperature. Now let's see what the scientific literature has to say about the relative influences of each effect.
Tett et al. (2000)
Tett et al. (2000) used an "optimal detection methodology" with global climate model simulations to try and match the observational data. The inputs into the model included measurements of GHGs in the atmosphere, aerosols from volcanic eruptions, solar irradiance, human aerosol emissions, and atmospheric ozone changes (ozone is another greenhouse gas).
Tett et al. applied their model to global surface temperatures from 1897 to 1997. Their best estimate matched the overall global warming during this period very well; however, it underestimated the warming from 1897 to 1947, and overestimated the warming from 1947 to 1997. For this reason, during the most recent 50 year period in their study (shown in dark blue in Figure 1), the sum of their natural and human global warming contributions is larger than 100%, since their model shows more warming than observed over that period. Over both the 50 and 100 year timeframes, Tett et al. estimated that natural factors have had a slight net cooling effect, and thus human factors have caused more than 100% of the observed global warming.
Meehl et al. (2004)
Meehl et al. 2004 used a similar approach to Tett et al., running global climate model simulations using various combinations of the different main factors which influence global temperatures (GHGs, solar activity, volcanic aerosols, human aerosols, and ozone), and comparing the results to the temperature data from 1890 to 2000. They found that natural factors could account for most of the warming from 1910 to 1940, but simply could not account for the global warming we've experienced since the mid-20th Century.
Meehl et al. estimated that approximately 80% of the global warming from 1890 to 2000 was due to human effects. Over the most recent 50 years in their study (1950-2000), natural effects combined for a net cooling, and thus like Tett et al., Meehl et al. concluded that human caused more than 100% of the global warming over that period. Over the past 25 years, nearly 100% of the warming is due to humans, in their estimate.
Stone et al. (2007)
Stone et al. actually published two studies in 2007. The first paper examined a set of 62 climate model simulation runs for the time period of 1940 to 2080 (the Dutch Meteorological Institute's "Challenge Project"). These simulations utilized measurements of GHGs, volcanic aerosols, human aerosols, and solar activity from 1940 to 2005, similar to the Tett and Meehl studies discussed above, and then used projected future emissions from the Intergovernmental Panel on Climate Change (IPCC) to project future global warming. Whereas Tett and Meehl examined the climate response to each individual factor (and/or combinaton of factors), Stone compared these 62 climate model runs to a series of energy balance models, each representing the climate's response to a different effect. Over the 60 year period, Stone et al. estimated that humans caused close to 100% of the observed warming, and the natural factors had a net negative effect. As with Stott, their model did not fit the data perfectly, though they had the opposite result, underestimating the observed warming.
In their second 2007 paper, Stone et al. updated the results from their first paper by including more climate models and more up-to-date data, and examining the timeframe of 1901 to 2005. Over that full 104-year period, Stone et al. estimated that humans and natural effects had each contributed to approximately half of the observed warming. Greenhouse gases contributed to 100% of the observed warming, but half of that effect was offset by the cooling effect of human aerosol emissions. They estimated that solar and volcanic activity were responsible for 37% and 13% of the warming, respectively.
Lean and Rind (2008)
Lean and Rind 2008 used more of a statistical approach than these previous studies, using a multiple linear regression analysis. In this approach, Lean and Rind used measurements of solar, volcanic, and human influences, as well as ENSO, and statistically matched them to the observational temperature data to achieve the best fit. Analyzing what is left over after summing the various contributions shows whether the most significant contributions are being considered.
LR08 did this over various timeframes, and found that from 1889 to 2006, humans caused nearly 80% of the observed warming, versus approximately 12% from natural effects. As with the previous studies discussed, this doesn't add up to exactly 100% because the statistical fit is not perfect, and not every effect on global temperature was taken into consideration. From both 1955 and 1979 to 2005, they estimated that humans have caused close to 100% of the observed warming.
Stott et al. (2010)
Stott et al. (S10) used a somewhat similar approach to LR08, but they used their statistical multiple linear regression results to constrain simulations from five different climate models. S10 calculated regression coefficients for greenhouse gases, other human effects (dominated by aerosols), and natural effects (solar and volcanic), and estimated how much warming each caused over the 20th Century. The average of the five models put the human contribution at 86% of the observed warming, and greenhouse gases at 138%, with a very small natural contribution.
Stott et al. also corrobarated their results by looking not only at global, but also regional climate changes by reviewing the body of scientific literature. They note that human influences have been detected in changes in local temperatures, precipitation changes, atmospheric humidity, drought, Arctic ice decline, extreme heat events, ocean heat and salinity changes, and a number of other regional climate impacts.
Huber and Knutti (2011)
Huber and Knutti 2011 implemented a very interesting approach in their study, utilizing the principle of conservation of energy for the global energy budget to quantify the various contributions to the observed global warming from 1850 and 1950 to the 2000s. Huber and Knutti took the estimated global heat content increase since 1850, calculated how much of the increase is due to various estimated radiative forcings, and partition the increase between increasing ocean heat content and outgoing longwave radiation. More than 85% of the global heat uptake has gone into the oceans, so by including this data, their study is particularly robust.
Huber and Knutti estimate that since 1850 and 1950, approximately 75% and 100% of the observed global warming is due to human influences, respectively.
Foster and Rahmstorf (2011)
Foster and Rahmstorf (2011; FR11) implemented a very similar statistical approach to that in Lean and Rind (2008). The main difference is that FR11 examined five different temperature data sets, including satellites, and only looked at the data from 1979 to 2010 (the satellite temperature record begins in 1979). They also limited their analysis to the three main natural influences on global temperatures - solar and volcanic activity, and ENSO. What remains once those three effects are filtered out is predominantly, but not entirely due to human effects. For our purposes, we will classify this remainder as the human contribution, since FR11 removed the three largest natural effects.
Using the temperature data from the British Hadley Centre (which was used by LR08, and is the most frequently-used temperature data set in these studies), FR11 found that the three natural effects in their analysis exerted a small net cooling effect from 1979 to 2010, and therefore the leftover influence, which is predominantly due to human effects, is responsible for more than 100% of the oberved global warming over that timeframe.
One key aspect of this type of study is that it makes no assumptions about various possible solar effects on global temperatures. Any solar effect (either direct or indirect) which is correlated to solar activity (i.e. solar irradiance, solar magnetic field [and thus galactic cosmic rays], ultraviolet [UV] radiation, etc.) is accounted for in the linear regression. Both Lean and Rind and Foster and Rahmstorf found that solar activity has played a very small role in the observed global warming.
Gillett et al. (2012)
Similar to S10, Gillett et al. applied a statistical multiple linear regression approach to a climate model - the second generation Canadian Earth System Model (CanESM2). They used data for human greenhouse gas and aerosol emissions, land use changes, solar activity, ozone, and volcanic aerosol emissions. In their attribution they grouped some of the effects together into 'natural', 'greenhouse gas', and 'other'. The authors estimated the effects of each over three timeframes: 1851-2010, 1951-2000, and 1961-2010. For their attributions over the most recent 50 years, we took the average of the latter two, and used their 'other' category as an estimate for the influence of human aerosol emissions (which will result in somewhat of an underestimate, since most 'other' effects are in the warming direction).
Gillett et al. estimated that over both timeframes, humans are responsible for greater than 100% of the observed warming.
Human-Caused Global Warming Consensus
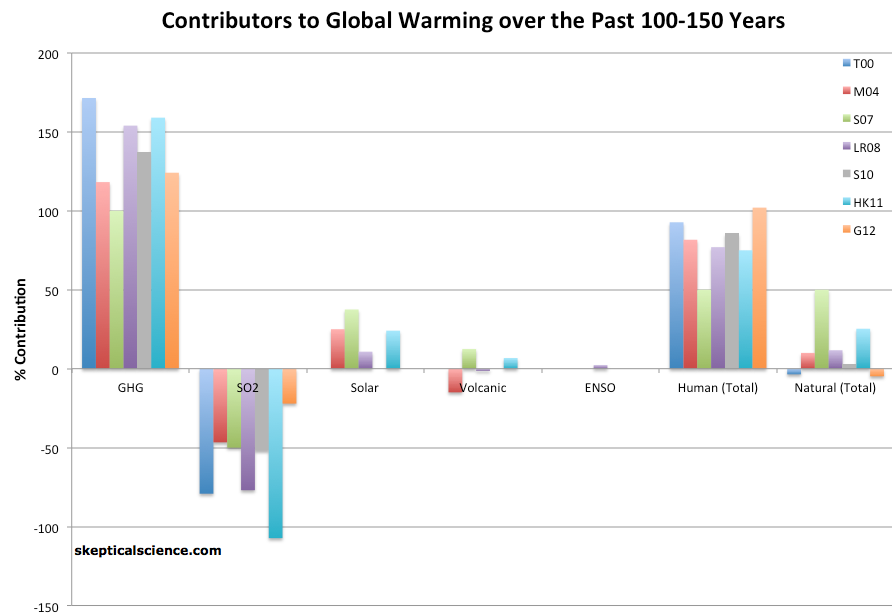
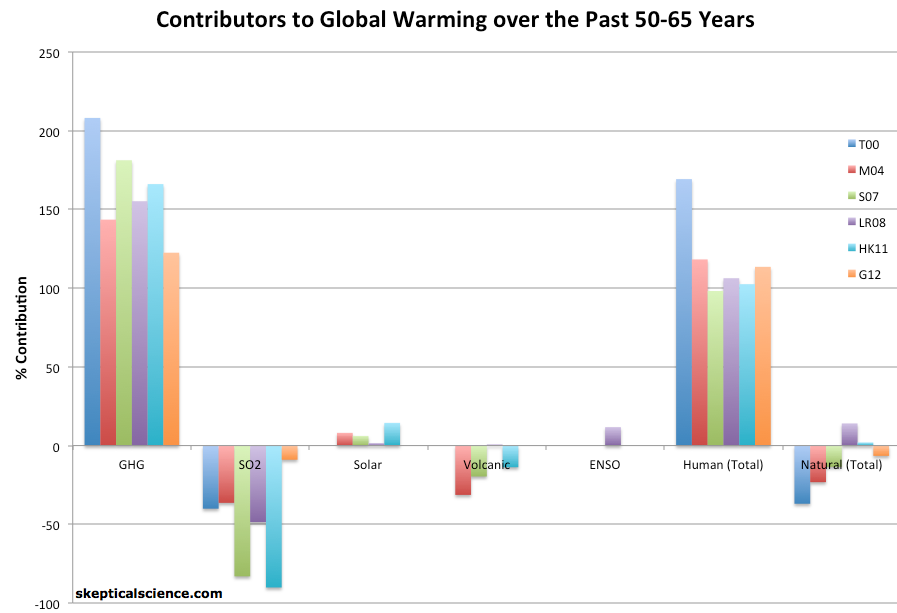
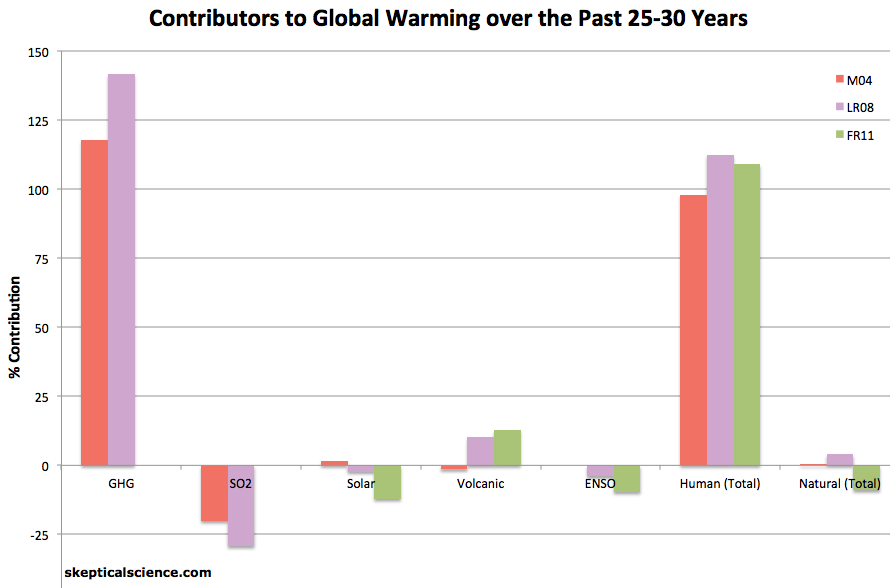
The agreement between these studies using a variety of different methods and approaches is quite remarkable. Every study concluded that over the most recent 100-150 year period examined, humans are responsible for at least 50% of the observed warming, and most estimates put the human contribution between 75 and 90% over that period (Figure 2). Over the most recent 25-65 years, every study put the human contribution at a minimum of 98%, and most put it at well above 100%, because natural factors have probably had a small net cooling effect over recent decades (Figures 3 and 4).
Additionally, in every study over every timeframe examined, the two largest factors influencing global temperatures were human-caused: (1) GHGs, followed by (2) human aerosol emissions. This is a dangerous situation because as we clean our air and reduce our SO2 emissions, their cooling effect will dissipate, revealing more of the underlying GHG-caused global warming trend. Note that not all studies broke out the effects the same way (i.e. only examining 'natural' and not solar or volcanic effects individually), which is the reason some bars appear to be missing from Figures 2 to 4.
Figure 2: Percent contributions of various effects to the observed global surface warming over the past 100-150 years according to Tett et al. 2000 (T00, dark blue), Meehl et al. 2004 (M04, red), Stone et al. 2007 (S07, green), Lean and Rind 2008 (LR08, purple), Stott et al. 2010 (S10, gray), Huber and Knutti 2011 (HR11, light blue), and Gillett et al. 2012 (G12, orange).
Figure 3: Percent contributions of various effects to the observed global surface warming over the past 50-65 years according to Tett et al. 2000 (T00, dark blue), Meehl et al. 2004 (M04, red), Stone et al. 2007 (S07, green), Lean and Rind 2008 (LR08, purple), Huber and Knutti 2011 (HK11, light blue), and Gillett et al. 2012 (G12, orange).
Figure 4: Percent contributions of various effects to the observed global surface warming over the past 25-30 years according to Meehl et al. 2004 (M04, red), Lean and Rind 2008 (LR08, purple), and Foster and Rahmstorf 2011 (FR11, green).
There was a period of warming between 1910 and 1940 which was predominantly caused by increasing solar activity and an extended period of low volcanic activity, with some contribution by human effects. However, since mid-century, solar activity has been flat, there has been moderate volcanic activity, and ENSO has had little net impact on global temperatures. All the while GHGs kept increasing, and became the dominant effect on global temperature changes, as Figures 3 and 4 illustrate.
A wide variety of statistical and physical approaches all arrived at the same conclusion: that humans are the dominant cause of the global warming over the past century, and particularly over the past 50 years. This robust scientitic evidence is why there is a consensus amongst scientific experts that humans are the dominant cause of global warming.
Note: this post has been incorporated into the rebuttals to It's not us (Advanced), Increasing CO2 has little to no effect (Advanced), It's the sun (Intermediate and Advanced), and A drop in volcanic activity caused warming.


 Arguments


[DB] Models are not the topic of this thread, For a further discussion of those, see either the How do Climate Models Work? thread or the Models are unreliable thread. Please continue any discussion of models there, not here.
Furthermore, this thread is A Comprehensive Review of the Causes of Global Warming. Discussion of the philosophy of science on this thread have now run their course. As no meaningful fruit has arisen, it is now off-topic on this thread and subsequent pursuit of this topic will receive further, more severe moderation.
[DB] Unfortunately, there are no posts at Skeptical Science directly focus on the philosophy of science. You are welcome to peruse any/all of the 4,700+ comment threads here at SkS dealing with all aspects of climate science and may place on-topic comments on any of them.
Simply use the Search function in the Upper Left of every page to locate those more appropriate threads.
User LRDT has asked about the human attribution of the causes of global warming and climate change. Given this:
And this:
Yields this, from the OP above:
It is also worth noting that in political debates, finding a middle ground is often in the way forward. However, science doesnt go for middle ground much. You cant try and postulate that there are fictional sources of warming for which there is no evidence. If you want to excuse humans then you need to provide evidence for other causes that dont violate first law thermodynamics. For example, you cant say the warming is coming from the oceans on some "natural cycle" while the oceans continue to heat. You can explain short term heating (eg El Nino) from ocean/atmosphere exchange (ocean heat content drops) but not long term.