Climate Science Glossary

Term Lookup

Enter a term in the search box to find its definition.

Settings

Use the controls in the far right panel to increase or decrease the number of terms automatically displayed (or to completely turn that feature off).

Term Lookup

Settings


All IPCC definitions taken from Climate Change 2007: The Physical Science Basis. Working Group I Contribution to the Fourth Assessment Report of the Intergovernmental Panel on Climate Change, Annex I, Glossary, pp. 941-954. Cambridge University Press.

Home Arguments Software Resources Comments The Consensus Project Translations About Support

Bluesky Facebook LinkedIn Mastodon MeWe

Twitter YouTube RSS Posts RSS Comments Email Subscribe


Climate's changed before
It's the sun
It's not bad
There is no consensus
It's cooling
Models are unreliable
Temp record is unreliable
Animals and plants can adapt
It hasn't warmed since 1998
Antarctica is gaining ice
View All Arguments...


Username
Password
New? Register here
Forgot your password?

Latest Posts

Archives

Patrick Michaels: Serial Deleter of Inconvenient Data

Posted on 17 January 2012 by dana1981

Patrick Michaels is a research fellow at the Cato Institute think tank, the chief editor of the website World Climate Report, has been given a climate blog at the business magazine Forbes, and his articles are frequently re-posted at climate "skeptic" blogs like Watts Up With That (WUWT).  Despite his clear conflict of interest (Michaels has estimated that 40% of his work is funded by the petroleum industry), many people continue to rely on him as a reliable source of climate information.  This is an unwise choice, because Michaels also has a long history of badly distorting climate scientists' work.  In fact, not only does Michaels misrepresent climate research on a regular basis, but on several occasions he has gone as far as to manipulate other scientists' figures by deleting parts he doesn't like.

Patrick Michaels is a serial deleter of inconvenient data.

Hansen 1988

Skeptical Science has previously documented the most high-profile example of Michaels' serial data deletions, which involved James Hansen's 1988 study projecting future global warming.  James Hansen is a scientist at the NASA Goddard Institute for Space Studies (GISS), and one of the world's foremost climate scientists.

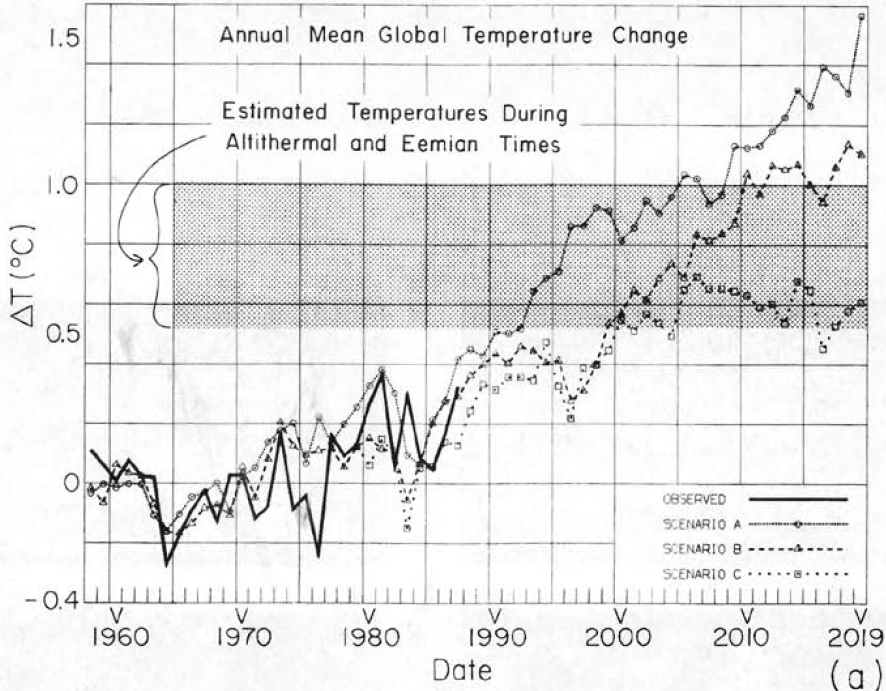
Climate scientists aren't in the business of predicting how human greenhouse gas emissions will change in the future - that is a policy question.  Instead, climate scientists predict how the climate will change in response to a series of possible emissions scenarios (for example, continuing with business-as-usual emissions, dramatically cutting our emissions starting in the year 2020, etc.).  In 1988, Hansen used the NASA GISS climate model to predict how the planet would respond to three possible scenarios.  Scenario A assumed continued exponential (accelerating) greenhouse gas growth.  Scenario B assumed a reduced linear rate of growth, and Scenario C assumed a rapid decline in greenhouse gas emissions around the year 2000.  Hansen believed Scenario B was the most likely to come to fruition, and indeed it has been the closest to reality thus far.  In the summer of 1988, Hansen presented his results in testimony before U.S. Congress.

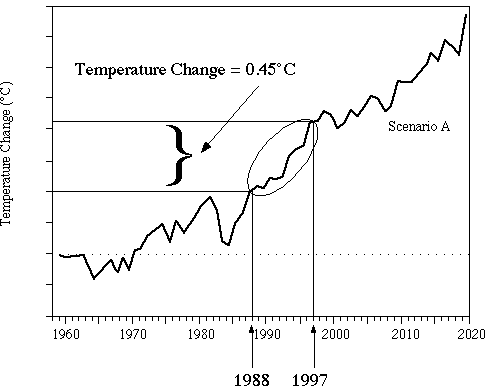
Ten years later, with the Kyoto Protocol international agreement to reduce greenhouse gas emissions in the works, Patrick Michaels was invited to testify before Congress about the state of climate science.  He spoke of Hansen's 1988 study, and in the process, grossly misrepresented its projections and accuracy by deleting Scenarios B and C, wrongly asserting that the planet had warmed "more than four times less than Hansen predicted." 

Original Version

Hansen 88 Figure

Michaels Version

Michaels Hansen Deletion

James Hansen had this to say about Patrick Michaels' distortion of his work:

"Pat Michaels, has taken the graph from our 1988 paper with simulated global temperatures for scenarios A, B and C, erased the results for scenarios B and C, and shown only the curve for scenario A in public presentations, pretending that it was my prediction for climate change. Is this treading close to scientific fraud?"

Michaels certainly didn't mess around with his first known case of data deletion, using it to mislead our policymakers as they decided whether or not to commit to reducing American greenhouse gas emissions (they ultimately refused to ratify the Kyoto Protocol).  Michaels' other data deletions, while being almost as misleading, were not made on nearly as grand of a stage.

Schmittner 2011

Another example of Michaels' serial data deletion involved a paper by Schmittner et al. last year which attempted to estimate the climate sensitivity - how much the planet will warm in response to a continued rise of greenhouse gases.  Schmittner et al. used geologic data to calculate the climate sensitivity based on the transition between the Last Glacial Maximum (LGM) and the current relatively warm interglacial period (approximately 20,000 years ago), and came up with an estimate towards the lower end, but within the likely range listed by the Intergovernmental Panel on Climate Change (IPCC).

However, there are two strong caveats associated with their results.  First, based on their interpretation of the geologic data, they estimated a smaller temperature change from the LGM transition than most previous studies, which was the main reason that their climate sensitivity estimate was relatively low.  Had they used a more widely-accepted global temperature change for the period in question, their climate sensitivity estimate would likely have been very close to the most likely estimate from the IPCC.

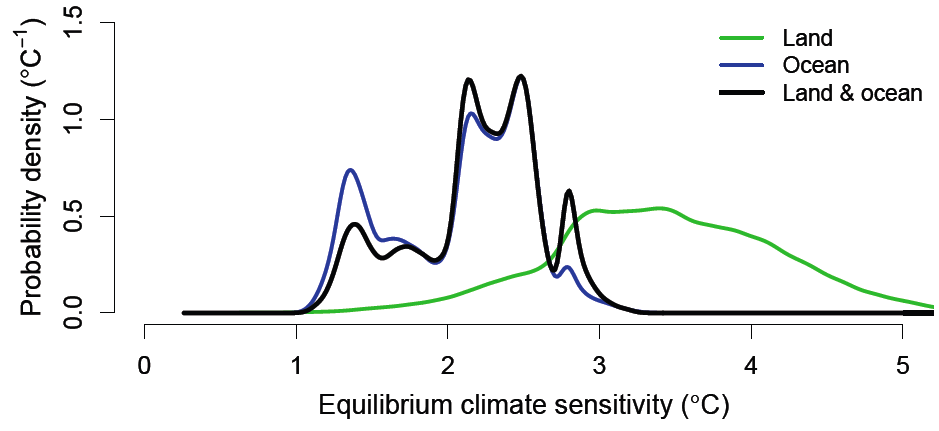
Second, and more relevant here, Schmittner et al. arrived at two fairly different results when they used ocean temperature data as opposed to land temperature data.  Their climate sensitivity estimate based on land-only data was significantly higher than with ocean-only data.  When they combined the two, the result was close to the ocean-only estimate, because the majority of their data came from ocean measurements.

This is an important caveat because climate sensitivity applies to the planet as a whole.  If different results are obtained from ocean and land data, then we can't be sure which is correct, and in fact many climate scientists are skeptical of the small LGM temperature change estimate, which is based heavily on the ocean temperature data.  Thus Schmittner et al. felt it important to include both estimates in the figures in their study.

However, it is very important for climate "skeptics" like Patrick Michaels that climate sensitivity be low.  This would mean that the planet will not warm as much in response to rising greenhouse gases, and we don't have to worry about reducing our emissions as quickly.  Thus as he did with Hansen's figure, Michaels deleted the inconvenient data from the figure in Schmittner et al., leaving only the combined estimate, which as noted above, is heavily weighted by the lower, ocean-based climate sensitivity estimate. 

Original Version

schmittner sensitivity

Michaels Version

Michaels Schmittner Deletion

On Planet 3.0, thingsbreak had an excellent interview with Nathan Urban, co-author of Schmittner et al., in which Michaels' distortion of his results was discussed:

"World Climate Report doctored our paper’s main figure when reporting on our study.  This manipulated version of our figure was copied widely on other blogs....I find this data manipulation problematic.  When I created the real version of that figure, it occurred to me that it would be reproduced in articles, presentations, or blog posts.  Because I find the difference between our land and ocean estimates to be such an important caveat to our work, I made sure to include all three curves in the figure, so that anyone reproducing it would have to acknowledge these caveats....I find the result of their figure manipulation to be very misleading...They intentionally took our figure out of the context in which it was originally presented, a form of “selective quotation” which hides data that does not support their interpretation...I find World Climate Report’s behavior very disappointing and hardly compatible with true skeptical inquiry"

Gillett 2012

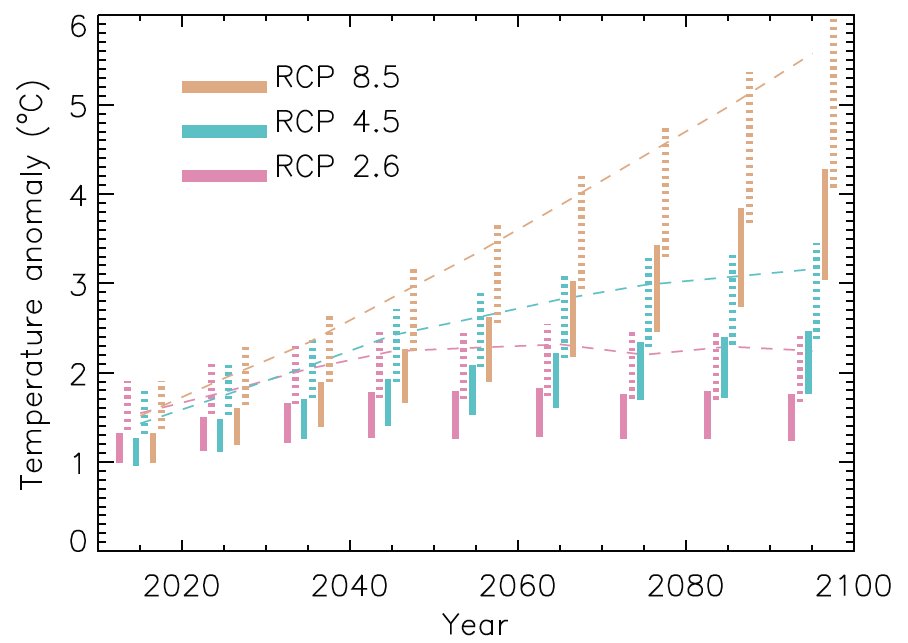
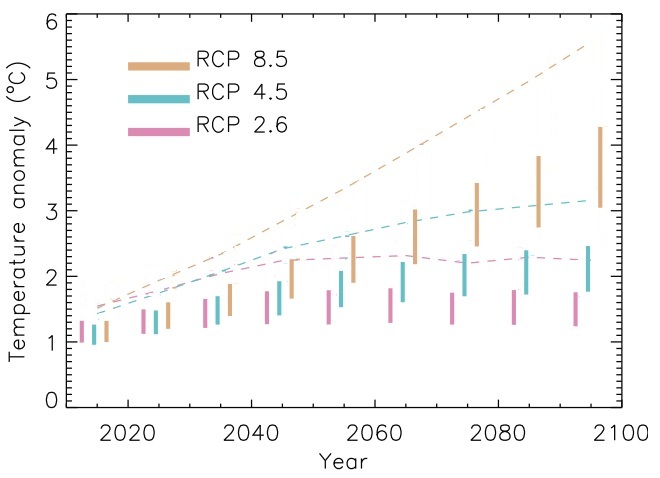
The latest example of Michaels' serial data deletion involves a recent paper by Gillett et al. which like Hansen (1988), projects future global warming in several different emissions scenarios.  However, Gillett et al. made three different projections for each scenario.  For the first projection, they simply ran their climate model to see how much global warming it would predict in each scenario.  For the other two projections, they scaled their climate model run based on observational temperature changes that they estimated from greenhouse gases and other influences over two timeframes, 1851-2010, and 1901-2000.

In their figure showing the results of these projections, they illustrated the results using the two different timeframes, because the results in each were markedly different.  When Gillett et al. constrained their model using the timeframe from 1851 to 2010, the model projected less warming than when they used the timeframe from 1901 to 2000.  

This is a very similar situation to Schmittner et al., in that using two different sets of data produced two fairly different sets of results.  Thus like Schmittner et al.,  Gillett et al. made a point to note the fact that their results were very sensitive to the timeframe they used, and included both results in their figures

But once again, the data projecting larger future global warming was inconvenient for Patrick Michaels' narrative, so he simply deleted it

Original Version

Gillette Projections

Michaels Version

Michaels Gillett Deletion

In these figures, the dashed lines in the horizontal direction are the projections from the unconstrained climate model for the three emissions scenarios (the RCPs).  The solid vertical lines are the model projections using the 1851-2010 data, and the dotted vertical lines (deleted by Michaels) are the model projections using the 1901-2000 data.

Deleters and Enablers

In every case discussed above, Michaels has deleted the data which contradict his constant arguments that the planet will warm less than most climate scientists expect, and thus that global warming is nothing to worry about.  Given his history as a serial data deleter, rather than being given so many platforms from which to spread his misinformation, Patrick Michaels (and certainly the World Climate Report website) should be considered an unreliable source of information.

This is a problematic situation.  There are a large number of people who simply don't want to accept the scientific reality that humans are causing rapid global warming.  However, this reality is accepted by the vast majority of scientific experts, because it is supported by the preponderance of scientific data.  Denial enablers like Anthony Watts, Forbes, and other media outlets have found a way around the first problem by giving fake skeptics like Patrick Michaels a platform to speak to those who are in denial about the science.  Patrick Michaels has found a way around the second problem by simply deleting the data which is inconvenient for his narrative, only presenting his audience with the bits of evidence which seem to support their denial, as long as the inconvenient data are ignored.

0 0

Printable Version  |  Link to this page

Comments

Prev  1  2  3  4  

Comments 151 to 176 out of 176:

  1. Ok Tom, the ball is in my court.
    0 0
  2. Dana at #119. I could say so much about Watts' apparent meaning in the first paragraph of that censored post, but I'd probably run afowl of the polite-posting rules here. Suffice to say that the difference between "inciteful" and "insightful" is noticable in the context of what Watts' thinks he is saying... It goes to prove that WWWT is good for one thing at least - providing a laugh!
    0 0
  3. 144, Eric (skeptic),
    BTW, your reply to me has appeared at WUWT.
    Oh, no. Censorship at WUWT? Erasing something just because it's inconvenient? Who'd have thunk it.
    0 0
  4. Eric (skeptic), as you are persisting in your line of questioning on WUWT, I have produced the following edited version of Knutti and Hegerl's figure 3b for illustrative purposes only: Now, I put it to you that if you where reading Knutti and Hegerl, and having come across their actual figure 3a as figure 2, and then came across a figure 3 as represented above, you would not think the figure was senseless. You would not find it was impossible to understand. It would be a perfectly sensible figure to you. It follows from that that, logically, figure 3b is an independent figure from 3a in Knutti and Hegerl. It is, of course, not independent of the entire discussion in Knutti and Hegerl, or independent of discussion of climate sensitivity. Despite that, I can certainly imagine contexts in which that figure could be found without the equivalent of figure 3a and nobody would bat an eyelid. Please note that the 1901-2000 data in the Gillett figure is also logically independent of the 1851-2010 data. It could have been produced as an independent figure and, again, nobody would bat an eyelid. However, it was not produced as an independent figure. Presumably it was not because the authors (or reviewers) thought the disparity of results raised significant questions about the robustness of the main result, and did not want that issue to escape notice. In contrast to the authors (or reviewers), Michaels and Knappenberg did want the issue of robustness to escape notice, even though it was clearly pertinent to Michaels' discussion. It follows that there is a clear ethical difference between the two cases. But had Gillett produced the 1901 to 2000 data on one figure, and the 1851 to 2010 data on another seperate figure (even if part of the same cluster), and if Michael's had then reproduced the figure for the 1851-2010 data, then Dana's inclusion of the Gillett case in the above post would have been absurd. What is more, while Michaels' article may have been subject to criticism on basis of intellectual merit because it did not discuss relevant issues, issues of misepresentation of sources would not have arisen. Conversely, had Knutti and Hegerl included figure 3a and 3b as part of one single figure 3 without distinct discussion, separating them would have been problematic. Finally, I dislike your raising questions to me on WUWT. I rarely visit that site, and even more rarely comment because a large part of the commenting participants have a demonstrated inability to follow logical argument, and a clear unwillingness of follow basic rules of reasoning. Discussion with them is literally pointless. The Biblical injunction to not cast pearls before swine is very relevant. There appears to me to be no reason for you to raise issues with me on WUWT unless you feel the presence of an abusive, and scientifically illiterate audience to distract me is necessary for your argument.
    0 0
  5. Sphaerica, two comments of mine did not appear on Watt's up with that when initially posted. Not even the usual "awaiting moderation" status appeared. As a result I incorrectly surmised that I had been banned from WUWT. Hence my intemperate and inaccurate remark (since snipped) at 141 above. While I think the comment is well justified on other grounds, it was not in this case and offer Anthony Watts my (obviously qualified) apology for that remark. However, this is not a case of my being censored at WUWT, although I have been in the past.
    0 0
  6. Tom Curtis - I have had that experience on a couple of WordPress sites (including WUWT, but also others). Whether due to some cookies being cleared, refresh issues, or site database handling while a post is actually being moderated, I cannot say, but I believe it's simply structural to the mechanics of WordPress blogs. I've learned to come back and look at sites the next morning before getting concerned.
    0 0
  7. KR @156, I probably would have done that, except that Watts had so recently threatened to ban me.
    0 0
  8. Tom, thanks for the mockup. You have proven that it is possible to create an independent figure from K&H08 figure 3b with just a little work. I don't agree that it is perfectly sensible without knowing that it applies to the estimates in K&H08 fig 3a. Otherwise you are correct, it is now independent of 3a.

    Here's my list of uses of 3a: wide version:
    /climate-sensitivity-advanced.htm
    /lindzen-illusion-4-climate-sensitivity.html
    /ppm451.html
    /Schmittner-climate-sensitivity-goood-bad-ugly.html
    /christy-crock-6-climate-sensitivity.html
    /Monckton-Myth-4-Climate-Sensitivity.html
    /spencer_ocean.html
    /climate-sensitivity-skeptic-end-game.html

    upright version:
    /climate-change-little-ice-age-medieval-warm-period-intermediate.htm
    /detailed-look-at-climate-sensitivity.html
    /co2-warming-35-percent.htm
    /working-out-climate-sensitivity.html

    some offsite uses (incomplete search):
    http://www.carbonbrief.org/blog/2011/11/a-new-estimate-of-climate-sensitivity
    http://thinkprogress.org/romm/2010/09/19/206503/climate-sensitivity-lukewarmers

    I'll comment on one of those threads as you suggested.

    0 0
  9. Concerning the "which figures" to include discussion, I believe it is very much a matter of context and perceived intent. Without going into the details of the examples discussed, let me offer one that is equivalent but distinct. The CO2 science "MWP Project" purports to demonstrate that the MWP was as warm or warmer than today. As evidence they offer this graph from one particular paper that studied South Andes ice cores: This is one segment of a single figure (figure 6) of 3 such graphs for two other cores from that particular paper (Thomspon et al, 2003): That, in turn, is also paired with another figure (figure 5) of 3 Tibetan cores: These 6 graphs make the heart of the paper. Clearly, the inclusion of one carefully selected graph from figure 6 supports their contention, while the exclusion of five other graphs makes their selection seem... tilted. In particular, they demonstrate how widely temperatures varied even within the same continent, and that the peak presented by Quelccaya is not at all contemporaneous (off by several hundred years) with peak temperatures in any of the other cores. In fact, this one paper, if presented fairly, serves as strong evidence that the MCA was not a global event that is any way comparable to current warming. Obviously, there is always more information that could be included. As an editor or author, one is always faced with the choice between too much and too little. As an observer, one can always argue the wisdom of such choices after the fact. The question is not was it a good choice. The question is was it a clearly biased choice, intended to misrepresent the actual available information and the likely, most reasonable conclusion one might draw from that information. The question is, seeing what was there, do you feel that you (and others) have been misled by the selection of information presented.
    0 0
  10. Eric et al., Eric (skeptic) you are desperately trying to get traction with something that does not have traction, all the while admitting that the use of KN08 Fig3 here is not the same as Pat Michaels doctoring several graphs. So really this all amounts to nothing more than a very protracted strawman argument and attempt to fabricate debate on your part. As several people have noted, what panels one could/should include is highly subjective, is situation dependent and depends on the context. You do not seem to get those points. Moreover, given that you insist on feeding fodder to the uncritical readers at WUWT confirms my observation that you are not operating in good faith on this issue. And earlier you took offense/exception when I suggested that people were now going to "scour" SkS looking for examples of alleged figure doctoring, claiming that you had not done that (and that was true at the time). However, you have gone on to do just that at 158 above-- a fine example of duplicity on your part. Now can we please take this KN08 "discussion" to the appropriate thread, future comments about KN08 here will be summarily deleted.
    0 0
    Moderator Response: [Albatross] Text no longer relevant struck out.
  11. Albatross, I scoured at Tom's suggestion (150), otherwise I would not have spent time on it. The figure should be discussed in context within an appropriate thread (which we have started).
    0 0
  12. I believe that this discussion is a bit too focused on how to treat the graphics themselves. Chip Knappenberger has a point in that graphics might sometimes need to be redrawn or replotted and as long as both the original source and the changes are acknowledge this may very well be ok. It is certainly good practice to tell exactly what you have done with it but this is more of a gray area. What is never ok is to ignore the data that is problematic to your interpretation. This is true with your own data as well as when you use others. You might not always be able to discuss it in detail but you may not ignore it. In these cases the deleted material would clearly have weakened the argument. In addition the authors have highlighted the problems, both in their graphics and in their texts, as honest scientists should, while WCR has done neither. In the example by Sphaerica (#159) using only the Quelccaya graph and ignoring the rest in a discussion about the MWP would clearly be wrong, if it on the other hand was used in a discussion about the climatic history around Quelccaya I would say that it is ok. As previously said, it is all about the context. Sometimes it can be hard to tell if a change is misleading or not but if your readers can't see the caveats and the original authors think that what you did was misleading or close to scientific fraud you have obviously failed. The honest way to handle it would be to apologize and make a clear errata.
    0 0
  13. Eric @161, My apologies, I missed Tom's challenge to you @150-- I will modify my post above accordingly. Regardless, you have actually not addressed Tom's challenge to you by pasting a bunch of URLs. If you wish to respond to this, respond on the appropriate thread. Thanks.
    0 0
  14. Agreed with Geologist @162. I've made a similar point in a few comments. The underlying problem is that Michaels and Chip completely ignored the data that was inconvenient for them. Their deletion of the data from the figures was just a graphical representation of their overall method of pretending that the results they didn't like didn't exist.
    0 0
  15. Since when does “adapted” mean “redrawn or drawn from the data”? If I had the data that went into the graph, then I would have plotted up a new graph—but what’s the difference if I plot a new graph the way I want or alter some other graph so it plots what I want to show?
    Chip Knappenberger defends the erasure over at Eli's.
    0 0
  16. All, A big hat tip to Eli Rabett, who just posted the following quote from Paul Krugman. It perfectly encapsulates what is going on here. Paul Krugman [my bolding]: "Let me instead go meta; this is an example of why policy debate is so frustrating, and why I’m not polite. The key thing about how the conservative movement handles debate is that it never gives up an argument, no matter how often and how thoroughly it has been refuted. Oh, there will be more sophisticated arguments made too; but the zombie lies will be rolled out again and again, with little or no pushback from the “respectable” wing of the movement. In comments and elsewhere I fairly often encounter the pearl-clutchers, who want to know why I can’t politely disagree, since we’re all arguing in good faith, right? Wrong." Exactly! And instead of there being pushback from so-called 'skeptics' (e.g., WUWT), what do they do instead? They promulgate the misinformation and take steps to try an detract form the doctoring of graphs by Michaels.
    0 0
  17. I am so dismayed at this duplicity that I deleted some dollars from my vast wealth and made a donation to SkS. I urge anyone who thinks that the great unpaid work they are doing is worthwhile to do the same. Remember it may not be much individually but together it becomes a torrent. However pointless it is for the occupants to bicker over the direction of a crashing vehicle I like many have nowhere else to go when it is our planet Earth. Bert
    0 0
  18. Chip Knappenberger - Publishing your results is a reasonable idea, although the cost issue simply will not go away - cost per GB may drop, but more and more data gets collected all the time, filling all of the space available. George Carlin pointed this out quite a while ago. Personally, I would argue that having the results and the methods published are sufficient (they have been so far, ever since the instigation of the scientific method in the 17th century) as other investigators can check those methods and their own data for consistency and replicable results. However, this really has nothing whatsoever to do with the fact that Michaels has repeatedly erased portions of illustrative graphs in a fashion that can only be characterized as deceptive (as in the opening post) - removing data that contradicts the arguments he is making. Even if all data, all results, all graphs are available somewhere, graphs with missing data, missing the point made by the original authors and hence distorting the message the authors drew from their work, is simply not a legitimate tactic.
    0 0
  19. KR, If you (or me, or Pat) had the data available, you (or me, or Pat) could plot it up however desired along with any appropriate commentary. You (or me, or Pat) wouldn't have to alter the original figure in order to emphasize, simplify, clarify, or whatever, a particular point. Certainly, the authors of a paper are free to reach their own conclusions given the data, but so too are others. As the Eos op-ed was suggesting, having the data available to do so, would make doing so a lot easier (and, I might add, eliminate squabbling over alterations to a Figure). -Chip
    0 0
  20. Chip Knappenberger - And likewise, you (or me, or Pat) have the opportunity to distort a data set by erasing relevant portions, thus misleading the readers of that piece. Yes, the Eos op-ed suggestion would make it a bit easier to find the original data. But it by no means excuses distorting the data in the first place, thus misleading those to whom that might be the only presentation seen. It does not excuse mendacious behavior. And I use that word quite deliberately, given the documentation in the opening post of just what kind of distorted impressions can be made by modifying the data and the results of others, making a false argumentum ad verecundiam by presenting such distortions as the work of reputable scientists.
    0 0
  21. KR, As evidenced in this thread, I have laid out our justification and intent. You are free to disagree. But, this would have been the case whether or not we altered the original Figures or plotted our own. So that part of the argument--altering the original Figures (with acknowledgement)--is a distraction, rather than some sort of a gross offense as dana1981 seems to want to make it. -Chip
    0 0
  22. Chip Knappenberger - I will simply point to an earlier post I made in this thread.
    Patrick Michaels and Chip Knappenberger are principals in New Hope Environmental Services, "an advocacy science consulting firm" that apparently contracts with various fossil fuel interests (Patrick Michaels - 40% of income from the fossil fuel industry)[ ] ...presenting edited graphs (and misquoting papers) IMO crosses the line between advocacy and, to be frank, deception. A harsh statement, but I feel well supported by the data, as presented in the OP here and on the links in various comments. Michaels and Knappenburger are living examples of the Nick Naylor character from Thank You For Smoking.
    0 0
  23. Chip Knappenberger @171, your current argument seems to be that altering the figures is no greater an offence than simply cherry picking data (which you do not agree that Michaels has done). That position, however, is unsustainable. Allow me to illustrate. Creationists are well known for out of context quotations. One of the most famous examples come from Whitcomb and Morris, "The Genesis Flood" 1961, where they quote Ross and Rezak as saying:
    "Most visitors, especially those who stay on the roads, get the impression that the Belt strata are undisturbed and lie almost as flat today as they did when deposited in the sea which vanished so many million years ago."
    They adduce this quote as evidence thatthe contact plane between the Lewis Overthrust and underlying strata are undisturbed, and that therefore no over-thrust occurred. What Ross and Rezak actually wrote, however was:
    "Most visitors, especially those who stay on the roads, get the impression that the Belt strata are undisturbed and lie almost as flat today as they did when deposited in the sea which vanished so many million years ago. Actually, they are folded, and in certain places, they are intensely so. From the points on and near the trails in the park, it is possible to observe places where the Belt series, as revealed in outcrops on ridges, cliffs, and canyon walls, are folded and crumpled almost as intricately as the soft younger strata in the mountains south of the park and in the Great Plains adjoining the park to the east."
    By simply deleting an immediately related and obviously germaine sentence, Whitcomb and Morris turned a clear description of massive disturbance into an apparent description of no-disturbance. This process, out of context quotation, is an additional offence on top of the act of cherry picking. It amounts to both a lie and a slander - a lie because it presents a clear untruth about what Ross and Rezak said. A slander because in doing so it would have denigrated their reputation among people who knew about the Lewis Overthrust but did not know the full quotation. The examples of graphic distortion by Michaels given above are exactly analogous. In each case, the authors had a much larger message which they considered integral to the situation; which Michaels deleted without acknowledgement because he found that integral information inconvenient. So, in each case there is an additional offence to the cherry picking. It is the implicit lie about what the original authors wished to convey. http://holysmoke.org/icr4cult.htm
    0 0
  24. Tom Curtis (#173): Clearly, you and I disagree as to what the main message was that the authors conveyed in their papers. (details in the comment thread) -Chip
    0 0
  25. Chip Knappenberger - Based on examining Michaels work, the words here: (figure adapted from Gillet et al., 2012: note the original figure included additional data not relevant to this discussion) should really be interpreted as: (figure modified to remove data that contradicts our talking points) Given the multiple examples listed in the OP, I really see no other valid interpretation. The message Michaels presents is completely contradictory to that presented by the researchers of the data that has been distorted. That's not a disagreement on the main message conveyed by the authors. It is a distortion.
    0 0
  26. Chip Knappenberger @174, as shown by the quotes in the OP, you clearly also disagree about the germaine messages the authors intended to convey with their figures. In any dispute such as this, their opinion is the final authority. If Hansen and Urban think their graphs have been distorted, as they clearly do, the only honourable thing to do is to take down the offending graphs and replace them with exact copies of the original, noting the replacement and apologizing for the distortion while doing so. That is not an optional standard, IMO. Compliance or non-compliance with that standard marks the difference between an honest commentator and a propagandist.
    0 0
  27. KR's point at #175 deserves repeating:
    Chip Knappenberger - Based on examining Michaels work, the words here: (figure adapted from Gillet et al., 2012: note the original figure included additional data not relevant to this discussion) should really be interpreted as: (figure modified to remove data that contradicts our talking points) Given the multiple examples listed in the OP, I really see no other valid interpretation. The message Michaels presents is completely contradictory to that presented by the researchers of the data that has been distorted. That's not a disagreement on the main message conveyed by the authors. It is a distortion.
    There are many reasons for repeating it, but one that always rings a bell for me is that it goes a long way to explaining why deniers of the science are so preoccuppied with getting unfettered access to data... ...to wit, their interest isn't in the expensive and time-consuming career of doing original science, it's in finding ways to discredit the work of others, which makes all that inconvenient original work 'go away' in the public's perception. What the 're-analysts' want to do is to show that consensus scientists are 'wrong', by using the data of the scientists themselves. Doing so goes a long way to 'invalidating', in the mind of the public, the entire consensus of the real, professional scientists. It's poisoning the well, and it's cheaper, quicker, and has same desired end result as the more tedious alternative of going to the bother of generating new 'data'. Of course, it's not actually 'scientific', or even honest if it involves deliberately misrepresenting the data, but for any vested interests that are operating with the same paradigm previously used by Big Tobacco, that's beside the point. All they need is for FUD to stick to the consensus science.
    0 0
  28. Chip Knappenberger - "If you (or me, or Pat) had the data available, you (or me, or Pat) could plot it up however desired along with any appropriate commentary. You (or me, or Pat) wouldn't have to alter the original figure in order to emphasize, simplify, clarify, or whatever, a particular point...having the data available to do so, would make doing so a lot easier..." (emphasis added) This is a very interesting statement, given that the data presented in papers is intended to be sufficient to show the conclusions the authors have made based on their work. If you "emphasize, simplify, clarify, or whatever" in such a fashion as to draw diametrically opposed conclusions from those authors, essentially quoting them out of context, the appropriate term would be cherry-picking. And given the reference to the originals, an implication that those authors agree with the (mis?)conclusions drawn from cherry-picked portions of their data. If you disagree with someones results, papers, conclusions, etc, then do the work. Start from your own data, do a complete paper - don't cherry-pick subsets of other folks data or white-out sections of their graphs to support conclusions that those authors do not agree with. Quoting out of context is a fallacious argument - so is presenting an edited graph that removes the conclusions of the original authors.
    0 0
  29. KR, I think you have lost sight of the original articles and our coverage of them. Our coverage of both the Gillett et al. article and the Schmittner et al. article included large excerpts from the papers’ abstracts (where the authors summarize their main results and conclusions). The figures we used illustrated those results. -Chip
    0 0
  30. I see no way whatsoever to interpret the misrepresentation of data outlined in the original post as anything other than an attempt to mislead and misdirect the reader. There is simply no other way to look at it. When a man is cheating on his wife, and tells her he's "working late," well, he is working, in a purely physical sense, and he is out late, so it's not really a lie, is it? He's just leaving out certain data to emphasize, simplify and clarify, or whatever, a particular point (i.e. one that lets him cheat on his wife while saving him the pain of an expensive divorce). Any arguments to the contrary by Michaels or allies must be viewed in the same light ("Trust me, I'm not lying this time.").
    0 0
  31. Chip Knappenberger - Additional discussion on Gillett can be found on this thread, on a discussion you took part in. The excerpt Michaels included was incomplete, and did not mention any of the authors caveats. Including only part of the work, while leaving out vital caveats from the authors, gives a deceptively misleading impression of the work. Much as removing data from the graphs does - a misrepresentation that cherry-picks support for your talking points while ignoring (or hiding) data that contradicts them. It's simply indefensible behavior.
    0 0
  32. KR, Thanks for the reminder of the Gillett thread. As pointed out on that thread, I think our coverage of Gillett et al. was quite appropriate and on the mark. -Chip
    0 0
  33. Um, leaving out the caveats so the work could be misconstrued is "appropriate and on the mark"?
    0 0
  34. scaddenp @183 - leaving out the caveats and some very important data from the figures. 'Appropriate and on the mark' is not at all how I would describe that behavior.
    0 0
  35. #182, I wonder if Gillett et al think the same about your coverage? I seriously doubt that. In the light of the observed instances of the work of others being changed in order to generate talking points, maybe I can offer some help. It is painfully evident that you and Pat Michaels seem to get the science wrong each time you talk about it! For some reason, it keeps happening even when this is pointed out to you. But that can be repaired with some learning :) Below are some resources, from which you could begin your climate education: John Mason's Two Centuries of Climate Science 10 indicators of a human fingerprint on climate A must-watch video from Richard Alley on why CO2 is the biggest control knob, really well worth an hour of your time. And that's all apart from all the evidence for those pesky signs of warming, such as observed worldwide glacier retreat, Arctic sea ice loss (on near-record levels again this year), shifting plant and animal habitats and increasing sea level rise. There are signs that weather extremes are increasing in a manner consistent with the observed enhanced hydrological cycle and a warming climate. And of course that big nasty, ocean acidification. You could pretend that all this isn't happening, but that wouldn't be very scientific. Or you could start with what the science actually says. Surely that's appealing to you, Chip?
    0 0
  36. "I think our coverage of Gillett et al. was quite appropriate and on the mark."
    So, the Serial Deletion of Data (construed to be) Inconvenient to one's agenda is "appropriate and on the mark"? Methinks thou hoisteth by thy own petard, sirrah.
    0 0
  37. More of Michaels and Knappenberger's work, in this case textual rather than with graphs: Deep Climate has a review of their "appropriate and on the mark" (???) coverage of Easterling and Wehner, 2009 and Solomon et al 2010, with Michaels and Knappenberger claiming they were mainstream climate science indicating "no warming whatsoever over the past decade". The Michaels and Knappenberger articles were shown to be seriously cherry-picked and quote-mined, taking text out of context to remove critical conclusions from those works. This included not quoting statements that decadal trends were just not statistically significant (see The Escalator). This is not "...disagree(ment) as to what the main message was that the authors conveyed in their papers", it is distortion and misrepresentation. In my opinion, this is an ongoing pattern - paper after paper, time and again, cherry-picked, quote mined, and graphically edited to remove conclusions that contradict Michaels and Knappenbergers talking points. Actions that (again, IMO) goes well beyond the usual realm of a "advocacy science consulting firm", as Michaels and Knappenbergers group describes itself, to behaviors that I would find difficult to properly describe within the SkS comments policy...
    0 0
  38. A brief example of Knappenberger vs Knappenberger from KR's DC link. First:
    "Correct – the satellite-based, balloon-based, and thermometer-based global temperature records show no warming whatsoever over the past decade. Claims that the Earth’s temperature is rising at an unprecedented rate are clearly false – nothing could be further from reality."
    And Chip's comment a little later...
    "For some reason, most folks in this thread seem to think that I don’t think the world has been, is, and will continue to warm. I am not sure where this notion comes from."
    Maybe the notion comes from your published words, Chip. "The world is warming"; "no warming whatsoever". Which is it? The whole purpose of Easterling and Wehner's 2009 GRL article was to falsify claims such as the second sentence of the first statement by Michaels and Knappenberger above. Claims that the Earth’s temperature is rising at an unprecedented rate ... are entirely true! The 2000s do not contradict that, they actually support it strongly! See Tamino's excellent recent post - the 2000s actually lead to an increase in the overall warming trend, when added to the trends from 1980-2000. The 1980-2000 trend is smaller than the 1980-2011 trend! It doesn't give you much confidence in Michaels and Knappenberger's ability to summarise or interpret material published by other authors, as exemplified in the OP.
    0 0
  39. So Chip says:
    "Correct – the satellite-based, balloon-based, and thermometer-based global temperature records show no warming whatsoever over the past decade. Claims that the Earth’s temperature is rising at an unprecedented rate are clearly false – nothing could be further from reality."
    Hmmm, he needs to get his pal Michaels back on the agenda-train. Cue Michaels in 3, 2, 1...:
    "You've all seen articles say that global warming stopped in 1998. Well, with all due respect, that's being a little bit unfair to the data...it was a huge El Niño year, and the sun was very active in 1998...make an argument that you can get killed on, and you will kill us [skeptics] all..if you lose credibility on this issue, you lose the issue."
    -Patrick Michaels, 6 September 2009 [Source] You heard rightly, folks. Michaels is calling Game-Over on his pal Chip.
    0 0
  40. So...are we the xenomorphs?
    0 0
  41. Albatross@4: As is my norm, I'm drilling into each and every post here, at SkS, reading all the referenced links and data sources and in the spirit of open mindedness, I went and read up at WCR: Pray tell, is there any eye bleach you'd recommend, or where would I find an "unsee" button? And I thought WUWT was painful. Onwards and upwards!
    0 0

Prev  1  2  3  4  

You need to be logged in to post a comment. Login via the left margin or if you're new, register here.


The Consensus Project Website

THE ESCALATOR

(free to republish)


© Copyright 2024 John Cook
Home | Translations | About Us | Privacy | Contact Us