Climate Science Glossary

Term Lookup

Enter a term in the search box to find its definition.

Settings

Use the controls in the far right panel to increase or decrease the number of terms automatically displayed (or to completely turn that feature off).

Term Lookup

Settings


All IPCC definitions taken from Climate Change 2007: The Physical Science Basis. Working Group I Contribution to the Fourth Assessment Report of the Intergovernmental Panel on Climate Change, Annex I, Glossary, pp. 941-954. Cambridge University Press.

Home Arguments Software Resources Comments The Consensus Project Translations About Support

Twitter Facebook YouTube Mastodon MeWe

RSS Posts RSS Comments Email Subscribe


Climate's changed before
It's the sun
It's not bad
There is no consensus
It's cooling
Models are unreliable
Temp record is unreliable
Animals and plants can adapt
It hasn't warmed since 1998
Antarctica is gaining ice
View All Arguments...


Username
Password
New? Register here
Forgot your password?

Latest Posts

Archives

Record Arctic Sea Ice Melt to Levels Unseen in Millennia

Posted on 5 September 2012 by dana1981

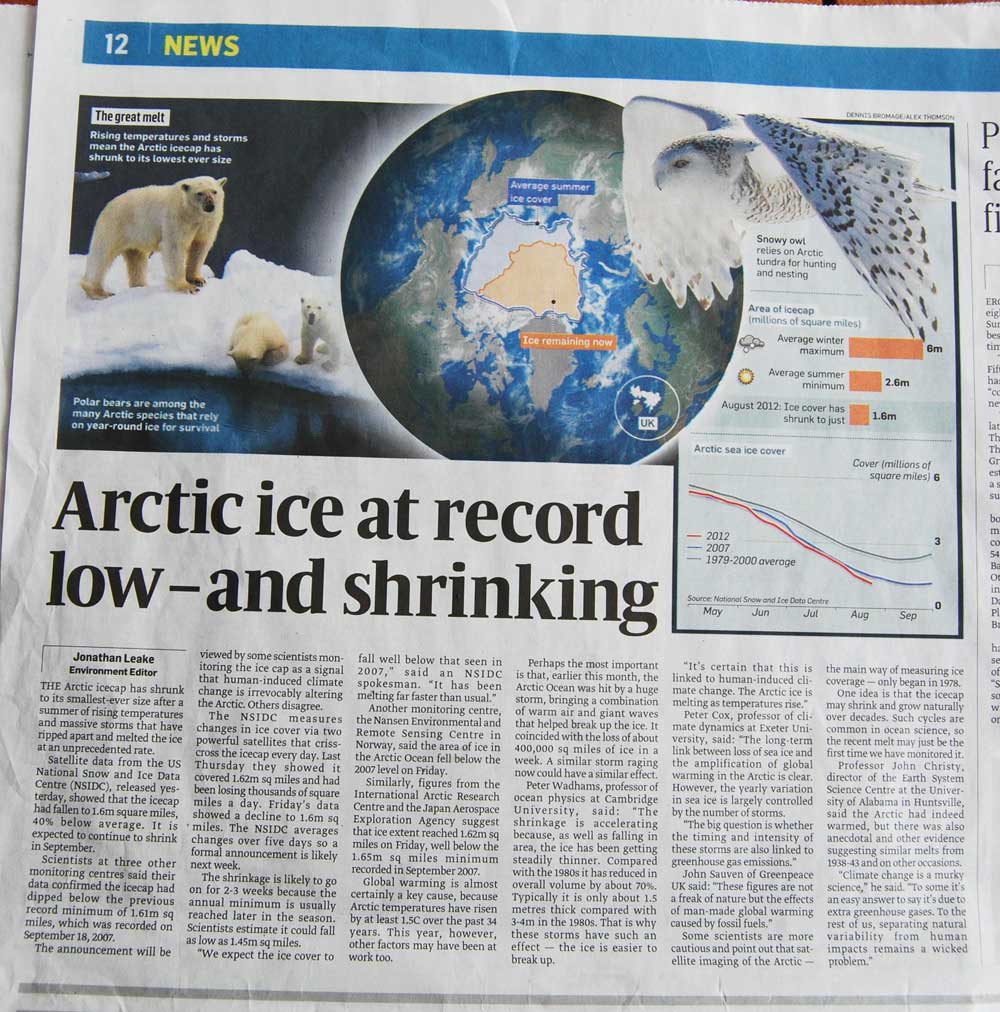
The record Arctic sea ice decline this year has predictably and deservedly received a fair amonut of media attention.  Jonathan Leake of the Sunday Times recently penned an article on the impending sea ice record.  The bulk of the article was quite good, but at the end succumbed to the standard mainstream media practice of seeking "balance," thus including some comments by John Christy.  Christy has become very reliable for arguing that anything and everything related to climate change probably just boils down to natural variability, as he recently told US Congress was the case with regards to the frequency of extreme weather events, contrary to the body of peer-reviewed scientific literature.

As we will see in this post, Christy once again misrepresented the body of scientific literature with regards to Arctic sea ice extent in his efforts to paint the Arctic sea ice death spiral as nothing out of the ordinary.

2012 vs. 1940

In Leake's article, Christy was paraphrased as saying that there is

"...anecdotal and other evidence suggesting similar melts from 1938-43 and on other occasions."

Christy's comments to Leake via email slightly differed from Leake's paraphrasing, as Christy claimed that evidence suggests summer melts during 1938-43 were "very low extent."  This is a rather vague and subjective statement - very low relative to what?  Given the context, Leake understandably appears to have assumed that Christy meant very low relative to recent years, and perhaps he did, but it is also possible that he meant 'very low' relative to the early 20th Century, for example.

This begs the obvious question - in the scientific literature, how does Arctic sea ice extent during the period 1938-43 compare to the rest of the 20th Century and current levels?  One of the most widely used long-term estimates of Arctic sea ice extent comes from Walsh and Chapman (2001), whose data are available from the University of Illinois (updated through 2008).  A description of the vast array of data used by Walsh and Chapman is available via tamino here, and the data are plotted in Figure 1.

summer sea ice extent

Figure 1: Average July through September Arctic sea ice extent 1870-2008 from the University of Illinois (Walsh & Chapman 2001 updated to 2008) and observational data from NSIDC for 2009-2011 (blue), with a fourth order polynomial fit (black soiid line).  Black vertical dashed lines indicate the years 1938-43.  

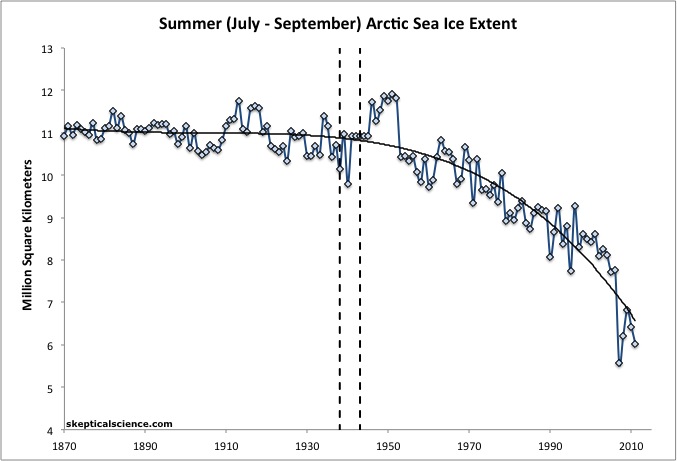
Clearly the extent of Arctic sea ice during 1938-43 was nowhere near as low as current levels, based on these data.  According to this reconstruction, the minimum extent during that timeframe (9.8 million square kilometers in 1940) was higher than it has been at any time since 1979.  In other words, Arctic sea ice extent has been lower than it was in 1938-43 during the entire satellite record, and the current average summer extent is approximately 4.3 million square kilometers lower than the 1940 minimum.

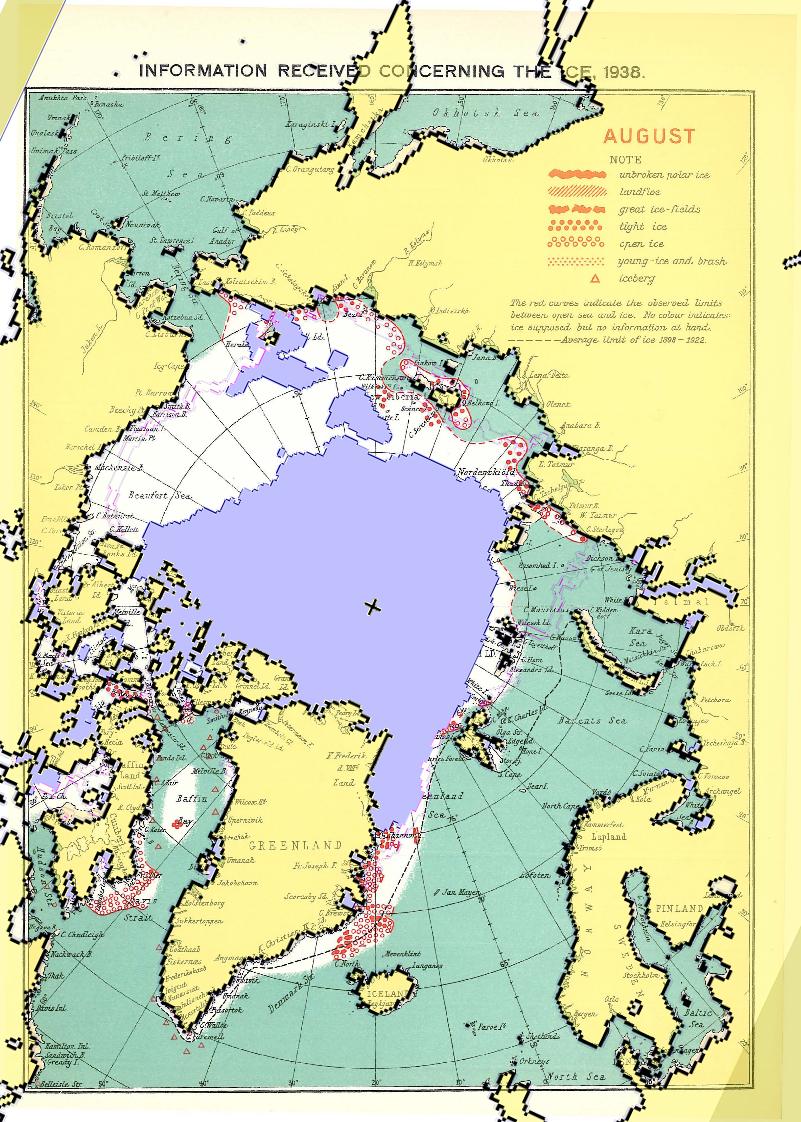
It's true that according to this dataset, 1940 was a local minimum - the lowest Arctic sea ice extent of the 20th Century up to that point, and a minimum that was not repeated again for another 20 years.  In that sense one could argue that Arctic sea ice extent at least in 1940 was "very low" compared to the early and mid 20th Century, but compared to the past 20 years it was actually very high.  This is also clear from a visual comparison of sea ice extents in 1938 and 2012 (Figure 2).

1938 vs 1943

Figure 2: Arctic sea ice extent from August 2012 from NSIDC (purple) overlaid on a map of sea ice extent in August 1938 from the Danish Meteorological Institute.  Red symbols indicate direct observations in 1938.

Henry Larsen, who sailed the Arctic from 1922 to 1948 (including 12 times surviving being stuck in the Arctic ice all winter), tried to sail the St. Roch through the Northwest Passage in 1940.  The voyage took more than two years to complete, as the ship struggled through the ice.  Larsen gave this firsthand account of the state of Arctic ice at the time:

"The three seasons of the short Arctic Summers from 1940-42 had been extremely bad for navigation, the worst consecutive three I had experienced as far as ice and weather conditions were concerned, and in my remaining years in the Arctic I never saw their like. Without hesitation I would say that most ships encountering the conditions we faced would have failed."

On the other side of the Arctic, Russian martime operations using icebreakers on the Northern Sea Route began in 1932 and give no evidence for improving ice conditions in this period; rather the opposite, as 1937 and 1940 were noted for heavy ice in the Laptev Sea.

Greenland Temperature and Arctic Dominoes

So what was the basis of Christy's claim of "very low extent" in 1938-43?  Christy provided two references to support his assertions, Box et al. (2009) and Kobashi et al. (2010).  However, neither of these papers involve reconstructions of Arctic sea ice extent; rather, they deal with reconstructing Greenland temperatures, which are not necessarily representative of Arctic temperature as a whole - after all, the continent is covered in a large ice sheet, and the reconstructions are from the summit of the Greenland ice cap, not at sea level.

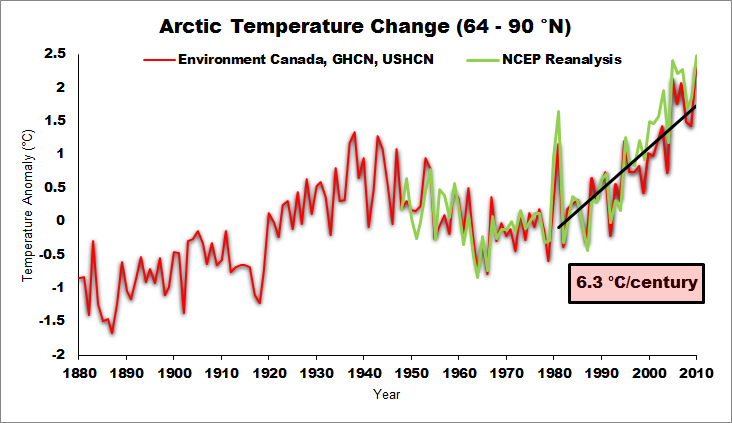
We contacted Jason Box (lead author of Box et al. 2009), who also noted that local temperatures are not the only factor at play in determining Arctic sea ice extent.  During the past two decades, Greenland temperatures have climbed rather steeply, surpassing local temperatures in the 1930s (Figure 3), and even moreso over the whole Arctic (Figure 4).  These rising temperatures have been accompanied by unprecedented Greenland ice sheet surface melt.  Greenland glaciers have declined (Bjørk et al. 2012) as have Greenland's ice shelves (Falkner et al. 2011).  For example, the Ward Hunt Ice Shelf, which was a least 3,000 years old, split off in 2002 (Mueller et al. 2003England et al. 2008, and Antoniades et al. 2011).

All of this regional ice loss has decreased the local surface reflectivity (albedo), causing the Arctic to absorb more solar radiation, and thus we can expect that similar temperatures now will have a larger impact on sea ice extent than in the past.

GIS Summer Temps 1840-2011

Figure 3: Greenland surface air temperature anomalies relative to the 1951-1980 average (Source)

arctic temps
Figure 4: Temperature Anomalies (1951-1981 Baseline) for the Arctic region (64-90°N) over the past 130 years according to ccc-gistemp analysis and NCEP reanalysis data.

In other words, there is a domino effect at play.  Human-caused global warming contributes to the summer Greenland warming (Figure 3), which causes snow to melt earlier, which causes decreased local albedo, which contributes to record Greeland ice sheet decline, which further decreases local albedo, which in turn contributes to the Arctic sea ice decline.

2012 vs. the More Distant Past

Christy also claimed that sea ice extent was low 1,000 years ago, as well as in the more distant past.  However, his reference for the claim of low sea ice extent 1,000 years ago was again Kobashi et al. (2010), which as noted above, dealt with Greenland temperatures rather than Arctic sea ice extent.

It's important to note that we expect the Arctic to have been cooling over the past ~6,000 years due to the Earth's orbital cycles.  Thus if we look back far enough in the past, we can certainly find a period during which the Arctic was hotter and Arctic sea ice extent was lower.  However, this actually contradicts John Christy's argument that the current sea ice decline could be natural, because that long-term orbital forcing has not reversed, and thus cannot account for the sudden and rapid Arctic warming and concurrent sea ice decline. 

Kaufman et al. (2009) reconstructed Arctic temperatures even further back in time than shown in Figure 5, and confirmed that the Arctic had been cooling for at least the past 2,000 years prior to the 20th Century, and found an Arctic temperature 'hockey stick' (Figure 5).

arctic hockey stick
Figure 5: Arctic temperature change reconstructed by Kaufmann et al. (2009) including data updated for corrigendum and including instrumental measurements for the Arctic region (60 to 90° N) from NASA.

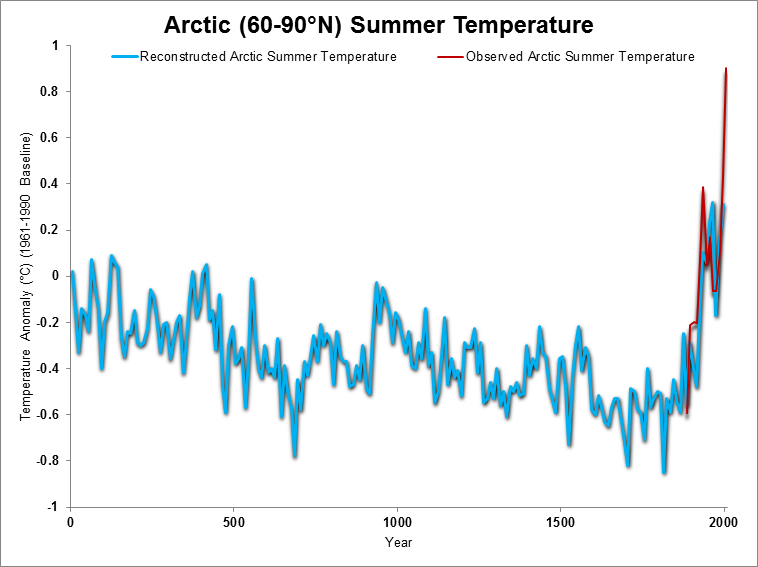
Perhaps the authoritative paper on Arctic sea ice extent over the past 1,450 years is Kinnard et al. (2011), which used a combination of Arctic ice core, tree ring, and lake sediment data to reconstruct past Arctic conditions.  The results are shown in Figure 6.

Figure 6: Arctic sea ice extent over the past 1,450 years reconstructed from proxy data by Kinnard et al., with a 40-year low pass filter applied.  Note that the modern observational data in this figure extend through 2008, and thus it is a close approximation of current conditions, even though the extent is not as low as current annual data due to the 40-year smoothing.

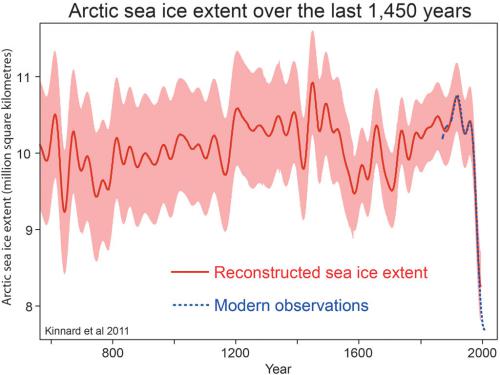
Based on the Kinnard results, Arctic sea ice extent is currently lower than at any time in the past 1,450 years. 

Polyak et al. (2010) looked at Arctic sea ice changes throughout geologic history and noted that the current rate of loss appears to be more rapid than natural variability can account for in the historical record.

"The current reduction in Arctic ice cover started in the late 19th century, consistent with the rapidly warming climate, and became very pronounced over the last three decades. This ice loss appears to be unmatched over at least the last few thousand years and unexplainable by any of the known natural variabilities."

Is the Sea Ice Decline Human-Caused?

The evidence above certainly suggests that humans have played a role in the Arctic sea ice decline, but what does the scientific literature say on the matter? 

Vinnikov et al. (1999) estimated the probability that the Arctic sea ice decline could simply be natural.  The authors used very long control runs of both the Geophysical Fluid Dynamics Laboratory (GFDL) and Hadley Centre climate models (5,000 years for the GFDL model) to assess the probability that the observed and model-predicted trends in Arctic sea ice extent occur by chance as the result of natural climate variability.  They found that large trends in sea ice extent only appeared over short time intervals in the control run, due to natural variability alone.  This suggests that natural variability will not cause large long-term Arctic sea ice trends.

Updating this analysis using observational data through 2011 (not even including the 2012 record low sea ice extent), the 32-year trend (1979-2011) is -530 thousand square km per decade, and the 20-year trend is -700 thousand square km per decade.  Using the Vinnikov et al. results, these trends both correspond to probabilities of well under 0.1% of being due solely to natural variability.

Day et al. (2012) used five climate models to try and quantify the contribution of natural variations in Arctic sea ice changes.  They found that between 5% and 30% of the Arctic sea ice decline from 1979 to 2010 could be attributed to the natural cycles of the Atlantic Multidecadal Oscillation (AMO) and Arctic Oscillation (AO), and even less can be attributed to natural cycles since 1953, since these natural cycles tend to average out over longer timeframes (as Vinnikov also found).

"despite increased observational uncertainty in the pre-satellite era, the trend in [Arctic sea ice extent] over this longer period [1953–2010] is more likely to be representative of the anthropogenically forced component."

Stroeve et al. (2011) noted that in 2009-2010, the AO was in a state which should have resulted in a large sea ice extent; the fact that 2010 was a year of relatively low sea ice extent is indicative long-term human-caused sea ice decline.

"Based on relationships established in previous studies, the extreme negative phase of the Arctic Oscillation (AO) that characterized winter of 2009/2010 should have favored retention of Arctic sea ice through the 2010 summer melt season. The September 2010 sea ice extent nevertheless ended up as third lowest in the satellite record, behind 2007 and barely above 2008, reinforcing the long-term downward trend."

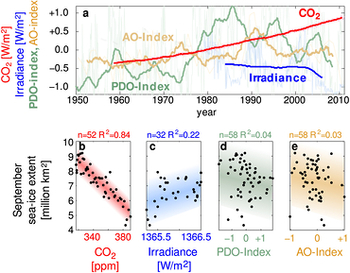
Notz and Marotzke (2012) also found very poor correlation between the AO and Pacific Decadal Oscillation (PDO) and Arctic sea ice extent (yellow and green in Figure 7), concluding:

"the available observations are sufficient to virtually exclude internal variability and self-acceleration as an explanation for the observed long-term trend, clustering, and magnitude of recent sea-ice minima. Instead, the recent retreat is well described by the superposition of an externally forced linear trend and internal variability. For the externally forced trend, we find a physically plausible strong correlation only with increasing atmospheric CO2 concentration. Our results hence show that the observed evolution of Arctic sea-ice extent is consistent with the claim that virtually certainly the impact of an anthropogenic climate change is observable in Arctic sea ice already today."

notz fig 4

Figure 7: Correlation between September sea ice extent and CO2 forcing (red), solar forcing (blue), PDO index (green), and AO index (yellow).  Figure 4 from Notz and Marotzke (2012).

Global Climate Models Struggle to Account for the Death Spiral

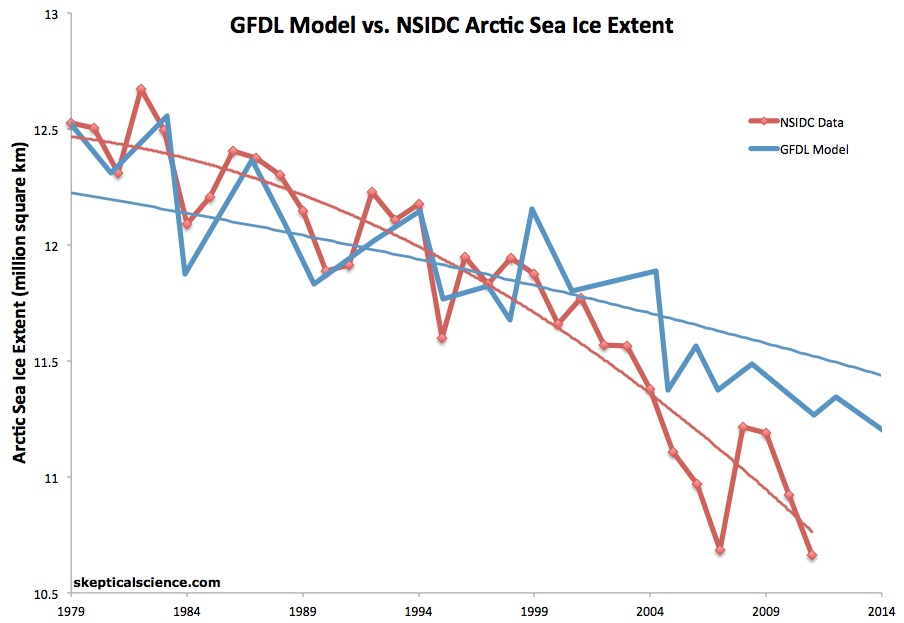
Arctic sea ice has declined at a rate significantly faster than global climate models have predicted.  Vinnikov et al. (1999) used the aforementioned GFDL and Hadley Centre climate models, forced by greenhouse gases and sulfate aerosols, to project how Arctic sea ice extent would change in the future.  As is the case with most climate models, they under-predicted the ensuing decline (Figure 8).  In fact, the Arctic sea ice decline is already 27 years ahead of Vinnikov's projections.

GFDL vs. NSIDC

Figure 8: NSIDC annual NH sea ice extent and polynomial fit (red) vs. the GFDL annual NH sea ice extent model and polynomial fit (blue) from 1979 through 2011.

The global climate models used in the 2007 IPCC report also failed to acount for the extent of Arctic sea ice loss (Figure 9).

data vs. models

Figure 9: Actual observations of September Arctic sea ice, in red, show a more severe decline than any of the 18 computer models, averaged in a dashed line, that the 2007 IPCC reports reference (NSIDC)

As Stroeve et al. (2012) discuss, newer climate models have made some progress in this area, but still cannot account for the full extent of the Arctic sea ice decline.

"Previous research revealed that the observed downward trend in September ice extent exceeded simulated trends from most models participating in the World Climate Research Programme Coupled Model Intercomparison Project Phase 3 (CMIP3). We show here that as a group, simulated trends from the models contributing to CMIP5 are more consistent with observations over the satellite era (1979–2011). Trends from most ensemble members and models nevertheless remain smaller than the observed value."

This may be due to the difficulty in accounting for natural variations, or the physics associated with the domino effect discussed above, or both.  There are some regional models (i.e. see the model of Maslowski et al., also discussed here) which have had success in accounting for and predicting Arctic sea ice changes, but climate models overall have been too conservative in projecting the rapid decline in Arctic sea ice.

Human-Caused Arctic Sea Ice Death Spiral

The scientific literature is clear that the current record Arctic sea ice decline is beyond what has occurred due to natural variability for at least the past several millennia, certainly beyond what occured circa 1940, and that human influences are primarily responsible for the rapid rate of the death spiral.  The rapid Arctic warming appears to have caused a domino effect by resulting in record ice melt and thus a significant decrease in local albedo, and therefore an increase in absorbed solar radiation.  The rapid warming and increased solar radiation absorption have combined to result in younger, thinner Arctic sea ice, which therefore melts more easily, making record low extents more likely to occur.

It is wishful thinking to believe that the Arctic sea ice death spiral could simply be due to natural variability.  The scientific literature clearly shows that human-caused warming is the main driver behind this exceptionally rapid decline.

Note: this post has been incorporated into new rebuttals to the myths Arctic sea ice loss in the 1940s was similar to today's, Arctic sea ice extent was lower in the past, and to update the Intermediate rebuttal to Arctic icemelt is a natural cycle.  The two new rebuttals also have short URLs http://sks.to/arctic1940 and  http://sks.to/pastarctic.  Our list of short URLs https://skepticalscience.com/shorturls.php is also a useful resource for tweeting and posting in blog comment threads.

0 0

Printable Version  |  Link to this page

Comments

1  2  Next

Comments 1 to 50 out of 56:

  1. I have read this three times Dana and I still do not fully understand all the nuances. That is due to my lack of full understanding not the quality of the article. What is very plain is that we are in real trouble even us Aussies. You have presented real evidence from refereed sources, not some glib hand waving argument based on fallacies or myth and following theories that have no basis in reality. How someone who purports to be an expert like Christy can argue against the overwhelming evidence is beyond any rational analysis. Bert
    0 0
  2. What's worse is how little reporting of this has occurred in the Australian media. I suspect that the media in this country have quietly placed global warming in the too hard basket and decided to concentrate instead on the politics of the carbon tax and carbon pricing.
    0 0
  3. It's mostly been ignored in the American media too, probably due to the political conventions leading up to the November elections. Unfortunate timing in that respect. Hopefully there will be some news coverage once we reach the minimum.
    0 0
  4. Funny, just made an image that might fit in the article without knowing you were in process of writing about this: http://erimaassa.blogspot.fi/2012/09/who-did-it.html
    0 0
  5. Thanks Dana for nice summary on recent ice, especially the pointers to those arctic/greenland reconstructions that were unknown to me tonow. Fig3 & 4 nicely represent Arctic amplification: delta T=3K within 64-90°N vs. 0.8K globally. I would suggest to add the recent John Christy's testimony in Congress to Christy Crocks button. That latest crock deserves a big prominence, because it's beyond my comprehenssion how a person of his stature could sacrifice his entire reputation by telling evident lies under oath. And he keeps doing it while evidence keeps mounting with 2012 melt.
    0 0
  6. I'm afraid my caveats on figure 2 didn't make it into the final article. Figure 2 is a comparison of the end of August for 2012 to an unspecified August estimate for the 1938 data. It would be better to use the NSIDC August average, or the extent from a date in mid August. Unfortunately NSIDC doesn't seem to archive its daily images, and the August average is not available yet. I will provide an updated figure as soon as I can. Also, the white area in the 1938 image in not observed directly: The observations are the red lines and symbols (and possibly coastal observations which are unmarked), so some of it is speculative. However everywhere where observations are available, the limits of the ice extend far beyond this years pack. Nonetheless, the best evidence we have found directly contradicts Chisty's claims. If he has any evidence to support those claims, he should present it.
    0 0
  7. When, sometime in the not-too-distant future, the Arctic becomes -- to all intents and purposes -- 'ice-free', it will be important that it's worded correctly in newspapers, articles and blogs. I'm sure we can all imagine the rush amongst those in denial (and Daily Mail reporters) to find a photo of any ice still remaining, or reforming, anywhere within the Arctic circle -- at any time of year -- to prove, "it's all a hoax". I can see Christopher Booker's Telegraph column right now. How do we head that off?
    0 0
  8. Hmph! Is there an 'unthwarted' version of the NSIDC 'Observations and model runs'-graph somewhere? It's not that I question the data per se, but having it presented thus in 3D gives space for 'interpretation'. Is the red line in front of the blue field, is is lower because of the 'lifted' POV etc. Let's leave the graph-mangling to Monckton and his ilk.
    0 0
  9. I can see Christopher Booker's Telegraph column right now. How do we head that off?
    I had an image in my mind of a representation of Santa's place, in place at the North Pole, and with 360° webcam monitoring. Imagine the restive response of the planet's kids as they watch the digs of their favourite fantasy character disappear. Imagine how the adults of the world might explain to their children why they're allowing Santa's shed to not-so-slowly sink into the sea.
    0 0
  10. (-Snip-)
    0 0
    Moderator Response:

    [DB] Please note that posting comments here at SkS is a privilege, not a right. This privilege can and will be rescinded if the posting individual continues to treat adherence to the Comments Policy as optional, rather than the mandatory condition of participating in this online forum.

    Moderating this site is a tiresome chore, particularly when commentators repeatedly submit offensive or off-topic posts. We really appreciate people's cooperation in abiding by the Comments Policy, which is largely responsible for the quality of this site.

    Finally, please understand that moderation policies are not open for discussion. If you find yourself incapable of abiding by these common set of rules that everyone else observes, then a change of venues is in the offing.

    Please take the time to review the policy and ensure future comments are in full compliance with it as no further warnings will be issued.

  11. Clyde, the criticism about "balance" is precisely that the media does not present a truly balanced view. Perhaps a better way to say it is that the common approach in the media is not to present a properly weighted view. Please consider an analogy. Let's say you consult one hundred doctors about some symptoms you have. 97 of them give you diagnosis A, 2 do not arrive at a clear diagnosis, and one gives you diagnosis B. When loved ones ask after your health, would it be a properly balanced response to say "Well, it could be A or it could be B"? This is what is being criticized in the post above. The mainstream media presents the position of about 1% of scientists who have studied climate as though it is of comparable relevance to the position of about 98% of scientists who have studied climate. It is not balance, it is "balance;" an Orwellian term if ever one existed.
    0 0
  12. Thanks for the article. Clyde: Interesting comment. If you---or anyone for that matter---has evidence that the recent decline in Arctic sea ice is "similar" to other time frames, I'd actually be quite interested in reading about that. However, I'm not interested in reading the other assertions in your comment. The article above clearly lies out why Christy's claims are questionable at best. Believe it or not, there are many people from this "point of view" who would actually be thrilled to wake up one day and find that the concern regarding greenhouse gases and climate change are entirely unfounded. However, the world around us is full of increasing evidence that convince me otherwise.
    0 0
  13. As kevin s @11 notes, the criticism is of false balance. When 97% of experts agree on something, getting a quote from one of the few who disagree is not achieving balance, it is creating the semblance that there is serious dispute amongst the experts, over-representing the few 'skeptics'. As the post above clearly shows, there is really no dispute in the scientific literature that the current sea ice decline is unprecedented over the past several thousand years and primarily human-caused. Christy's inclusion in the article didn't add anything except unnecessarily sowing doubt where no serious doubt exists.
    0 0
  14. chriskoz @5 - all of our posts on Christy are included in the blog posts tab of his 'skeptic' page.
    0 0
  15. I like the way Christy used the phrase "To some... To the rest of us...", implying that those he disagrees with are actually the ones in the minority. It reminds me of the following exchange in Blackadder: Rum: Opinion is divided on the subject. Edmund: Oh, really? [starting to get the picture] Rum: Yahs. All the other captains say it is; I say it isn't. The response seems apropos, too: Edmund: Oh, God; Mad as a brush.
    0 0
  16. Jason B @15, Good catch. We noticed that too. One has to really question whether or not Christy truly believes what he is saying. Regardless of how one tries to frame it, it reflects very poorly on him. Either Christy is ignorant of where the body scientific evidence and theory stands and that his opinions are by far associated a fringe element, or he accepts that and is guilty of engaging in highly misleading rhetoric and propaganda in public. Sadly, it would not be the first time that he has engaged in the latter.
    0 0
  17. John @7, That is a very important and valid question. Fortunately, people have been thinking about this. Right now, IIRC, the accepted definition of an Arctic free of sea ice is when the sea ice extent drops below 1 million km^2. But it would be very prudent at this point to unequivocally define what is meant by "ice free". Does it refer to ice extent, area or volume, or all three metrics dropping below specified limits? Does it refer to those limits being met for a day, 5 days or a month? Which product (or products) will be used?
    0 0
  18. Sorry... links fixed here, please feel free to delete the first one. Alert to false balance, I was pleasantly surprised by a Sydney Morning Herald article by journalist Nicole Hashem. She found a way to avoid false balance while still providing an alternative view in this article about Tim Flannery and a Climate Commission public forum. You'll need to read the article to see who she used for balance, I won't spoil the moment. Sydney Morning Herald I liked it so much, I blogged it here.
    0 0
  19. This is an excellent article, and provides a comprehensive overview of the state of the Arctic from a long-term perspective. Takeaways from this: 1) Arctic is headed toward an ice-free condition in the next few years(possibly by 2020). 2) Human activity is the cause. 3) The deniers of #1 and #2 will stop at nothing to hold on to their illusion for as long as possible, and when the inevitable ice-free Arctic arrives, they'll say something like "so who cares...it doesn't affect me." or worse, "now we can get at the oil." For a nice summary of this summer's Arctic melt, take a look at this article, with links to other research that answers the question, "Why you should care...": [LINK]
    0 0
    Moderator Response: [RH] Hot linked url
  20. Albatross said: "Either Christy is ignorant of where the body scientific evidence and theory stands and that his opinions are by far associated a fringe element, or he accepts that and is guilty of engaging in highly misleading rhetoric and propaganda in public..." ____ There is another possibility. Christy is blinded by his own belief structure that tells him that Anthropogenic warming simply can't have such drastic effects as melting the Arctic decades before most climate models even said it would happen. In this case, Christy is guilty of the "confirmation bias" problem in that he only sees what he wants to see and interprets it based on his paradigm that AGW is small at best and will not have significant impacts...
    0 0
  21. Figure 2 in this is a pretty striking one. As far as "ice free" Arctic summer goes, i think the big media hit will come when we see something like figure 2 with just a small patch of ice, completely surrounded by open water at the pole. Has to be a WTF moment for "skeptics" when that happens surely??
    0 0
  22. 17, Albatross, Personally, I don't think that distinction is going to matter for more than a few years. People can fight in that period over the distinction, but after that zero ice will be the new black. Then the game will switch to "how early" in the year zero is reached. And we get to see the answer to the really big question, which is "will there even be winter ice once the summer ice is seriously gone?"
    0 0
  23. 21, catamon, WTF moment? Don't bet on it. There will be: 1) Joy that we can finally drill and easily traverse the Arctic. 2) Certainty that this has all happened before, and it's part of a natural cycle. 3) Questions of how you can possibly think that the loss of Arctic ice is caused the the thoroughly discredited GHG Theory to begin with.
    0 0
  24. There is an abstract at AGW Observer today on the Arctic sea water temperatures. Deep Arctic Ocean warming during the last glacial cycle - Cronin et al. (2012) It starts out - Abstract: “In the Arctic Ocean, the cold and relatively fresh water beneath the sea ice is separated from the underlying warmer and saltier Atlantic Layer by a halocline. Ongoing sea ice loss and warming in the Arctic Ocean have demonstrated the instability of the halocline, with implications for further sea ice loss. ...." If I'm reading it right, it's saying their research indicates there is a layer of warmer water, below cold fresh surface water, that gets pushed down during a glacial period and rises during warming. After reading the SkSc article, I wondered if this might have something to do with climate models under estimating sea ice loss. ?
    0 0
  25. @catamon #21 Indirectly you raise a couple of interesting points. 1) Studying the time lapse images of the yearly Arctic ice melt it becomes clear that in all likelihood the last of the ice during the summer minimum will end up against the north Greenland coast -- perhaps because it's fed by the calving glaciers(?). And following on from that... 2) The next big summer melt landmark will be the moment that the North Pole becomes part of the area that is 'ice-free'. At that point (as others have pointed out) Father Christmas is homeless. This will be an important news item to prepare for.
    0 0
  26. NSIDC August average extent is out. I believe this to be a fairer comparison than the original. Click for full size version. Conclusions are unchanged.
    0 0
  27. sailrick, that is one of several factors which have been proposed as contributing to the accelerated ice loss; 1: Warmer water rising to the surface and causing more 'bottom melt' 2: Warmer water making its way in from the Atlantic and Pacific and causing more 'bottom melt' 3: Increased export of ice out of the Arctic due to greater breakup and stronger currents 4: Increased melt due to 'physical processes' such as waves and storms increasing as the ice cover retreats 5: Black carbon pollution settling on the ice and increasing absorption of sunlight 6: Changes in precipitation resulting in less white snow and thus more solar absorption 7: Possible errors in basic melt calculations such as underestimating the amount of sunlight absorbed by ocean water through thin ice. Et cetera. My money is on increased bottom melt and physical breakup being the most significant factors, but the way it is going the ice will be gone before they can gather enough data to get a definitive answer.
    0 0
  28. I kmow this is only vaguely connected but it is worth a look. http://www.bbc.co.uk/nature/15835017 Bert
    0 0
  29. Kevin @26 - thanks, I've updated the graphic in the post.
    0 0
  30. NSIDC has just issued another report on the Arctic sea ice - click here. Compared to September conditions in the 1980s and 1990s, this represents a 45% reduction in the area of the Arctic covered by sea ice.... ...In 2012, the rate of ice loss for August was 91,700 square kilometers (35,400 square miles) per day, the fastest observed for the month of August over the period of satellite observations. In August 2007, ice was lost at a rate of 66,000 square kilometers (25,400 square miles) per day, and in 2008, the year with the previous highest August ice loss, the rate was 80,600 square kilometers (31,100 square miles) per day.
    0 0
  31. I seached for any information regarding any funding that he might have received from what might be considered 'undesirable' sources, but found none. I think such information would be valuable. I found something about Patrick Michaels recently, but have forgotten where. I think I just assumed that should I need it again, this site was bound to have it. Wrong! This information would help in forming an opinion regarding someone's veracity and it would best be found under their'skeptics' section entry. If none is known, then perhaps it should clearly state 'no known funding issues' or such like.
    0 0
  32. Hey Bert, #28, that was an interesting link -- I'd never come across 'brinicles' before. Thanks!
    0 0
  33. funglestrumpet @31 - while we might mention an individual or group's funding sources in a blog post, SkS is above all else about the science, which is why we focus on scientific statements and not funding. If you're interested in information about funding sources, sites like SourceWatch and Exxon Secrets are good resources. This is probably what you were thinking of regarding Pat Michaels.
    0 0
  34. dana @ 33 Thanks! Just a thought: if scientists disagree, I am sure I am not alone in taking the advice 'to follow the money' to heart. Perhaps a permaneant link to those other sources of such information might help all those who come here for clarification on this issue. There are many for whom this issue is recognised as more than academic; they see it as their and their children's future.
    0 0
  35. funglestrumpet @ 31: DesmogBlog maintains a denier database. Their entry on Pat Michaels is here. It includes some funding info.
    0 0
  36. Excellent post, Dana!
    0 0
  37. Thanks Dana.. In a parallel research that I summarized and published on http://planet-earth-2017.com/heat-not-from-the-sun/ I link the change in temperature belts as well as the increase in global temperature to the tilting and weakening of the magnetic field which started some 150 years ago and has greatly declined in the last couple of years. If my analysis is correct through proposing a different model of the geophyisics that govern the planet and through histroy records, then the situation will get worse before it gets better! You can only design and deploy the right strategies in Agriculture, Energy, Infrastructure, ..etc once the root cause of Earth changes is confirmed.
    0 0
  38. Astrofos@37....um, *intriguing* analysis. Have you had this published in a refereed journal? As a geologist, I find your conclusions--well, let's say--*fascinating.* I await to hear other learned voices, here, comment upon them, also: Assuming I read it correctly, you assert the melting of the Arctic to be more a function of the heat from the "Thermosphere," rather than heat absorbed by the oceans? As for the Mars reference...you do know Mars has no magnetic field, certainly nothing even remotely close to Earth's, right? Some peer-reviewed references to back up your conclusions would be appreciated.
    0 0
    Moderator Response:

    [DB] Fixed typos per request.

    Fascinating? No. Merely interesting.

  39. DB, ModResp@38...first, thanks a heap for correcting my fat fingered, early-AM typos! Secondly, per your well-put codicil to my post..I was *tryin'* ter be polite...;) I'm *breathlessly* awaiting a response from Astrofos, though, I'm not holding my hand on my...well, never mind. >;-P
    0 0
  40. Perhaps Astrofos is now exercising discretion...
    0 0
  41. We also await, with not very bated breath, Astrofos' explanation for day and night, seeing as how the rising and setting of the big yellow thing in the sky appears to have so little to do with Earth's temperature /sarc. Reality must seem a very strange place to some. CBDunkerson #26, nice list of points, except I think for your #6, which might be amended to note that more snow overlying the sea ice can inhibit ice thickening. It's one explanation for why the Canadian Arctic had quite a cold winter yet the NWP opened quickly after the surface snow had melted.
    0 0
  42. So, there's been a report, possibly on the Woods Hole Oceanographic Institution (WHOI) site (although I can track it down with a link if needs be), that there's a massive phytoplankton bloom happening in Arctic because of less ice cover. I wondered if this might serve as a proxy experiment for those geoengineering proposals to increase CO2 sequestration in ocean by inducing phytoplankton with iron seeding. Specifically, I wondered if it might be possible to measure CO2 drawdown in Arctic because of increased bloom and see if it pays. Thanks.
    0 0
  43. That link to plankton report is here: http://www.whoi.edu/main/news-releases?cid=139069&tid=3622 I'm not suggesting I am in favor of such a geoengineering exercise, since there are many unknowns and conceivable lateral impacts on the ecosystem. Don't even know if the carbon remains sequestered. My point is that if CO2 is getting drawn, this might offer a calibration of how much in a natural setting such a bloom might offer in terms of effectiveness.
    0 0
  44. You can't say the Sunday Times article was good if it included an interview with Christy, who is widely discredited, as you pointed out. This is just one more example of false balance, and it provides an escape valve for the public- as well as an excuse to do nothing.
    0 0
  45. It's all very intriguing, but I have one question, I'd like to see answered that seems to be whitewashed over. I'd like to pre-qualify that question with the statement, that I'm not disputing Global Warming. Obviously we have it, but what portion to attribute human endeavors I'm not willing to put a figure to. Now my question is, we see how much ice coverage we are getting in the summer, but from all I can find it appears we still have about the same average coverage "area" in the winter. Now obviously the coverage is getting thinner, but we are still getting around the same amount of ice area in the winter. Correct me if I'm wrong and point me to sources disputing that. Now, of course, I'd also like to point out, based on the graphics that the plots are a bit self-serving. I'd like to see graphs with zero points on both axes, and some of the lines are plotted to look more/less severe than they are in reality. Lastly, I'd like to point out, based on the current slope, we might now be in an asymptotic curve (whether geometric or exponential is not clear from the distorted graphs) and there really isn't anything we can do to stop the ever impending and accelerating approach to "Arctic Ice Free Summers". Since it looks like we are not even coming close to icefree winters. Anyway, I've long suspected we were past the point of no return on this item, based on my own readings and math knowledge.
    0 0
  46. Jack, the surface of the Arctic ocean will freeze in winter to fill the space available to the ocean itself, regardless of the thickness of the ice. The -maximum- extent of the ice is set by the general geographic arrangement of the ocean and land, so failing us plunging into a new ice age or the planet becoming much warmer than any projections (as far as I know of, anyway) that maximum isn't going to change a lot. As to the scale of the graph, think about a clinician plotting a patient's temperature. Scaling the graph of the temperature of a human body to zero would cause the clinician to miss changes in the patient's temperature indicating drastic health problems. It's kind of the same deal here; the ice extent in summer does not have to drop to zero to tell us we can expect systemic changes in weather and climate in the NH.
    0 0
  47. Jack W: Tamino has a graph derived from NSIDC data and a link to (and information extraced from) a paper, Kinnard et al 2008, showing maximum extents and minimum extents. (Note that the NSIDC info requires log-in to view directly and the Kinnard et al paper is behind a paywall.) It appears that maximum extent has declined slightly (insofar as a 1 million km^2 decline is slight). I am not certain your criticism of the graphs is on point. An annual January-December plot of sea ice extent has no 'zero' in the time axis; nor does a sea ice plot since the start of direct satellite measurement (in 1979) or century-long reconstructions (the Kinnard paper). There is also, as far as I can see, nothing misleading about omitting some lower values of sea ice extent that the sea ice hasn't reached, until it becomes necessary (which, to be fair, may be sooner than we would all like).
    0 0
  48. Jack W, Your point is certainly worth addressing, and from several angles. (1) First, the facts about ice "recovering" in the winter... yes, it does, and you correctly note that it does not have the same thickness. What matters here is two things. First, most of the Arctic is in 24-hour darkness for about 1/4 of the year. [See this fun toy here and this even better one here.] This means that it is going to get very, very cold up there when the sun is down, so it is no surprise that the ice is recovering (for now). But... despite the mere loss of something that has existed for maybe up to 100,000 to 800,000 years, the loss of summer ice puts in motion some dangerous feedbacks. It doesn't matter much if the Arctic is ice covered in the winter, but if it is open water during the summer, it will absorb rather than reflect the sun's rays. That absorption results in a major change in the energy balance. One scientist recently estimated this as equivalent to adding another 20 years worth of CO2 emissions to the atmosphere. And that's not the only feedback. Scientists grow ever more worried that we are going to release vast quantities of methane tied up both in the permafrost and in the Arctic seabed. Combined, these factors will multiply the effect of man's carbon emissions. We've known that this would happen in general (search for "climate sensitivity" and "positive feedbacks"), but not necessarily this quickly. That's frightening. (2) Beyond this, the fact that the Arctic is returning to an ice-covered state in winter is not guaranteed to continue. Studies have been conducted that the Arctic only has two stable states, ice-covered or ice-free. What we are seeing now may be a short-lived interim period while the system toggles from one state to another, but it may well be that when the globe warms enough and enough ice vanishes that the Arctic does not grow sizable amounts of ice even in months of 24-hour darkness. (3) As far as being beyond the point of no return, yes, that's what has everyone scared... that we've already passed a point to stop this, and the subsequent positive feedbacks will kick in, making things even worse. (4) As far as not being sure what portion to attribute to human endeavors. First look at 1, 2, and 3 and tell me that you're willing to take that risk. Second, consider that what we're seeing in the Arctic hasn't happened to this extent since 6,000 years ago, at the peak of the Holocene Thermal Maximum (i.e. the warmest period of our interglacial -- for thousands of years we've been in the slow decent into the next glacial, and this reversal we see now is unheard of in the 800,000 year ice-age record). Given that all other factors -- a quiet sun, for example -- leave nothing except anthropogenic influences to be driving temperatures higher than they've been in 800,00 years, and given that a completely ice-free Arctic, if we reach that state (which as you've said now seems inevitable), a state that has not existed on this planet for hundreds of thousands of years and maybe not since the start of this ice age (period of glacial/interglacial transitions) 2.6 million years ago... do you really question the anthropogenic influence here? Which of nature's fairies is raising temperatures and melting the Arctic ice in a way this planet hasn't seen in hundreds of thousands and maybe millions of years?
    0 0
  49. Jack, looking critically at Arctic maximum requires one first and foremost to take into account land constraints. Max area is constrained by land. If there were no land in the northern hemisphere, the winter max area trend would be much more useful than it actually is. It is a downward trend, but not quite as severe as summer minimum trend, and the trend starts to increase later in the winter series compared to the summer. The area that melts each melt season is also increasing. If minimum were today, 11.35 million km2 would have melted, an instrumental period record. Not surprising, though, since the ice is thinning. While 2012 started out anomalously high in area (against the trend), the drop was staggering in intensity when it came. There were 22 60-day periods where the average daily loss was over 100k km2. There was one such period in the entire instrumental record before this year. Will October be an equally sharp beginning to the race to the maximum? Or will the warmth linger and force the growth spurt to begin in earnest later? Volume trend is down on every day of the year when using the full record as a basis. I get something like 2070 for winter max ice free when I extrapolate a ten year linear to zero intercept. That's unlikely, of course. Funny thing is, I can't tell you why. I suspect that decrease will slow as area max gets closer to the 80 degree line, but if ice is still mobile, then there's no reason to think it might not be susceptible to flushing and mixing. This year's anomaly was, for my money, greatly enhanced by high-temp river drainage. That drainage was high temp thanks to the heat concentrated over parts of Siberia and North America (and the snow cover anomaly). And that, of course, can be tied to polar amplification related changes to the big circulation cells. 2013 is a crucial year. If we get a repeat of 2012, then 2012 will probably be considered the second barrel of the 2007/2012 tipping points. My penny and a half.
    0 0
  50. To add to Sphaerica's last point, orbital forcing--the primary forcing behind ice ages--is trying to cool us right now. Yet we warm. Tzedakis et al. (2012) tells us that we need less than 280ppm CO2 for ice age glacial inception. We're at 395ppm right now and growing rapidly. CO2 is going to take a long while to drop, even if we went to zero emissions today. We're not going to go to even zero trend for at least decades.
    0 0

1  2  Next

You need to be logged in to post a comment. Login via the left margin or if you're new, register here.


The Consensus Project Website

THE ESCALATOR

(free to republish)


© Copyright 2024 John Cook
Home | Translations | About Us | Privacy | Contact Us