Climate Science Glossary

Term Lookup

Enter a term in the search box to find its definition.

Settings

Use the controls in the far right panel to increase or decrease the number of terms automatically displayed (or to completely turn that feature off).

Term Lookup

Settings


All IPCC definitions taken from Climate Change 2007: The Physical Science Basis. Working Group I Contribution to the Fourth Assessment Report of the Intergovernmental Panel on Climate Change, Annex I, Glossary, pp. 941-954. Cambridge University Press.

Home Arguments Software Resources Comments The Consensus Project Translations About Support

Bluesky Facebook LinkedIn Mastodon MeWe

Twitter YouTube RSS Posts RSS Comments Email Subscribe


Climate's changed before
It's the sun
It's not bad
There is no consensus
It's cooling
Models are unreliable
Temp record is unreliable
Animals and plants can adapt
It hasn't warmed since 1998
Antarctica is gaining ice
View All Arguments...


Username
Password
New? Register here
Forgot your password?

Latest Posts

Archives

Resolving Confusion Over the Met Office Statement and Continued Global Warming

Posted on 10 January 2013 by dana1981

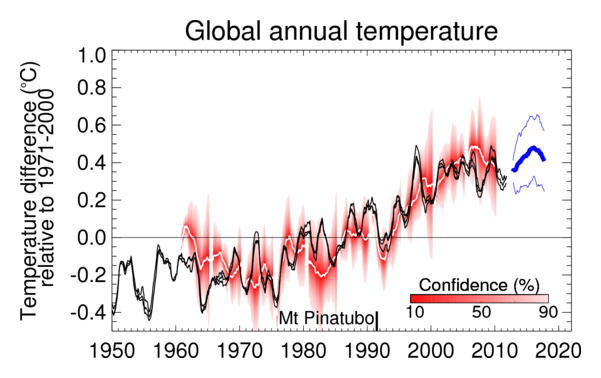
Recently, the British Met Office issued a prediction for global surface temperature changes over the next five years (Figure 1).

Met Office decadal prediction

Figure 1: Observed (black, from Hadley Centre, GISS and NCDC) and predicted global average annual surface temperature difference relative to 1971-2000. Previous predictions starting from June 1960, 1965, ..., 2005 are shown as white curves, with red shading representing their probable range, such that the observations are expected to lie within the shading 90% of the time. The most recent forecast (thick blue curve with thin blue curves showing range) starts from November 2012. All data are rolling annual mean values. The gap between the black and blue curves arises because the last observed value represents the period November 2011 to October 2012 whereas the first forecast period is November 2012 to October 2013.

This latest prediction anticipates a bit less global surface warming than the prediction from last year, as the Met Office explained:

"The latest decadal prediction suggests that global temperatures over the next five years are likely to be a little lower than predicted from the previous prediction issued in December 2011.

However, both versions are consistent in predicting that we will continue to see near-record levels of global temperatures in the next few years."

"...changes in ocean surface temperatures in some parts of the world over the past year are understood to have made a key contribution to the difference between the 2011 and 2012 forecasts, but other factors will also have played a role."

In other words, the Met Office anticipates that natural factors which have dampened the global surface warming over the past decade (a preponderance of La Niña events and low solar activity, for example), may continue to have an overall dampening effect over the next 5 years.

Media Confusion About Continued Global Warming

Unfortunately, the Met Office prediction has resulted in quite a few confused articles in the mainstream media.  For example, the Daily Telegraph, Daily Mail, Daily Express, Canada's National Post, the Times, and the Indian Express all incorrectly reported that the Met Office is admitting that global warming has "stalled", or some similar variant.  These headlines are in direct contradiction to the Met Office forecast, which specifically stated:

"The forecast of continued global warming is largely driven by increasing levels of greenhouse gases."

The confusion arises from the fact that the thick blue line in Figure 1 (the central Met Office prediction) does not rise very far above the previous highest global surface temperatures in 2010, 2005, and 1998.  However, by no means does this indicate that global warming has "stalled".

Underlying Human-Caused Surface Warming Continues

As noted above, the Met Office prediction and explanation of their prediction specifically state that while natural short-term influences are dampening the warming of global surface temperatures, the underlying human-caused warming trend nevertheless remains. 

This is beautifully illustrated by a video created by Skeptical Science's Kevin C, with voiceover provided by Daniel Bailey.  The video shows the statistical removal of the short-term warming and cooling influences of volcanic eruptions, solar activity, and El Niño and La Niña events from the global surface temperature record.

The video shows that the global surface temperature record provides no evidence to suggest that human-caused greenhouse warming has slowed.

The Bigger Picture - Ocean Warming

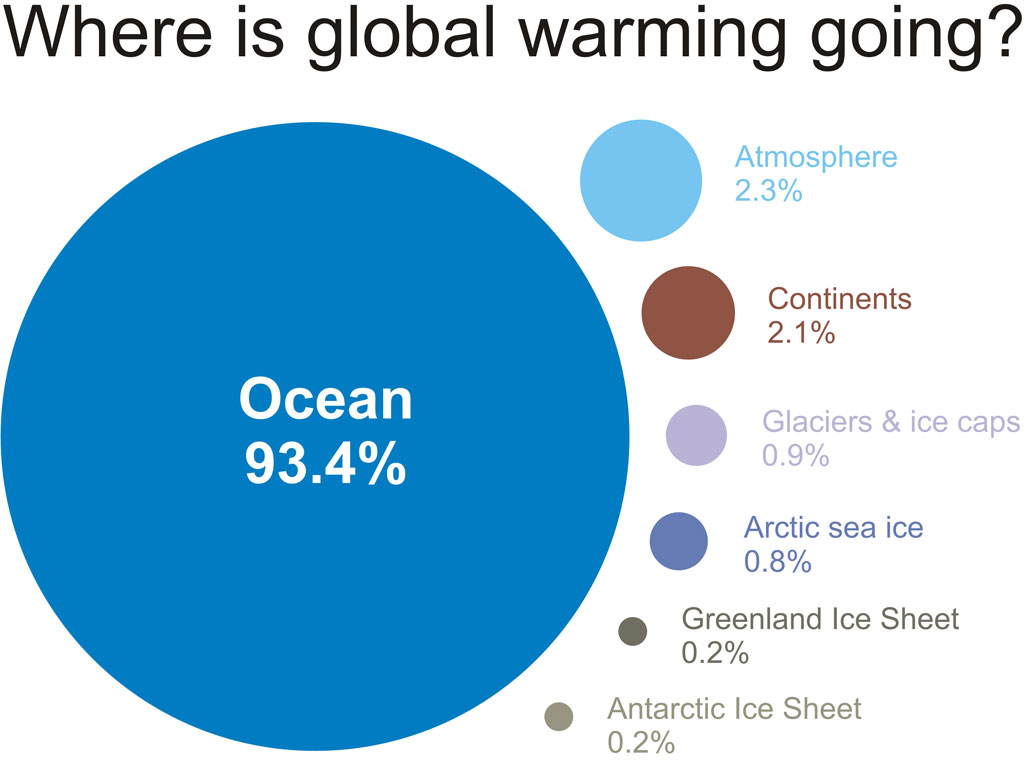
Additionally, global surface temperatures are not an adequate measure of global warming.  In fact, more than 90% of the overall warming of the planet goes into heating the oceans (Figure 2).

where is warming going

Figure 2: Components of  global warming for the period 1993 to 2003 calculated from IPCC AR4 5.2.2.3.

Nuccitelli et al. (2012) considered the warming of the oceans (both shallow and deep), land, atmosphere, and ice, and showed that global warming has not slowed in recent years despite the dampened surface warming trend (Figure 3).
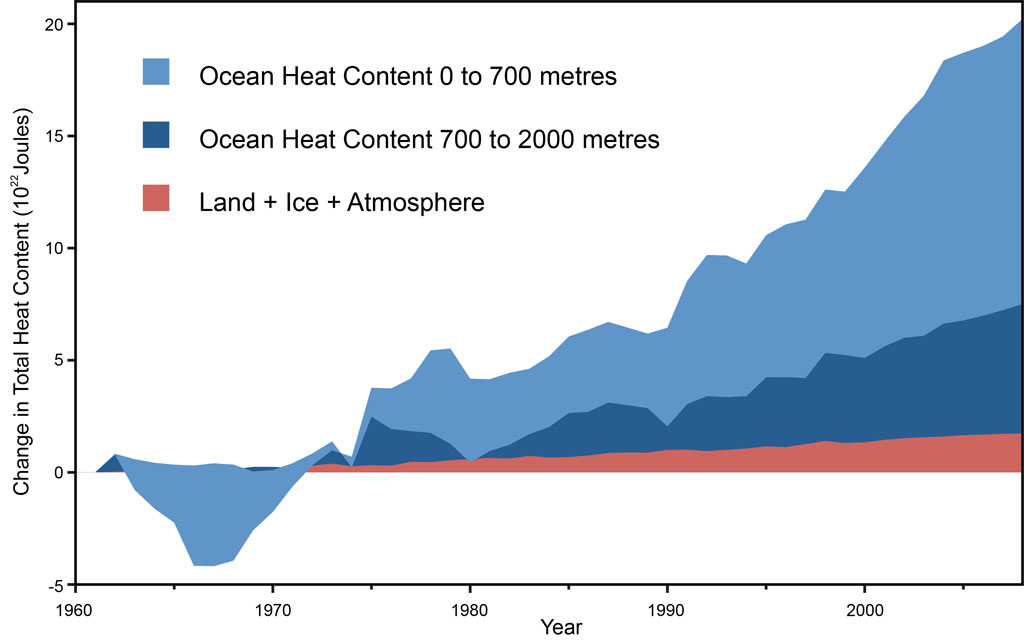
Fig 1Figure 3: Land, atmosphere, and ice heating (red), 0-700 meter OHC increase (light blue), 700-2,000 meter OHC increase (dark blue).  From Nuccitelli et al. (2012).

Picking Cherries, Vintage 1998

Some of the confused media articles also made the mistake of claiming the Met Office prediction indicates a global warming "stall" from 1998 through 2017, because the average 2012—2017 surface temperatures are predicted to exceed the 1998 peak by a small margin.  This is a classic exampe of one of the 5 characteristics of scientific denialism: cherrypicking.  As Professor Myles Allen, Head of the Climate Dynamics Group at the University Of Oxford, explained to the Science Media Centre,

"Comparing the expected temperature for 2013-2017 with a single exceptionally warm year (1998), as some reports have done, is just daft.  1998 was around 0.2 degrees warmer than the 1996-2000 average, largely thanks to a massive, once-a-century El Niño event.  The IPCC predicted a warming of 0.1-0.2 degrees per decade due to human influence back in 2000.  That means the one-off impact of that El Niño event was equivalent to about 20 years of the expected background warming trend So, unsurprisingly, 20 years later, expected temperatures have risen so that an average year is now as warm as that exceptionally hot year."

In fact, even allowing this cherrypick, the global surface temperature trend since 1998 is likely one of warming, which will likely continue to be the case in 2017 even if the Met Office prediction is correct.  Warming is measured through trends, not by comparing cherrypicked individual data points.

Avoiding a False Sense of Security

Although many natural influences have acted to dampen global surface warming over the past decade, and potentially for the next 5 years if the Met Office prediction is correct, allowing this coincidence to lull us into a false sense of security would be a mistake.  Eventually the preponderance of La Niñas will end, solar activity will rise, and so forth.  If we have not reduced human greenhouse gas emissions in the meantime, we will face the harsh reality that the time wasted will force steeper and more painful emissions cuts in the future if we are to avoid dangerous climate change.

Let's get real.  Global warming is (still) happeningHumans are causing it.  If we don't do something to stop it, the consequences are going to be very bad.  So let's stop looking for distractions and excuses to delay action, and get on with solving the problem, before we run out of time.

0 0

Printable Version  |  Link to this page

Comments

1  2  3  Next

Comments 1 to 50 out of 120:

  1. Many good points made by you Dana, so sad that "skeptics" and those in denial continue to intentionally misrepresent the facts. Another day and another myth born in "skeptic" land. I would especially like to second this point made by you: " So let's stop looking for distractions and excuses to delay action, and get on with solving the problem, before we run out of time." Indeed! Just when will the radical "skeptic" elements be able to summon the integrity to stop playing their disingenuous and unethical games? There has to be a little voice somewhere in their head reminding them that doing so is the honorable thing to do..... Their intent will be determined by whether they accept the facts, or if they choose to double down.
    0 0
  2. This is the umpteenth time we've had to debunk media articles arguing that global warming has magically stopped. The only reason to keep making this ridiculous argument is to delay action to solve the problem. Frankly it's irresponsible journalism.
    0 0
  3. Agreed Dana. Certain journalists and media outlets share the responsibility for aiding fake skeptics pursue their agenda, to everyone's detriment in the end. Sadly journalism today is, for the most part, not the honorable profession that it used to be and journalists seem far less concerned with getting the story and facts right than they are in presenting fake balance or fabricating a "controversy".
    0 0
  4. Current lower troposhere temperatures are way above those of the same dates for the previous record year (2010), so we could very well be headed for a new record this year. Will that shut up the deniers? Of course not, as their noise level increases proportionally with their level of desperation. However, the new global record will likely increase the public understanding of the problem. It is thus much better to set that new record in 2013 than during a later year, as the earlier society wakes up, the better. Same goes for Arctic sea ice, etc. We know that the records will be broken in the next coming years, and we know that the public and in turn politicians will not wake up unless the records are broken, so for the possibility of any action being taken to reduce the damage to the climate in the long term, the faster the records break, the better. Will we see a third La Nina in a row instead of a troposhere/surface record? I would not be surprised, but that means even more energy will be stored for a monster year when a Nino finally hits.
    0 0
  5. Is there a quick bullet to shoot this rather hand wavy "analysis" down? Frank Lansner on Foster and Rahmstorf 2011
    0 0
  6. Marking for later reference... guessing it'll go in the upmost quartile. Are they assuming the heat exchage between upper and deeper ocean will prevent el Ninos. They really do not want to be called alarmists.
    0 0
  7. Nick Palmer @5 - is "that's a very shoddy analysis" enough of a bullet? To start with, Lasner's HadCRUT data is outdated (HadCRUT4 shows more recent warming than HadCRUT3 did). Second he criticizes the use of TSI (for no apparent reason), but if he'd read the paper, he would know Foster and Rahmstorf also did the anlysis using sunspot number, with no significant change to the results. Lasner also suggests using solar factors which have little if any impact on the climate, like cosmic rays, instead of using the solar factor with a direct impact on global temps - TSI. It also appears that Lasner is trying to remove the individual short-term influences one-by-one, which is a statistical no-no. You have to use multiple linear regression to fit the variables to the data all at once. Long story short, Lasner has no idea what he's doing. And if he has a criticism of the paper, he should submit it as a comment and subject it to the peer-review process (which it would not pass, because as noted above, he doesn't know what he's doing).
    0 0
  8. Wasn't Nuccitelli et al. (2012) debunked? Can you give me the source for figure 3?
    0 0
  9. Clyde: If you define "debunked" as "reasserting the original claim", then maybe. Nuccitelli et al is a comment on a paper by Douglass and Knox, and the "debunk" you point to is Douglass and Knox' reply. They make three points: - they are sticking to their guns about their imagined "climate shifts" analysis. - they don't like the data used by Nuccitelli et al, and still want to use the noise instead of the signal, - they don't like Nuccitelli et al's interpetation of some CO2 feedback issues. The executive summary of this "debunk" is pretty much "you can't make us change our minds". As for figure 3's source - the caption says "From Nuccitelli et al (2012)". It looks exactly like figure 1 in my copy of that paper. Have you not read Nuccitelli et al (2012)? Perhaps you are commenting on something that you haven't actually read?
    0 0
  10. Clyde @8 - no, Nuccitelli et al. (2012) was responded to, quite poorly at that, but certainly not 'debunked'. In fact Douglass & Knox did not dispute most of the points in our paper in their response, particularly our main conclusions. They mostly continued to argue that 'climate shifts' really do exist. But they didn't dispute our heat content data or the associated figure.
    0 0
  11. clyde@8, I think "attempted refutation" is the term you are looking for. Debunk does not mean what you seem to think it means. This thread does, however, try and debunk myths and memes promulgated by fake skeptics surrounding the UK Met Office's experimental forecast. As Bob has noted @9, all Douglass and Knox's reply to Nuccitelli et al (2012) demonstrated is that they were doubling down and not open to considering data and methods that challenge their misguided ideas (e.g., climate shifts). Regardless, of what DK might believe, it does not affect the reality of the actual data ahown in Figs. 1-3 in the post.
    0 0
  12. As Bob @9 notes, Figure 3 in this post is Figure 1 in Nuccitelli et al., whose OHC data come from Levitus and land ocean atmosphere heating data come from Church (referenced in the paper, linked in the figure caption). Coincidentally, Levitus thought our paper was quite good (and Church was one of our co-authors). As for 'climate shifts', that's basically what Douglass & Knox call any little bit of noise in the data. But that's off topic here, so I won't delve into it. We considered responding to their response, but it had so many problems that we got bogged down in the details, and ultimately decided it wasn't worth the effort.
    0 0
  13. The MET office have just issued a smackdown of James Dellingbole's very poor article about this in the Telegraph. It is well worth reading.
    0 0
  14. I added the trend line of the average of the three data sets (1970 to nov. 2012) with a photo-editor to the MET Office image and extrapolated it to 2020. See this link. The slope is 0.16 °C/decade. I can't see any stalling, the blue line is close to the trend line.
    0 0
  15. Re Cornelius' pointer to the Met Office comprehensive correction of James Delingpole, would surely be nice to see that cross-posted here.
    0 0
  16. The obvious misdirection from Delingpole is suggesting the new prediction predicts "no more global warming til at least 2017", when in fact the new prediction predicts record breaking warmth in 2015 and 2016. A prediction of new records is not "no more global warming". More subtly, based on digitizing the graph, the trend from 1996-2017 inclusive (0.097 C per decade) is nearly double the the sixteen year trend from December 1996 (1996.92) to November 2012 (2012.83) (0.053 +/- 0.125 C per decade). Deniers have been claiming the later is "no warming in sixteen years" because it is not statistically distinguishable from a trend of zero (or from IPCC projections). However, with an additional five years, and nearly double the trend, the claim of statistical insignificance is highly dubious. I can't do the maths, but the HadCRUT4 trend from August 1964 (1964.58) to July 1986 (1986.5) is also 0.097 C per decade, with an error range of +/- 0.085 C per decade, making it clearly statistically significant. It is very likely the equivalent predicted trend is also statistically significant. So, when you come right down to it, the deniers are claiming prediction predicts "no more global warming" when it predicts: * Near double the trend; * New global temperature records in two out of five years; and * A warming trend that is statistically significant. Little could better demonstrate their intellectual bankruptcy!
    0 0
  17. Clyde @8, the paper you link to does not debunk the data from Nuccitelli et al, 2012. It attempts unsuccessfully to debunk the relevance of that data to the argument made by Douglas and Knox in "Ocean heat content and Earthʼs radiation imbalance. II. Relation to climate shifts", but that attempt, even if it were successful would not call the heat content data into question.
    0 0
  18. Dana @7 Thanks. I'm not confident enough with statistics at a high enough level to criticise it myself. Noted your points about TSI and sunspots but don't some of the smarter sceptics rather claim that it is the Sun's magnetic activity that is responsible for the "anything but CO2" beef nowadays?
    0 0
  19. Nick Palmer @18 - I wouldn't necessarily say smarter, but some contrarians try to blame global warming on galactic cosmic rays, whose quantity reaching Earth is determined by the strength of the solar magnetic field. I addressed that myth here.
    0 0
  20. Addendum to my post @16: I have since learnt that the Met Office used HadCRUT3 rather than HadCRUT4 as the basis of the predictions. That means my results will need revising, although the basic points should still stand. It also means that the fastest warming part of the Earth (the Arctic) is essentially excluded from the prediction, meaning the prediction is biased low.
    0 0
  21. I'd also like to suggest that the Met Office's latest fisking of the egregious Delingpole is worth re-posting.
    0 0
  22. In the comments to the Met. Office rebuttal linked to above, rwtravels (18:37:26) links to the clip of Paul Nurse getting Delingpole in a state of confusion. Delingpole apparently does not read published papers, but rather "interprets the interpretations". Sounds very sciency to me.
    0 0
  23. The global surface temperature has flat lined over the past 10 years and if you don't believe me, look at the data for yourself. There is nothing wrong with reporting that the global surface temperature has flat lined for the past 10 years.
    0 0
  24. smerby, it depends on the context in which you say it. If you are saying it publicly and in the context of trying to say that global warming has stopped, you're misrepresenting the science and misinforming the public on a serious issue. If you say it amongst a group of climate scientists, they'll say, "what's your point? Ten year trends are meaningless where climate is concerned." Note that the trend from 2000-2011 (Had4) is .102C per decade. That's hardly a flatline. It's about 24x the warming of the PETM event rate. The trend moved up just one year is slightly negative. What's the point?
    0 0
  25. Hello DSL I am talking about the trend for the past 10 years. It would be a breath of fresh air to see these true facts reported in the mainstream news. If a mainstream news agency came out and reported that global temperatures have flatlined over the past years, they would be telling the truth. There is nothing wrong with giving people indisputable facts.
    0 0
  26. smerby, why would they do it? Again, what would be the point of saying that one surface temp analysis had flatlined over the past ten years? What would be the meaning? What does it mean to you? Do you find value in it in some way? Does it tell you something about climate? What do you think the mainstream public will think if they read such a headline?
    0 0
  27. Of course, I'd be ok with it if I thought that opinion-makers like the Daily Mail would point out alongside that the other 95% of the thermal capacity of the Earth had not at all shown the same "hiatus" period, but what's the chance of that? Would they also point out that global ice mass loss had accelerated dduring the past ten years? If the fact has no meaning, and the overwhelming likelihood is that it will be misinterpreted, why make the choice to publish it?
    0 0
  28. I am looking at these multiple sources of global temperatures and they are not indicating warming. They are flat lining. Image and video hosting by TinyPic
    0 0
    Moderator Response: [RH] Fixed image width
  29. What does that graph tell you, smerby? Has global warming stopped?
    0 0
  30. Global surface temperature warming has stopped. The graphs show that. It would be nice to see that reported in the main stream media.
    0 0
  31. Bob Loblaw - 9 As for figure 3's source - the caption says "From Nuccitelli et al (2012)". It looks exactly like figure 1 in my copy of that paper. Have you not read Nuccitelli et al (2012)? Perhaps you are commenting on something that you haven't actually read? I haven't read the paper. You have to pay to read it. I'm not into GW enough to pay to read something. Seeing it looks like your figure 1 perhaps you can tell me where you got your data? I'm wanting the source for for the ocean data. Is it from NASA, JPL, NOAA, etc ? Somebody used data from 1960 forward. I'm not saying it's wrong, just need to be able to say source "X" says Ocean Heat Content in 1960 was "Y" & has risen to "Z" in 2010. P.S. I forgot to ask how you are doing...How are you doing Bob? dana1981 - 12 As Bob @9 notes, Figure 3 in this post is Figure 1 in Nuccitelli et al., whose OHC data come from Levitus and land ocean atmosphere heating data come from Church (referenced in the paper, linked in the figure caption). Coincidentally, Levitus thought our paper was quite good (and Church was one of our co-authors). I'm wanting the source for for the ocean data. Is it from NASA, JPL, NOAA, etc? Somebody used data from 1960 forward. I'm not saying it's wrong, just need to be able to say source "X" says Ocean Heat Content in 1960 was "Y" & has risen to "Z" in 2010. Does Levitus or Church say where they got it from?
    0 0
  32. smerby, how many people reading such a claim would assume that surface = system? Again, if you want to do something with your feet on solid ethical ground, make sure you think it through completely. I'll bet you a bottle of beer that such a claim would lead to the general public perception that global warming has stopped. And it would be flat dead wrong. See figure 3 in the article above. People would act on that belief, and the writer and publisher would share some of the responsibility.
    0 0
  33. It would be nice to see a news source show a global temperature graph since the late 1800s and point out that although the overall trend is up, there have been 2 previous periods where surface global warming has stopped and we are now in a period where global surface temperatures have not warmed for the past 10 years. Thats all just the facts.
    0 0
  34. smerby... There are some other facts that you should become familiar with. GISS Trend: -0.007 ±0.244 °C/decade (2σ) NOAA Trend: -0.044 ±0.223 °C/decade (2σ) HadCRU4 Trend: -0.048 ±0.219 °C/decade (2σ) If you look at each of these trends the confidence range (2σ) exceeds the trend by a very wide margin. What you're calling "no surface warming" is more likely to be noise in the data.
    0 0
  35. @Rob Honeycutt. Oh the temperature records are unreliable? I didn't know that. Looking at the skepticalscience.com/trend.php calculator, it could be that the earth has been cooling since 1995, since that's the last time that the lower error bar on all temperature records is above freezing, even earlier for some. What are scientists doing to improve the reliability of temperature records? If they can't even measure surface temperatures correctly, how much reliance can we place on things which are way more complex to measure e.g. land ice volume?
    0 0
  36. Correction, it's 1993 when all 4 dataset provider's lower error bars are above zero. 1995 is when 1 dataset provider's lower error bar is above zero. So it is possible that global warming ended 20 years ago, and the Met Office are predicting another 5 years of no warming, making 25 years of no warming at that point. At what point can we definitely say that anthropogenic global warming is disproven? 30, 50, 100 years?
    0 0
  37. Lilly... That's not what I said. The implication of a low confidence interval is that the trend for only a 10 year period has a very low statistical chance of telling you what the underlying trend actually is.
    0 0
  38. Lilly... If you go back to 1993 you actually get a very strong confidence level. GISS Trend: 0.167 ±0.101 °C/decade (2σ) That's well past the 95% confidence level for the trend being 0.167C per decade. So, I have no idea what you're talking about.
    0 0
  39. Lilly... Your statements here are rather nonsensical. You're clearly confusing statistical confidence level (a measure of the reliability of the trend) with the reliability of surface station measurements. These are two completely different and unrelated issues.
    0 0
  40. smerby #33, How can global warming have stopped when well over half of the "Top 10" warmest ever years have occurred since 2000? 2010 was in the Top 2 warmest ever in all the records. It would be a big mistake to hang such sweeping conclusions on a weak statistical argument. And if "global warming has stopped", why are we wasting time before it inevitably starts again?
    0 0
  41. Rob @ 38 It's well past the confidence interval for the trend being positive, and suggests that the actual trend is between 0.066 and 0.268 C/dec with more central values being more likely.
    0 0
  42. Here we are again with the BS. Smerby leads the charge. How many times were there 10 years periods during which temp flatlined in the record? Many, who cares? There were even some 10 years periods during which temp decreased. Once again, who cares? Right now we are in a La Nina dominated period with low solar activity yet we can't seem to get anywhere near the average temps of the 90s. Wonder why that is. Sheesh...
    0 0
  43. lillybutter84 #36, If "global warming ended 20 years ago" then how come 2010 was the warmest year ever in many records? You are not making much sense. Are you saying that the earth's TOA radiation has come into equilibrium with the input from that sun? That is the only circumstance that would lead to a stop in global warming. In the input is still > output, then where is the extra energy going? (Answer: Into the ocean, from which it will return).
    0 0
  44. lillybutter84 at 17:12 PM on 11 January, 2013
    At what point can we definitely say that anthropogenic global warming is disproven? 30, 50, 100 years?
    I'll take the question as genuine, and give you the answer: The question is ill-posed. i.e. You're asking the wrong question. If we pose the question correctly, then the answer becomes obvious: Q: At what point does the surface temperature record falsify the consensus understanding of climate science? A: At the point where the consensus understanding of climate science can no longer explain the features of the temperature record to within the uncertainty bounds inherent in that understanding. If you watch the video you will see that the temperature record is very well explained by a linear trend, volcanic and solar terms and ENSO. You can get a similar result over the entire 130 year record using radiative forcing in a 2-box + ENSO model (~20 lines of code). There is currently no discrepancy which can't be explained by our current knowledge of the system. At the moment the issue is an illusion created by the media failing to explain the science and disinformation sources trying to obscure it.
    0 0
  45. I'm not convinced that this article - though factual correct - will help to "resolve confusion". The problem here as I can see it is the strong(?) visual difference between the Dec 2011 and Dec 2012 graph and everywhere else both graphs are shown, while SkS shows in Fig. 1 just the Dec 2012 graph. Without a very detailed discussion about the datasets, the models, the statistical methods and whatnot used for both graphs a layman will be misguided in his interpretation by view - for sure.
    0 0
  46. lillybutter84 at 17:08 PM on 11 January, 2013
    Oh the temperature records are unreliable? I didn't know that. Looking at the skepticalscience.com/trend.php calculator, it could be that the earth has been cooling since 1995, since that's the last time that the lower error bar on all temperature records is above freezing, even earlier for some. What are scientists doing to improve the reliability of temperature records?
    This question arises from a misunderstanding of the nature of statistical uncertainty. The uncertainty in the trend is not dominated by uncertainty in the observations. The uncertainty in the global surface temperature is small compared to the uncertainty in the trend (although there is the issue of bias, but we can't go on to that until you have understood this first point). The vast bulk of the uncertainty in the trend arises from the fact that the underlying process isn't linear - it contains other signals apart from the trend, i.e. short term natural influences. If you go to the F&R version of the trend calculator here, which has those short term influences removed, you will see that even the old HadCRUT3 data shows a statistically significant trend on the 10 year period 2001-2011.
    0 0
  47. Smerby and Lillybutter84 really do not grok the concepts of signal and noise. Perhaps something might click if they read this and consider this: Or perhaps not...
    0 0
  48. The MET Office predicted temperatures in 2017 in the range 0.0.28 to 0.59 C above the average. Should 2017 have a strong El Nino like 1998 then the expected temperature is going to be at the top of the range; 0.59 C. The possibility of events like El Nino are why they provide a range. The top of the 2017 range is 0.19 C above the 1998 temperature. No one could possibly interpret that as a lack of surface warming.
    0 0
  49. Are there any years in the entire global temp anomaly record (1880 - 2012) where it would not be true to say, 'There has been no statistically significant warming for the past 10 years.'? Seriously, it seems like a 'true', but almost completely meaningless statement. 'The grass in my yard has shown no statistically significant growth in the last 10 seconds. Clearly grass no longer grows!' How can denialbots get themselves worked up over such idiotic tripe?
    0 0
  50. CBDunkerson at #49. Frustratingly I've left the USB with my file containing the data at work, and I'm not about to redo the whole exercise, but from a causal perusal of my quick graph above I'd say that for the GISTemp data the answer is "No". If any year was going to emerge with an answer to the contrary I'm pretty sure that it would occur within the range of that graph. If a more accurate analysis confirms this, then Smerby will always be on statistical quicksand with his "we are now in a period where global surface temperatures have not warmed for the past 10 years", as we are always in a period where global surface temperatures have not warmed at the 95% confidence level for at least the past 10 years. The claim that there has been no recent warming is nothing more than a trick to close the curtains sufficiently that the signal is hidden in the noise.
    0 0

1  2  3  Next

You need to be logged in to post a comment. Login via the left margin or if you're new, register here.


The Consensus Project Website

THE ESCALATOR

(free to republish)


© Copyright 2025 John Cook
Home | Translations | About Us | Privacy | Contact Us