">

Climate Science Glossary

Term Lookup

Enter a term in the search box to find its definition.

Settings

Use the controls in the far right panel to increase or decrease the number of terms automatically displayed (or to completely turn that feature off).

Term Lookup

Settings


All IPCC definitions taken from Climate Change 2007: The Physical Science Basis. Working Group I Contribution to the Fourth Assessment Report of the Intergovernmental Panel on Climate Change, Annex I, Glossary, pp. 941-954. Cambridge University Press.

Home Arguments Software Resources Comments The Consensus Project Translations About Support

Twitter Facebook YouTube Mastodon MeWe

RSS Posts RSS Comments Email Subscribe


Climate's changed before
It's the sun
It's not bad
There is no consensus
It's cooling
Models are unreliable
Temp record is unreliable
Animals and plants can adapt
It hasn't warmed since 1998
Antarctica is gaining ice
View All Arguments...


Username
Password
New? Register here
Forgot your password?

Latest Posts

Archives

Is the long-term trend in CO2 caused by warming of the oceans?

What the science says...

Hocker is claiming that his model shows that the long-term upward trend in CO2 is explained by temperature, when his methods actually removed the long-term trend. In today's world, the greatly increased partial pressure of CO2 from fossil fuel emissions causes a flux of CO2 from the atmosphere to the oceans. Observations show the oceans are a "sink" rather than a source of CO2 in the atmosphere

Climate Myth...

Warming causes CO2 rise

'Differentiating the CO2 measurements over the last thirty years produces a pattern that matches the temperature anomaly measured by satellites in extreme detail.    That this correlation includes El Niño years, and shows that the temperature rise is causing the rise in CO2, rather than the other way around.' (Lon Hocker)

A new article by Lon Hocker at the website "Watts Up With That?" examines the relationship between global temperature and CO2 over the last three decades.  The article's conclusion is concisely summarised in its title:  The temperature rise has caused the CO2 increase, not the other way around. This conclusion would be rather startling if it were true, since the scientific consensus is that CO2 is currently acting as a "forcing" that warms the climate.  How does Hocker reach this conclusion, and is it reasonable?

The data used in Hocker's analysis are monthly atmospheric CO2 measurements at Mauna Loa (obtained from NOAA) and satellite-measured temperature data for the lower troposphere (from UAH, apparently using a subset of the global data over the oceans only).  The temperature data are recorded as anomalies, or differences between the actual temperature and the long-term mean. 

The Mauna Loa CO2 data show a long-term increase in atmospheric CO2 concentration.  The Mauna Loa data are the longest high-quality CO2 record, dating back to 1958.  While one might think that the side of a volcano might not be the best place to measure CO2, in fact the procedures used at Mauna Loa compensate for any contamination by volcanic gases.  As shown in Figure 1, since 1980 we have had global CO2 data from a network of stations, and these data show that the Mauna Loa trend is very representative of the global trend in CO2.


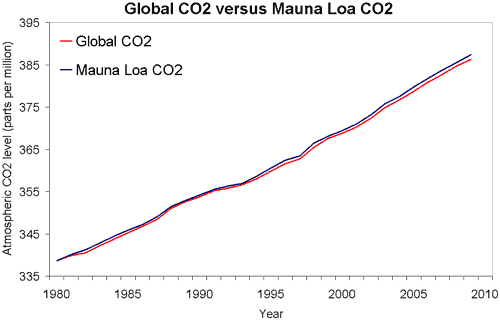
 Figure 1: Global atmospheric CO2 (NOAA) versus Mauna Loa CO2 (NOAA).

Hocker begins his analysis by calculating the first derivative of the CO2 data.  He does this using the difference between the CO2 measurement six months after a given month and the measurement six months before.  (Calculating this difference over a 12-month interval effectively removes the seasonal variation in atmospheric CO2 concentration.)

At this point, alert readers may begin to glimpse the flaw in Hocker's methods.  However, let's follow Hocker through to his conclusion. 

He derives a simple model to estimate the temperature anomaly as a function of the derivative of CO2 concentration:

 Temperature Anomaly = (CO2[n+6] – CO2[n-6])/(12*0.22) – 0.58

 Hocker's Figure 2 shows a comparison of the observed and modeled global ocean temperature anomaly:

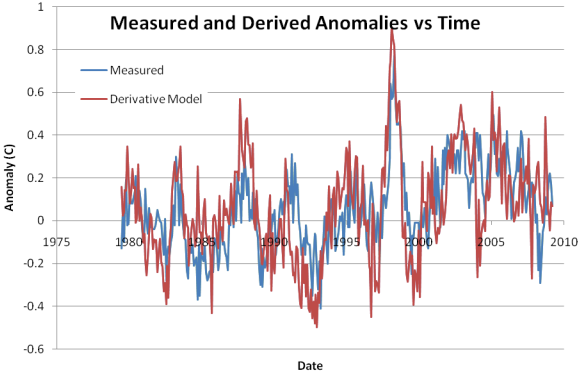
Figure 2.  Comparison of global lower troposphere temperature anomaly over the oceans (blue line) to a model based on the first derivative of atmospheric CO2 concentration at Mauna Loa (red line).  From Hocker 2010.

Looking at this figure, Hocker notes "There is a strong correlation between the measured anomaly and the Derivative model.  It shows the strong El Niño of 1997-1998 very clearly, and also shows the other El Niño events during the plotted time period about as well as the satellite data does."  He does not quantify the correlation between the two, but the squared correlation coefficient (r2) for the two time series is 0.36.

Let's pause here to consider the actual effect of Hocker's methods to this point.  Taking the first derivative of the CO2 data removes the long-term trend in CO2 concentration, and shows the effect of short-term variability around that trend.  Thus, it would be appropriate to conclude from this that short-term fluctuations in the overall upward CO2 trend are moderately well correlated with temperatures in the lower troposphere over oceans.

What Hocker actually concludes is quite different:  "Using two well accepted data sets, a simple model can be used to show that the rise in CO2 is a result of the temperature anomaly, not the other way around.  This is the exact opposite of the IPCC model that claims that rising CO2 causes the temperature anomaly." 

In other words, Hocker is claiming that his model shows that the long-term upward trend in CO2 is explained by temperature, when his methods actually removed the long-term trend.

This is where the previously-mentioned alert readers will be nodding their heads and saying "Yes!  We knew it!"  The error that Hocker makes - taking the derivative of a time series to remove its long-term trend, then correlating a second data set with this derivative, and finally claiming the second data set explains the long-term trend - is exactly the same error that was recently discovered in a prominent "skeptical" paper by McLean 2009.  McLean correlated an index of the El Niño/Southern Oscillation with the first derivative of temperature, while Hocker correlates temperature with the first derivative of CO2 concentration.  Perhaps if Hocker were an avid reader of Skeptical Science, he would have been familiar with this error in McLean's analysis and would have avoided repeating it!

What else can be said about this subject?  Well, it is true that the solubility of CO2 in seawater is a function of temperature, and all else being equal, as the ocean warms it will give off CO2 to the atmosphere.  And in fact this is the mechanism by which a CO2 feedback amplified the temperature swings during the Pleistocene glacial/interglacial cycles.  But in today's world, the greatly increased partial pressure of CO2 from fossil fuel emissions causes a flux of CO2 from the atmosphere to the oceans.  This is known from decades of oceanographic surveys that show the oceans are a "sink" rather than a source of CO2 in the atmosphere (Takahashi 2009, Sabine 2004).

It's also interesting to note that climate scientists have known for at least three decades that short-term fluctuations in temperature (e.g., those associated with the ENSO cycle) are correlated with short-term fluctuations in the rate of increase of atmospheric CO2 (Bacastow and Keeling 1981).  Section 7.3.2.4 of the IPCC AR4 Working Group 1 report discusses this in some detail.

Intermediate rebuttal written by ned


Update July 2015:

Here is a related lecture-video from Denial101x - Making Sense of Climate Science Denial

Last updated on 13 July 2015 by pattimer. View Archives

Printable Version  |  Offline PDF Version  |  Link to this page

Argument Feedback

Please use this form to let us know about suggested updates to this rebuttal.

Comments

1  2  Next

Comments 1 to 25 out of 33:

  1. I find it funny that we debate with such emotion over the weather. Determining whether or not human activity is the cause for global warming is also funny. Theoretically we evolved from the Earth and if considered part of the earth, then the Earth's activity causes global warming. If we want to know if anything is unusual then shouldn't we plot the data from ice-core samples in a computer and find out if the derivative of CO2 production in the last 50 years is unusual? From the data that I have seen, I would assume that we are on a cycle that has existed for the last 400,000 years. Ultimately, we should just prepare for the effects of climate change.
  2. Whilst the Mauna Loa CO2 seasonal variation of about 5ppm is not only remarkably consistent and of such resolution that the approximate 2ppm annual increase can be seen, the seasonal variations measured in other various parts of the world are by comparison quite large and vary considerably from region to region. This study,http://www.atmos-chem-phys.net/8/7239/2008/acp-8-7239-2008.pdf provides data from 16 continuously monitored sites where typically the seasonal CO2 variation ranges from 350/360ppm to 390ppm, with one site, Heidelberg Germany typically 370ppm to perhaps 420ppm, (it goes off the scale). With standard deviations of generally 4-6ppm, seasonal variations of these magnitudes must make it extremely difficult to be sure that the annual global increase of perhaps 2ppm is being accurately isolated. Only a small variation in the conditions that drive the natural processes of the innumerable sources and sinks could easily eclipse the relatively small increase especially since many of those processes are not yet fully understood, let alone able to be accurately quantified.
  3. johnd at 19:04 PM on 25 August, 2010 Are you suggesting the CO2 trends, as independently monitored by multiple stations world wide, are in doubt? See Global CO2 data, and SCHIAMACHY independent satellite derived CO2 trends and seasonal variations (which corroborate the Mauna Loa data), and the NOAA ESRL trends website. The derivative method Hocker uses does reveal de-trended changes in atmospheric CO2 with seasonal variations removed, and these are interesting in terms of primarily land based sources and sinks (I will comment further or post in detail at some point) but these variations are a few ppm and swamped by both natural seasonal variations and the very well defined significant trend from long term anthropogenic emissions.
  4. johnd: I guess I'm not clear about what you're suggesting. Are you saying that the observed rise in CO2 might not be anthropogenic? Or that we don't have to worry about it because perhaps natural sinks will suddenly change their behavior and start soaking up a lot more CO2?
  5. #2:"seasonal variations of these magnitudes must make it extremely difficult to be sure that the annual global increase of perhaps 2ppm is being accurately isolated. " I disagree. Seasonal amplitude is not the same as year-to-year rate of increase. Look from year to year at successive peaks and troughs and you find consistency in the annual growth rate. I've done this with several arctic stations where the seasonal amplitude is as high as 15ppm; what was 1-1.5 ppm in the '70s is now 2-2.25 ppm. And that rise matches the growth in CO2 emissions from fossil fuel use quite well.
  6. 3 to 5 above, whilst the Mauna Loa CO2 indicates a consistent nett change both seasonally and long term for what occurs in both hemispheres, it provides no understanding of any of the processes that determine those nett variations. It has been given some value solely because it happens to match somewhat with global temperatures, but even there it didn't do so well with the cooling period from about 1960 diverging from the constant upward trend. The magnitude of the nett increase of CO2 being about half of the estimated total emissions from fossil fuels, is very small against both the emissions and the sinks that occur naturally, so a very small error in the estimations and modeling of those natural processes could lead to the wrong conclusions being drawn. The study I referred to earlier that measured how the CO2 varied not only in different regions, but seasonally shows that natural processes are able to reduce CO2 concentrations in the atmosphere by a factor about 10 times the rate that fossil fuels add CO2 to it, therefore the capacity is there within the natural system when the conditions are right. Whilst we might be able to make estimations and construct models that approximate what the nett results appear to be, that is far from being able to lay claim that each and every one of those processes is understood sufficiently to be sure that the values shown in the chart below and measured in hundreds are accurate to small single digit figures.
  7. #6:"It has been given some value solely because it happens to match somewhat with global temperatures" What? Given some value? There are multiple agencies responsible for these measurements; they all seem to agree. And please, do not say "Conspiracy!" "magnitude of the nett increase of CO2 being about half of the estimated total emissions from fossil fuels, is very small against both the emissions and the sinks that occur naturally," Well, no. You can take the world annual CO2 emissions from all fossil fuels (EIA.gov is a good place for such statistics) and match it to the annual increase in atmospheric CO2 pretty well. All you need do is convert Gtons CO2 at the surface to ppmV distributed in the atmosphere; there are several places that give that conversion. Then calculate that 39 Gtons CO2 (2009) is about 4ppmV during a year when CO2 went up by 2 ppmV; that means that half of anthropogenic (yes, that bad word) CO2 is absorbed by all sinks and the other half is still out there. I posted a graphic a couple of weeks ago demonstrating this on some prior thread; I'll have to go looking for it.
  8. johnd writes: The magnitude of the nett increase of CO2 being about half of the estimated total emissions from fossil fuels, is very small against both the emissions and the sinks that occur naturally, so a very small error in the estimations and modeling of those natural processes could lead to the wrong conclusions being drawn. Think about this logically for a second. We know with a great deal of confidence how much carbon we're emitting. We also know with a great deal of confidence the magnitude of the increase in atmospheric CO2 over time. By subtracting the former from the latter, we can determine the net effect of all natural sinks and sources with a similarly high level of confidence. Let's say you look at your bank account. You've got various sources of income and expenses. You don't necessarily keep detailed track of them all. However, you do know two things: (1) You've recently added a new and highly quantifiable monthly expense (perhaps payments on a car you couldn't really afford). You know that every month X dollars are being taken out of your account to pay for this new expense. (2) Your monthly statement shows you that, over time, the bottom line on your account is dropping by X/2. At this point, you don't need to sit down and look at every ATM receipt. It's straightforward to conclude that, first, the decline in your account balance is due to the new car payments, and second, if this goes on long enough you'll be in trouble. Of course, it's always helpful to understand your budget in more detail, and the same applies to the Earth system! But uncertainty about some of the details doesn't prevent us from drawing conclusions about the things we do know.
  9. muoncounter at 11:25 AM, you confuse me with your "Well, no" because you immediately agree exactly. The only thing perhaps is that instead of the other half being out there, what is out there is an amount equivalent to the other half.
  10. johnd writes: The only thing perhaps is that instead of the other half being out there, what is out there is an amount equivalent to the other half. I fail to see any meaningful distinction here. We add X molecules of CO2 to the atmosphere. After a lot of interactions with various sinks and sources, the atmosphere has X/2 additional molecules of CO2. Because of all the interactions along the way, the actual molecules making up the X/2 increase might not be the exact same individual molecules emitted from our coal-fired power plants. But without those emissions the X/2 increase would not exist. This seems very obvious to me, so I hope that you have some deeper meaning that I'm simply not getting ....
  11. Ned at 19:58 PM, uncertainty of the global fossil fuel CO2 emissions estimate is about plus/minus 6% though those of individual countries could be several times that. If an equivalent of about half of the emissions are added to the atmosphere, that uncertain amount equates to plus/minus 12% of the amount being added. So even there is a small example of how the margin of uncertainty can quickly become significant. The quantities of CO2 flowing through the sources and sinks are substantially larger, so the estimates made there either have to be done to a substantially higher degree of accuracy than that of estimating emissions or the margin of errors will be of such magnitude that the 2ppm becomes meaningless. Your analogy of the bank account is a good one for me to make my point. You appear willing to accept that as long the month end balance changes an amount that you have noted bears some relationship to the payments you make on that car you can't afford, then you assume that everything else must be okay, nothing is changing the status quo. That may be OK for a wage earner whose only interest, and asset, is the car. However, if running a business with a large turnover, with many financial sources and sinks, competent management will want to know whether a consistent month end balance comes about because turnover is consistent month in, month out, or is it because expenses are varying in concert with an income that varies for any number of reasons. In other words, do the natural processes that drive the sources and sinks for CO2 follow a similar pattern as what occurs in business where the expenses, sinks, always seem to rise, or fall, just enough to consume all the income, sources, that becomes available? Thinking of all the promises just made in the Australian election, the government budget would perhaps have been a better analogy to use. Doesn't matter what scenario eventuates they claim there will be a surplus of a nominated magnitude.
  12. Ned at 21:19 PM , it is not enough to claim that because two measurements move in concert they must be connected when there are bigger and equally relevant processes involved that are not adequately understood or quantified. I just don't want to assume it is not coincidental, the mechanisms have to be identified.
  13. Ned at 21:19 PM, re "But without those emissions the X/2 increase would not exist." What do you have to support that claim? Are you claiming that without current emissions CO2 levels would instead be declining by X/2?
  14. johnd writes: The quantities of CO2 flowing through the sources and sinks are substantially larger, so the estimates made there either have to be done to a substantially higher degree of accuracy than that of estimating emissions or the margin of errors will be of such magnitude that the 2ppm becomes meaningless. Why? The 2ppm increase is an observed fact, it's not a guesstimate or a modeled output based on shaky ideas about individual sinks and sources. We know how much is accumulating in the atmosphere, with a very high degree of confidence. The uncertainty in emissions is also small in proportion to the atmospheric increase. Again, the long-term increases in both emissions and atmospheric concentration are remarkably consistent. There are small fluctuations in the rate of increase associated with, e.g., changes from El Nino to La Nina. But those are small fluctuations around a consistent exponential rise. johnd continues: it is not enough to claim that because two measurements move in concert they must be connected when there are bigger and equally relevant processes involved that are not adequately understood or quantified. I just don't want to assume it is not coincidental, the mechanisms have to be identified. Oh, come on! The mechanism is obvious! We burn fossil fuels, producing CO2. The CO2 goes into the atmosphere. We measure an increase in CO2 in the atmosphere. What could possibly be plainer than that? I'll take Occam's Razor, thanks. It seems exceptionally irrational to reject a simple and straightforward explanation in favor of a complicated, improbable, and poorly understood one. The anthropogenic origin of the observed rise in CO2 is one of the clearest, most obvious physical facts in earth system science. If you're determined to object to AGW, wouldn't it at least make more sense to ground that objection somewhere else?
  15. johnd writes: Ned at 21:19 PM, re "But without those emissions the X/2 increase would not exist." What do you have to support that claim? I've given a simple and obvious explanation. If you want to claim that there's no connection between our addition of CO2 to the atmosphere and the observed increasing CO2 in the atmosphere, you need to explain that claim. It would be an extremely unintuitive situation, so you really need to provide an extremely convincing explanation. johnd continues: Are you claiming that without current emissions CO2 levels would instead be declining by X/2? No. CO2 levels would probably be basically stable, with the ocean, atmosphere, and biosphere close to an equilibrium. They would certainly not suddenly have risen 112 ppmv in the past century! Figure 1: CO2 levels (parts per million) over the past 10,000 years. Blue line from Taylor Dome ice cores (NOAA). Green line from Law Dome ice core (CDIAC). Red line from direct measurements at Mauna Loa, Hawaii (NOAA).
  16. johnd - I'd like to point out that your comment about atmospheric increases and "what is out there is an amount equivalent to the other half", but not caused by our emissions, requires a lot of belief statements. It requires us first to not believe that our CO2 emissions are affecting the atmosphere, while postulating some other, unknown cause that is simultaneously increasing at 2ppm/year. Your claims of uncertainties (what, +/-6% uncertainty from economic estimates as to CO2 going into the atmosphere) are really quite small, considering the multiple decade record showing a consistent increase. Between Occams razor and basic substance conservation (what goes in comes out), it's pretty clear that our CO2 emissions are directly increasing the atmospheric CO2 levels.
  17. KR writes: Between Occams razor and basic substance conservation (what goes in comes out), it's pretty clear that our CO2 emissions are directly increasing the atmospheric CO2 levels. Yes, exactly. If johnd still disagrees with this, it would probably be helpful if he could provide a clear, concise statement of his argument. A simple version of the mainstream position would be something like this: Burning fossil fuels adds CO2 to the atmosphere. Part of this CO2 goes into the oceans and the biosphere, while the rest remains in the atmosphere. This explains the observed simultaneous increase in both atmospheric and oceanic CO2. johnd, can you offer a similarly straightforward and mechanistic example of your argument? Tell us what you think happens to the CO2 we produce and why CO2 is increasing in both the atmosphere and the ocean (or if you don't believe the data showing that increase, say so).
  18. #9: "you confuse me with your "Well, no"" Your statement in #6 "magnitude of the nett increase of CO2 ... is very small against both the emissions and the sinks that occur naturally,"" gave me the impression that you meant the atmospheric CO2 increase is much less than emissions less natural sinks. It is not 'much less'. But I second Ned's suggestion: Where do all those Gtons of CO2 go each year? If they are absorbed by natural sinks, why is atmospheric CO2 increasing by 2ppm per year? Recall that a part per million by volume doesn't sound like much, but we're talking about the atmosphere -- a very large volume.
  19. johnd said:
    with one site, Heidelberg Germany typically 370ppm to perhaps 420ppm,
    This shows how shoddy johnd's reasoning is. Heidelberg is a large industrial city which produces copious quantities of anthropogenic CO2. This is just a denier grabbing at the slimmest piece of evidence to try and bolster their well debunked arguments. Also, johnd, carbon isotope analysis shows conclusively that the increase in atmospheric CO2 is due to carbon derived from fossil fuels.
  20. johnd - You asked if "...do the natural processes that drive the sources and sinks for CO2 follow a similar pattern as what occurs in business where the expenses, sinks, always seem to rise, or fall, just enough to consume all the income, sources, that becomes available?" Well, if you look at the record over the last 10,000 years: Looking back even further, here's a graph from Wiki commons for the last 425KY: The answer is "Just enough". It's only in the last 150 that this balance has changed, taking CO2 levels sharply out of the 180-300ppm range to the current ~390ppm.
  21. #14: "The anthropogenic origin of the observed rise in CO2 is one of the clearest, most obvious physical facts in earth system science." I find it astounding that so many question this; I would love to figure out why the deniers give it so much traction and how to burst that bubble. And then there's the old chestnut: 'correlation is not causality.' Is this a fitting reply? Let me hold a rock over your head; the speed at which it hits your head correlates well with the height of the rock.
  22. johnd at 22:17 PM on 26 August, 2010 Just to add some detail to the charts Ned and KR posted: (All data from NOAA Paleo site) This curve tracks known and estimated anthropogenic emissions back to pre-industrial times. I think in this case correlation is so high, and process so well understood, that uncertainties about causality are vanishingly small.
  23. Ian Forrester at 00:36 AM, regarding the Heidelberg site, yes we know where it is and why the CO2 levels are so high, but you blatantly choose to ignore the most obvious point that the seasonal fluctuations make, that is although the CO2 levels go off the scale, during the "growing season" when the CO2 is being sequestered by plants taking up extra CO2, the levels fall by 50ppm. If you missed that point, please ponder awhile as it indicates that the natural sinks in that region have the capacity to sequester far more CO2 than what occurs elsewhere, and if so, exactly why it is so.
  24. No johnd, the Heidelberg data do not show a "sink" of 40 ppm per day. You have entirely misinterpreted the data provided and have failed to actually visualize what is happening. As I said, Heidelberg is an industrial city, it produces large quantities of CO2. However, the concentration of CO2 (the data presented in the paper you quote) is a very localized concentration. It may reach 410 or higher ppm in a single day when conditions are right (very little wind) However, the drop back to normal levels (370ppm) is due to unpolluted "country" air being blown in from the surrounding area. It is not due to a natural sink. Note how the levels never go below the global average, that should tell you that there is no local sink which is ten times greater than previously observed as you state in your posts at #6 and #23. Just to repeat, the drop of CO2 concentration from >410 ppm back to normal global levels is due to normal air displacing the highly polluted city air and is not due to some large and previously unknown sink.
  25. Ian Forrester at 09:51 AM, what are you talking about "per day"??? The study tracks the annual cycles!! You've have completely failed to grasp what exactly was being analyzed, perhaps reading it with preconceived notions. As noted in the study, Heidelberg has a fairly strong industrial influence to the East, but it is only one of the 16 stations, all which exhibit the same seasonal variation to varying degrees from a variety of locations across the globe, including some surrounded by your "country air".

1  2  Next

Post a Comment

Political, off-topic or ad hominem comments will be deleted. Comments Policy...

You need to be logged in to post a comment. Login via the left margin or if you're new, register here.

Link to this page


The Consensus Project Website

THE ESCALATOR

(free to republish)


© Copyright 2024 John Cook
Home | Translations | About Us | Privacy | Contact Us