Climate Science Glossary

Term Lookup

Enter a term in the search box to find its definition.

Settings

Use the controls in the far right panel to increase or decrease the number of terms automatically displayed (or to completely turn that feature off).

Term Lookup

Settings


All IPCC definitions taken from Climate Change 2007: The Physical Science Basis. Working Group I Contribution to the Fourth Assessment Report of the Intergovernmental Panel on Climate Change, Annex I, Glossary, pp. 941-954. Cambridge University Press.

Home Arguments Software Resources Comments The Consensus Project Translations About Support

Twitter Facebook YouTube Mastodon MeWe

RSS Posts RSS Comments Email Subscribe


Climate's changed before
It's the sun
It's not bad
There is no consensus
It's cooling
Models are unreliable
Temp record is unreliable
Animals and plants can adapt
It hasn't warmed since 1998
Antarctica is gaining ice
View All Arguments...


Username
Password
New? Register here
Forgot your password?

Latest Posts

Archives

Wigley and Santer Find the IPCC is too Conservative on AGW

Posted on 20 November 2012 by dana1981

Tom Wigley and Ben Santer have published a new paper in Climate Dynamics entitled A probabilistic quantification of the anthropogenic component of twentieth century global warming (hereinafter WS12).  The paper seeks to clarify this statement about human-caused global warming in the 2007 IPCC report:

"Most of the observed increase in global average temperatures since the mid-20th century is very likely due to the observed increase in anthropogenic greenhouse gas concentrations"

As WS12 notes, this statement has been criticized by various individuals, including Pat Michaels in testimony to US Congress and Judith Curry.  Some of these criticisms stem from a failure to understand that the term "very likely" has a specific numerical definition, meaning greater than 90% probability.  Some stem from the fact that the other terms used in the IPCC attribution statement like "most" and "mid-20th century" are somewhat vague.

WS12 attempts to add specificity to these more vague phrases by quantifying the magnitude of the human contribution to global warming in probabilistic terms.  Their overall result (dark green in Figure 1) is consistent with the rest of the global warming attribution scientific literature.

attribution 50 yr

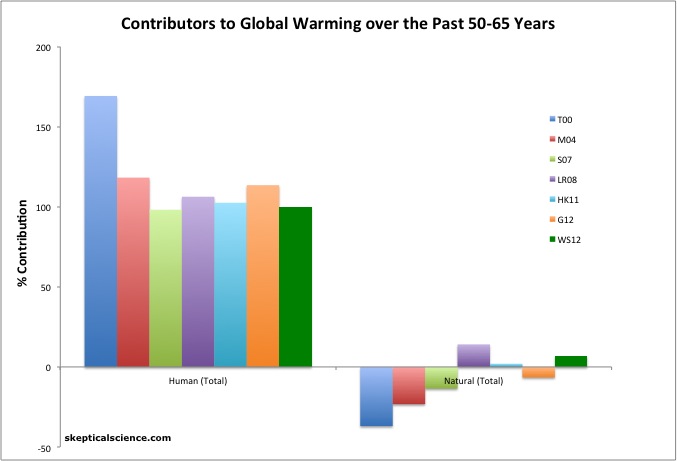
Figure 1: Net human and natural percent contributions to the observed global surface warming over the past 50-65 years according to Tett et al. 2000 (T00, dark blue), Meehl et al. 2004 (M04, red), Stone et al. 2007 (S07, light green), Lean and Rind 2008 (LR08, purple), Huber and Knutti 2011 (HK11, light blue), Gillett et al. 2012 (G12, orange), and Wigley and Santer 2012 (WS12, dark green).

WS12 Methodology

Since the 2007 IPCC report examines radiative forcings (global energy imbalances caused by factors like an increasing greenhouse effect) up to 2005, WS12 considers the timeframes 1950–2005 and 1900–2005 in their analysis.  They use global mean surface temperature data from GISS, NCDC, HadCRUT4, and HadCRUT3v, and use climate sensitivity values (the total amount of warming in response to a doubling of atmospheric CO2, including feedbacks) of 1.5°C, 3°C, and 6°C.  This accounts for the most likely value based on the current body of scientific research (3°C) as well as the very likely low (1.5°C) and high (6°C) possible values (90% confidence interval).

The paper also includes a new analysis of the uncertainty associated with the aerosol forcing.  Aerosols are particulates released during fossiil fuel and biomass combustion which have an overall cooling effect on global temperatures by blocking sunlight.  WS12 estimates the aerosol forcing at -1.10 ± 0.57 Watts per square meter (W/m2).  This is a substantially narrower range of likely values than in the 2007 IPCC report, which put the value at -1.1 W/m2 with a range of -0.2 to -2.7 W/m2 (total aerosol + black carbon on snow Figure 2). 

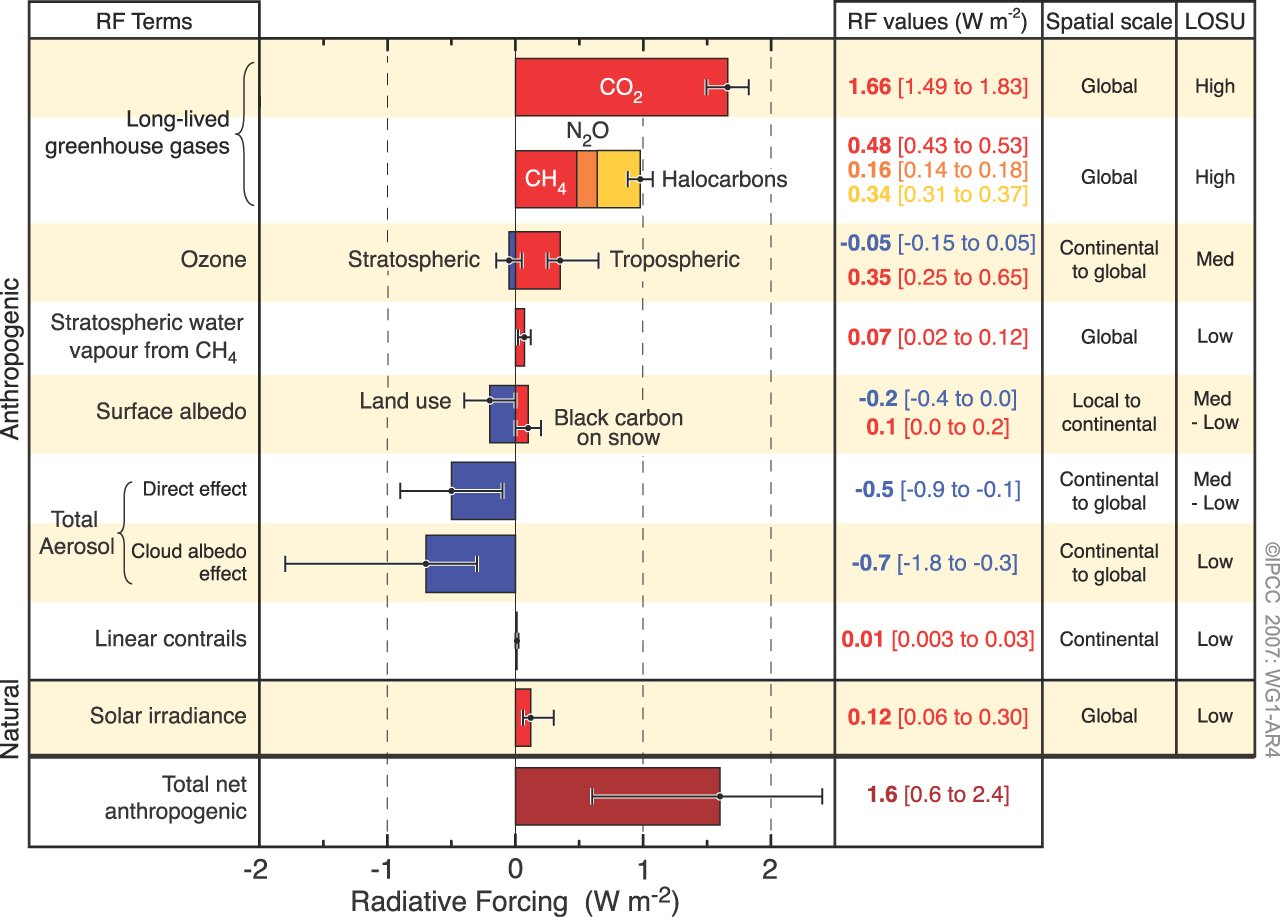
Figure 2:  Global average radiative forcing in 2005 (best estimates and 5 to 95% uncertainty ranges) with respect to 1750.  Source (IPCC AR4).

WS12 uses a very simple global climate model (version 5.3 of the MAGICC coupled gas-cycle/upwelling-diffusion energy balance model) which does not simulate internal natural variability to avoid any "contamination" of the model signal by internally generated noise.  The authors ran the model simulations with a range of low, medium, and high aerosol forcing and climate sensitivity values, also including the well-known radiative forcing associated with greenhouse gases (shown in Figure 2).

The paper goes through their analysis step by step, beginning with the most simple analysis and then adding more and more complexity in each step.

Simulating 20th Century Warming with a Simple Model

The results of the simple model simulation runs only considering the main human climate influences (greenhouse gases and aerosols) are shown in Figure 2.  The two best fits to the data involve combintions of low aerosol forcing and low (1.5°C) climate sensitivity (Figure 3a), and mid aerosol forcing and mid (3°C) climate sensitivity (Figure 3b).  However, as Fasullo and Trenberth (2012) most recently demonstrated, the lower climate sensitivity values are unlikely to reflect the real world, and there is only a 5% probability that real-world sensitivity is 1.5°C or lower for doubled CO2.

WS12 fig 2

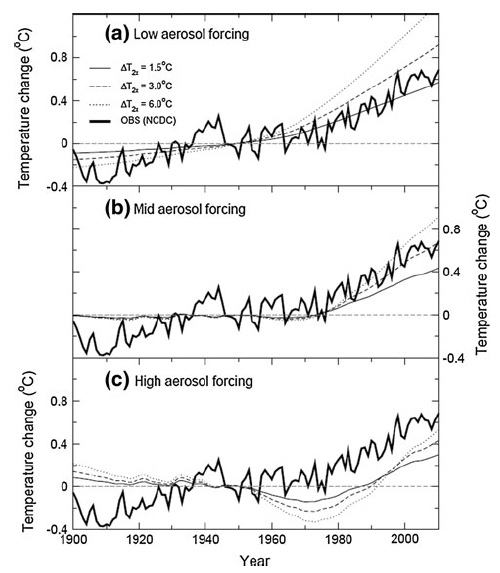
Figure 3: Simulated and observed global-mean temperature changes from 1900 for anthropogenic forcing with different magnitudes of aerosol forcing and climate sensitivity. The ‘‘Mid’’ aerosol forcing case corresponds to the best-estimate forcings given in the 2007 IPCC report.  Each panel shows results for climate sensitivities of 1.5, 3.0 and 6.0°C.  Observed data, from NCDC, are annual means relative to 1946–1954. Model data are zeroed on 1950. The decadal variability evident in the high aerosol forcing case is due to fluctuations in aerosol emissions.  Figure 2 from WS12.

WS12 notes that in Figure 3b (mid aerosol forcing), the simulations match the observed 'mid-century cooling' very well for all climate sensitivity values, with the aerosol cooling forcing offsetting the greenhouse gas warming forcing until about 1975.  The warming from 1975 to 2005 is also simulated accurately in Figure 3b, especially for the 3°C climate sensitivity model runs, as the warming grenhouse gases begin to dominate over the cooling from aerosols.  However, the warming during the early 20th Century isn't simulated in most model runs, which indicates that it has a natural component not captured in these anthropogenic-only simulations.

WS12 provides a summary of the scientific literature regarding the causes of the early 20th Century warming.  Increasing solar activity accounted for some, but not all of the warming during this timeframe.  Other research has concluded that the Atlantic Meridional Overturning Circulation (AMOC) and specifically an increase in the rate of formation of North Atlantic Deep Water (NADW) played a role, although there are not good NADW measurements prior to 1957, so this is somewhat speculative.

Greenhouse Gas Contribution to Warming - Simple Model

WS12 also ran their model simulations just considering the greenhouse gas forcing without the aerosol forcing to determine the greenhouse gas contribution to the observed warming.  Figure 4 shows that except for very low probability climate sensitivity values of 1.5°C or lower, greenhouse gases account for more warming than has been observed (meaning that aerosols and natural effects have had a net cooling effect, offsetting some of the greenhouse warming).

WS12 fig 3

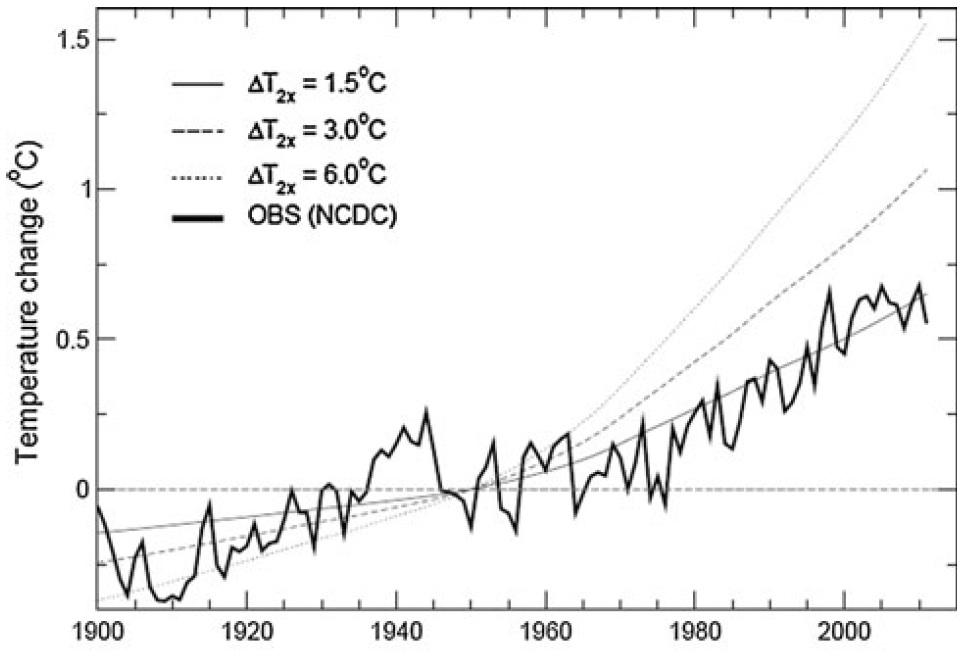
Figure 4: Simulated and observed global mean surface temperature changes from 1900 for greenhouse gas forcing alone, for different values of the climate sensitivity (1.5, 3.0 and 6.0°C). Observed data, from NCDC, are annual means relative to 1946–1954. Model data are zeroed on 1950.  Figure 3 from WS12.

Adding Complexity

WS12 then adds more complexity into their analysis, defining probability distribution functions for climate sensitivity, ocean heat uptake, and total aerosol forcing, and compare their simulations to observational data with the influence of the El Niño Southern Oscillation (ENSO) removed, since their model does not account for internal variability.  They first test the IPCC statement that

"It is likely [66–90% probability] that increases in greenhouse gas concentrations alone would have caused more warming than observed..."

Figure 5 presents the cumulative probability distribution functions (solid lines) for temperature changes over the 1900–2005 (black) and 1950–2005 (gray) timeframes, compared to the observed temperatures (dashed lines), for greenhouse gases only (a) and all human-caused raditive forcings (b).  For the climate sensitivity distribution function, WS12 uses a log-normal distribution with a median of 3.0°C and a 90% confidence interval of 1.5–6.0°C.

Figure 5a shows that the probability that the model-estimated greenhouse gas component of warming is less than the observed trend over either timeframe is approximately 7%.  Figure 5b shows that the probability that humans (greenhouse gas warming plus aerosol cooling) caused at least 100% of observed warming for 1900-2005 is 22%, and the probability of humans causing at least 100% of warming for 1950–2005 is 39%.  These results suggest that natural effects probably account for some of the observed warming over these timeframes.

WS12 fig 4

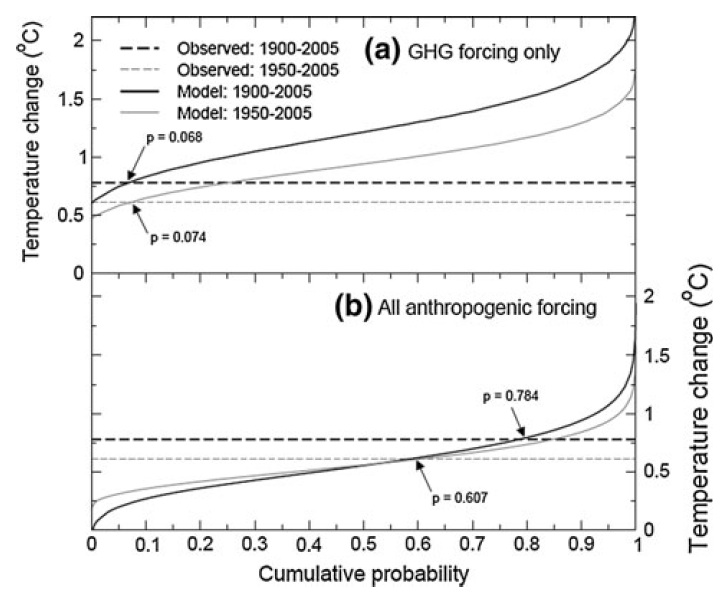
Figure 5: Cumulative distribution functions for temperature changes over 1900–2005 and 1950–2005 for a) greenhouse gases (GHG)-only and b) all anthropogenic forcings. Observed data are from NCDC, with ENSO effects removed. All changes are estimated using the robust trend.  Figure 4 from WS12.

WS12 thus concludes that the first IPCC statements about greenhouse gas warming are far too conservative (emphasis added).

"Using IPCC terminology, therefore, it is very likely that GHG-induced warming is greater than the total warming observed over this 56-year period (i.e., the model GHG-only trend is not just greater than ‘‘most’’ of the observed warming, but very likely greater than the full amount of observed warming)."

In their simulations for 1950–2005, the 90% confidence interval of warming using all-anthropogenic forcings 0.308–0.937°C (50–152% of observed warming), while the greenhouse gas-only warming 90% confidence interval is 0.582–1.397°C (94–227% of observed warming).  Therefore, the IPCC statement should either say

"Most of the observed increase in global average temperatures since the mid-20th century is very likely due to the observed increase in anthropogenic greenhouse gas concentrations human climate influences."

or

"Most At least 94% of the observed increase in global average temperatures since the mid-20th century is very likely due to the observed increase in anthropogenic greenhouse gas concentrations"

Solar and Volcanic Forcings Don't Change the Result

The next step in the WS12 analysis is to incorporate changes in solar and volcanic activity (but not in AMOC or NADW, for which data are not available in the early 20th Century, as noted above).  The results are shown in Figures 6 and 7.

WS12 fig 5

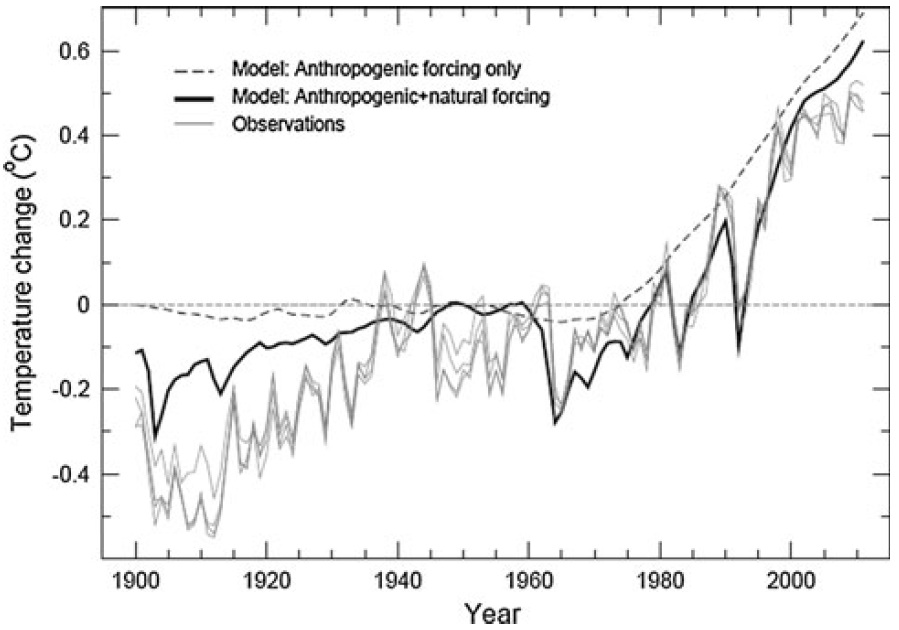
Figure 6: Estimates of global mean surface temperature change from observations, compared with median model simulations of the response to anthropogenic forcing only, and the response to forcing by combined anthropogenic and natural factors. Model results are relative to 1950.  Observations have been zeroed to have the same mean as the ‘‘anthropogenic + natural forcing’’ result over 1950–2005.  The plot shows annual-mean values; on a monthly timescale the volcanically induced cooling signals are larger.  Figure 5 from WS12.

WS12 fig 6

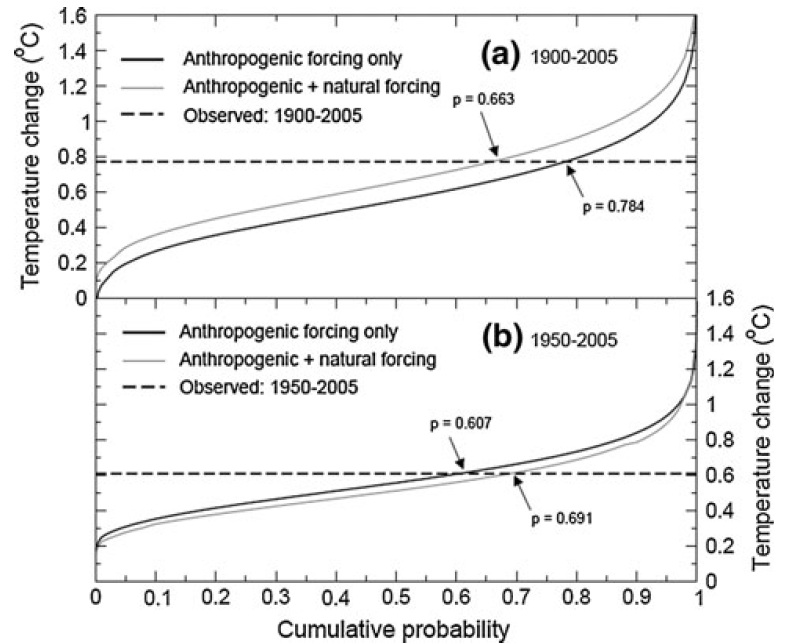
Figure 7: Cumulative distribution functions for global mean surface temperature changes over 1900–2005 and 1950–2005. Results for anthropogenic forcing only (Figure 5b) are compared with those for combined anthropogenic and natural (solar plus volcanic) forcing. The observed changes are from the NCDC data set with ENSO effects removed.  Figure 6 from WS12.

Incorporating these natural factors does not change the 1950–2005 result very much.  The probability that the observed warming exceeds the model-predicted warming (Figure 7b) actually increases from 61% to 69% (a "perfect" result would be 50%).  However, for 1900–2005, the probability that the observed warming exceeds the model-predicted warming (Figure 7a) is decreased from 78% to 66% when accounting for these natural factors.

What Does it All Mean?

WS12 summarizes their results as follows.

"Here, the probability that the model-estimated GHG component of warming is greater than the entire observed trend (i.e., not just greater than ‘‘most’’ of the observed warming) is about 93%.  Using IPCC terminology, therefore, it is very likely that GHG-induced warming is greater than the observed warming.  Our conclusion is considerably stronger than the original IPCC statement."

Thus quite contrary to the myth that the IPCC is "alarmist", WS12 finds that the IPCC has been far too conservative in attributing the observed global warming to human greenhouse gas emissions.  In fact their central estimate is that humans are responsible for 100% of the observed global warming for the 1950–2005 timeframe, with greenhouse gases responsible for 160% (Figure 8).

contributors 50

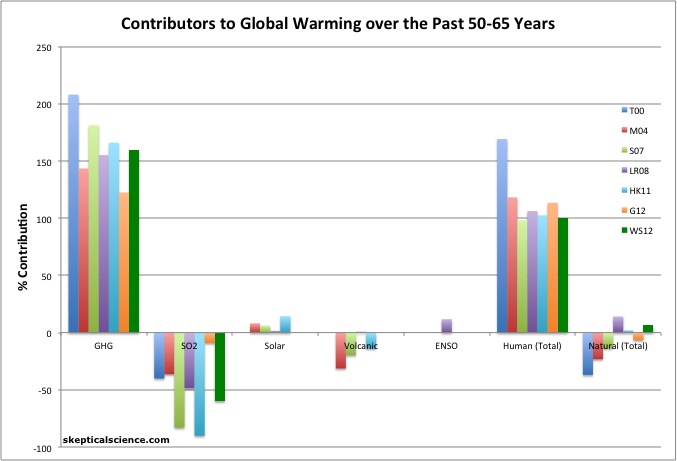
Figure 8: Percent contributions of various effects to the observed global surface warming over the past 50-65 years according to Tett et al. 2000 (T00, dark blue), Meehl et al. 2004 (M04, red), Stone et al. 2007 (S07, green), Lean and Rind 2008 (LR08, purple), Huber and Knutti 2011 (HK11, light blue), Gillett et al. 2012 (G12, orange), and Wigley and Santer 2012 (WS12, dark green).

As Figure 8 shows, the body of scientific literature is still very consistent in finding that grenhouse gases have most likely caused more warming than has been observed over the past half century, which means that the IPCC has been too conservative in attributing global warming to human greenhouse gas emissions.  In addition, without human influences on the climate, there would likely have been little change in the average global surface temperature over the past 50 years.  Instead, surface temperatures have warmed approximately 0.65°C since 1960.

Note: this post has been incorporated into the rebuttal to the myth that the IPCC is "alarmist"

0 0

Printable Version  |  Link to this page

Comments

Comments 1 to 29:

  1. This is worth saving for reference. I know I've often had the 'feeling' that I've seen evidence that the ghg contribution was >100% of temperature change, but I've never been able to remember why or who said what or how it works. Having a single paper focused on precisely that issue is what I didn't know I was waiting for. Nicely done, dana, btw.
    0 0
  2. Thanks adelady - 7 papers actually! If you click the link in the final paragraph, it goes to my discussion of the other 6.
    0 0
  3. "Some of these criticisms stem from a failure to understand that the term "very likely" has a specific numerical definition, meaning greater than 90% probability." Let's hope the IPCC accept this evidence to upgrade their level of confidence. Uncertainty fuels the Denier community, confuses the public, and provides the excuse for inaction.
    0 0
  4. One of the key results the paper reinforces (although it has been stated often enough before, e.g. Hansen & Sato 2011), is the 20th century climate creates a strong dependence between the possible values of aerosol forcing and transient climate response. I'm currently playing with a two box model, and using Hansen's (unadjusted) aerosol forcing to fit 20thC climate, I get a TCR of about 1.65C. If I set the aerosol forcing to zero, the TCR drops right down to 0.6C. If you know the aerosol forcing, 20thC climate gives you TCR. If you know TCR, 20thC climate gives you aerosol forcing. As JCH has commented at Tamino's and Curry's, if the climate skeptics were joining the dots they would "sell natural variation; buy aerosols".
    0 0
  5. It is interesting that the natural forcing plus all human forcings underpredicts warming 69.1% of the time, figure 7b, yet just human forcings alone underpredict only 60.9% of the time, yet in graph 6 it seems the dashed only human forcing line is nearly always greater than observations; presume it must have a wider variance to account for this 60% underestimation. Wonder what CS resulted in the most accurate models over the range of aerosol uncertainities with natural variation incorporated, as if ~70% models underpredict warming to 2005, then that is suggestive of a missed warming influence or a higher CS is needed which might be in keeping with other recent CS results. Seems that CS is more and more likely to be higher especially as SO2 emissions have increased since China and India industrial revolutions and brown clouds have been shading the surface as well (despite increasing overall atmospheric energy at altitude), meaning the surface temperature records over Asis will have been reduced considerably in the last 20 years or so. It is also sobering that if humnan aersols are lost from the atmosphere, that adds most likely another 1.1W to the warming influence, add in the self expanding albedo effect forcing now kicking in, and the lagged warming due oceanic mixing, then a doubling of the current warming force seems possible within 5-10years if fossil fuels are not used anymore. And the current forcing is driving a climatic warmign at a rate ~3x greater than found in the geological time record. So if stopped all emissions today, that would mean from 2020 to 2050 (as GHG in the atmosphere woudl not drop at all, due to permafrost melt and very slow drawdown) there should be a rate of warming of ~0.3C or more. Add in that natural variation in terms of sun and El Nino have tended to cooling in the last 10 years, thne is highly likely that the earth shoudl also experience some natural warming as well. That leaves us with ~1.8C above pre-industrial by 2050 by stopping all emissions now. As GHG after that are likely to increase due to eco-system distress and further permafrost releases and the need for a massive carbon sequestration becomes urgent. Adaptating to 1.8C alone considering the changes already being seen is going to take a mass effort by everyone in the same direction. Leaves a carbon budget of zero, therefore every ounce of carbon from now on is another ounce that needs to be removed from the atmosphere by 2050-2100, in-order not to slip beyond the limits of the adaptative capacity of our current civilization. How much carbon are you prepared to gamble? 400ppm? Immediate goal 350ppm 2100? Long term target. And as climate change becomes the most likely threat to the whole civilization we still fight over oil and aren't prepared to even give up the mobile phone. The scale of transformation needed is such that in this effort to prevent irrational amounts of global warming occuring whilst creating a sustainable future needs everyone to come together rather than waging war or hoping for divine intervention as we are now.
    0 0
  6. perseus @ 6. I rely on the scientists on this site to do the data collection and number crunching but I do know about communication. The IPCC missed a trick by using the phrase "very likely". If they had used the phrase "greater than 90% probability" they would have been far clearer, more accurate and less condescending. In my experience is is essential to understand that your intended audience is intelligent, something that this site does brilliantly.
    0 0
  7. Cornelius - it seems to me like the IPCC was assuming its audience is intelligent by assuming they could equate "very likely" with "greater than 90% probability" without having to spell it out. Though they probably would have saved themselves some headaches by just spelling it out each time.
    0 0
  8. On a related note, in a new blog post today, Judith Curry criticizes UCAR's Michael Morgan for agreeing with the IPCC's global warming attribution statement, apparently because she believes the too-conservative statement is too confident (shades of the Uncertainty Ewok). In the same post she also reveals that she thinks we can improve climate model projections by improving weather predictions, among other face-palm comments.
    0 0
  9. Will someone please describe to me how the modelers devised the correction factors to their models that accommodate the cooling that we saw between ca 1945 and 1975? Thanks.
    0 0
  10. Snorkert Zangox, first we need to make clear that the models are not simply "corrected" until their temperature outputs match observations. Instead, the modelers notice mismatches between hindcasts/forecasts and observations, then use those as clues to guessing which aspects of the physical models are responsible for those particular mismatches. Then the modelers use independent physical evidence to improve those aspects of the physical models. Finally they run the models again to see if the mismatches have been reduced. Sometimes that helps, sometimes it doesn't and it can even make the mismatch worse. (If a now-improved aspect's error previously was compensating for some other aspect's error in the opposite direction.)
    0 0
  11. Further to Tom's point, since models are physics-based, they should be (and indeed, to my knowledge, are) able to account for cooling periods with known factors (in the 1945-1975 case, the dramatic increase in the aerosol load in the atmosphere) without any "correction factor" whatsoever. While our knowledge of the pertinent physics is currently very good, and improving continuously, it is still not 100% so I would not expect any model to 100% accurately hindcast past temperatures.
    0 0
  12. Tom Dayton and Composer99. I understand, in general terms, how the models work; qualitatively they work the same way that the parameterized models commonly used in calculation of flow in pipes work. That is construct a model that contains the appropriate factors, then conduct measurements to define values for the various parameters included with the term for each important factor. My question is how did the modelers find values for the concentrations and particle size distributions of the particles in the air between 1945 and 1975? These parameters, among others, are critical as Composer99 noted, if one is to calculate the albedo change attributable to particle concentrations.
    0 0
  13. Snorbert Zangox - See, for example, the GISS model forcings. These include the references and data for tropospheric and stratospheric aerosols as used in their model. I suggest looking at those references for an overview. Other models and scenarios will have similar sources, although the details will of course vary.
    0 0
  14. I looked at some of the references in the sources that you provided and found two types of information. One was for example estimates of particle concentrations based on estimates of particle loads from volcanic eruptions (based, I suppose on contemporaneous literature descriptions of the events). I find this somewhat troubling as a source for input data to climate, or any other models. The other appears to be use of the climate models to predict past values for forcing agents. For example I found the following text in Hansen et al. Geophys. Res., 110, D18104, doi:10.1029/2005JD005776. "We use a global climate model to compare the effectiveness of many climate forcing agents for producing climate change. We find a substantial range in the "efficacy" of different forcings . . ." This one I find especially troubling in that it sounds like using the models to estimate the effectiveness of albedo changers based on how they affect the accuracy of the model predictions. Is anyone familiar enough with these estimates to describe how they actually work?
    0 0
  15. Snorbert Zangox - Stratospheric forcings estimated from ejecta mass, from regional optical extinction, and then satellite measures (depending on time period), calibrated against the later and better measured values for all of these, is the best data available. Hence it's the best starting place for investigation. Likewise the tropospheric forcings are estimated from sources on how much fossil fuel was burnt, and where (quite good records there) and model estimates of how that got distributed and it's effects (again, based on modern day dispersal patterns). Again, these are the best estimates available to the modelers. There are uncertainties, and there will always be uncertainties, particularly in historic data. But if you want the best model possible from the data, you start from the best estimates of that data you can obtain. I would suggest further discussion of model development take place on a more appropriate thread, such as here.
    0 0
  16. Snorbert: It's a good question, and by coincidence I've been digging on this one today, although I certainly don't have a full answer. Gavin at Real Climate would be a better person to ask, but we might be able to get somewhere together. The Skeie et al 2011 papers are probably a good place to start, the first is here and the second is here. The Skeie forcings look as though they contain a rather more pronounced mid-century drop than the Hansen or CMIP5 sets. My current impression is that atmospheric chemistry models of aerosols are developed by chemists (these have nothing to do with climate models) and validated against modern measurements (both satellite and ground based, using microwaves, IR, visual and radar). Given that the aerosol effect show considerable geographical variation, this information can be used in addition to time dependence as a validation criteria. That gives you a lot of validation power. The results are then correlated against known fuel use figures. Fuel use figures from earlier dates (e.g. Bond 2007) are then used to reconstruct aerosol emissions from before the direct observations were available. I've only looked at Skeie, I don't know if other studies have taken different approaches.
    0 0
  17. So things you can estimate reasonably well is FF consumption, BC signatures etc in pre-satellite era. Have to derive aerosol from this. see for example this one but following citations etc, you will find a rich literature. For what the forcing used by the GISS group are derived from then, follow the literature trail from Hansen et al 2007, "Climate simulations for 1880-2003 with GISS modelE." You might also be interested in a completely alternative approach (straight curve-fitting of forcings) in Benestad and Schmidt 2009 for the 45-75 dip. I dont see how you leap to "they affect the accuracy of the model predictions. " from the paper. You have a good predictive climate model, so you play with different forcings to compare their efficiecy on climate change. This allows predictions about the importance of specific forcing - in particular the paper was interested in BC and mathane. I suggest you read the whole paper. It is not about model validation.
    0 0
  18. And here's another one: link. I've plugged this at Real Climate, but it has received no attention, probably because it's by econometricians and published in a stats journal. But it is a completely empirical approach.
    0 0
  19. dana1981 @ 7. There is a difference between intelligent and educated ;)
    0 0
  20. What I mean is "very likely" is scientific jargon, and misleading in the wrong hands.
    0 0
  21. Kevin C and scaddenp It is early morning on Thanksgiving Day here in the US of A, so I have little time to pursue this in detail, but shall do that over the next few days. Kevin C wrote one can estimate fine particle emissions from fuel use data with sensitivity to geographical variations. (-snip-) (-snip-).
    0 0
    Moderator Response:

    [DB] Off-topic snipped.

    [KC] Model discussion belongs on this thread where I have addressed your question.

  22. Good news, Snorb! It's actually only Wednesday, not Thursday! You have all day!
    0 0
  23. Cornelius, Originally scientists received complaints that their reports were to numerical and that was hard for non-scientists to understand. "very likely", "likely" and other terms were specifically defined in the IPCC report so that the numbers could be removed. If people now do not understand the well defined terms, how can that be addressed?
    0 0
  24. michael Fair point. This site describes the science in 'Basic', 'Intermediate' and 'Advanced'. I wonder if it may be a good model for the IPCC?
    0 0
  25. Perseus "Let's hope the IPCC accept this evidence to upgrade their level of confidence. " Lets also hope they accept the evidence since the last report to upgrade their use of language to forestall the deliberate obfuscators. How does anyone write something that is responsible & accurate while at the same time trying to prevent the obfuscators from cherry-picking it to say that black is white?
    0 0
  26. Snorbett General comment, based on my limited understanding of climate modelling. Basically you are trying to package up the known physics into rules, then let the rulesplay out. If in the playing out, it ain't quite right, you know some part of what you have put into the package doesn't match reality. If you have nothing better, you parametrerize. But it is always better to plug in more physics if you can. So this statement is probably not quite right: 'I understand, in general terms, how the models work; qualitatively they work the same way that the parameterized models commonly used in calculation of flow in pipes work. That is construct a model that contains the appropriate factors, then conduct measurements to define values for the various parameters included with the term for each important factor.' Climate models aren't quite like flow in pipes models - they operate in 4 dimensions for a start - 3 of space plus time. They model a mix of broad physics and some parametrised aspects. Then let the consequences of these interconnections play out. So although the model contains 'factors' - based on physics - for small scale interconnections in the system, importantly, if you have captured the basic physics correctly, this constrains how much the 'factors' can influence things. Your 'factors' have to produce results that obey the Laws of Thermodynamics for example at each scale. 'My question is how did the modelers find values for the concentrations and particle size distributions of the particles in the air between 1945 and 1975? These parameters, among others, are critical as Composer99 noted, if one is to calculate the albedo change attributable to particle concentrations.' One can make reasonable estimates of what the types of sources were for particles based on existing technologies - lots of coal fires for example. Also, the extra knowledge we might seek to add from the past isn't confined tojust drivers like aerosols. It can also include things like any issues with the temperature record we are comparing the models against. Both can (and certainly do) have errors. So researchers need to be looking for errors/inaccuracies in both the model conclusions, and the historical evidence. For example, the recent update to the HadSST sea surface temperature record include corrections for an observed bias in the data, strongest during WWII, as a result of the mix of nations that were involved in measuring sea surface temperatures changing significantly during that period. Different nations used different sampling methods on their ships, each with it's own bias. If the proprtion of nations involved in SST sampling didn't change, no problemo. But during WWII, there was a huge change - problemo.They have ven been able to date the major shift reversing the change to the nearest month - Aug 1945. Similarly the record of land temperatures strongly shows that the warming in the 30's particularly wasn't a GLOBAL warming. It was focussed very much in the high northern hemisphere. Possibly primarily in the atlantic sector of the Arctic. And including the possibility that some of it may have been an atrefact of the growth of the number of meteorological stations in the Arctic from virtually none, to a moderate number by the 1950's. Its possible that someof the warming was an artefact of the station coverage during that period. So when we look at how well models capture the warming back then and into the 50's-70's, we have to include the possibility that the 'cooling' in the 50's to 70's wasn't as pronounced because the warming in the 30's/40's may not have been as great.
    1 0
  27. It appears that the whole point of causality versus correlation is skipped.  I am a statistician, not a physicist or chemist.  However, most of these types of paper seem to read ...  "if [assumptions from climatology models], then humans are the problem."

    I'd like to see where causality is addressed.

    0 0
  28. Jsalch, basic physics was used to project human-caused warming many decades before it was possible to observe it. See the post How Do We Know More CO2 Is Causing Warming? Also read The History of Climate Science, and for details Spencer Weart's The Discovery of Global Warming. Watch Pierrehumbert's AGU lecture describing successful predictions, or at least read a summary of his talk. And Climate Change Cluedo.

    0 0
  29. Jsalch @27, the principles used in climate models are not assumptions.  Climate models are reiterative calculations of causal relationships relevant to global climate.  Thus one part of a model will handle conservation of momentum, requireing that momentum be conserved when are masses move from one cell to another in a model.  Another will handle the effects of Boyle's law with regard to vertical motion of gas under convection.  Another part again will handle radiative absorption and emission.  All of these causal laws that go into a climate model are very well confirmed physical theories from both laboratory and non-laboratory observations.  

    There is a problem in that the smallest practical resolution of climate models is much larger the resolution of laws applied.  Consequently to make the physics work, parameters need to be introduced to handle the approximation.  These parameters, however, are justified in detail based on the causal laws - and refined by comparison with real world observations.

    The range of physical laws, and hence causal relationships embodied in GCMs ranges through radiative physics, newtonian dynamics, gas laws, laws of evaporation, and on into laws of chemistry.

    The output of the models are then tested against both much simpler models and against global observations of a very large number of variables (not just Global Mean Surface Temperature).  All GCM's produce earthlike climates with an astonishing verrisimilitude - which is astounding given the number of physical laws embodied in their operation, and the courseness of their grid.  Combined they also produce quite accurate predictions of physical values in absolute terms.  They are made to look like the perform much worse than they do because values are expressed in relative terms because doing so highlights discrepancies - the better to be able to test and improve the models.

    When you summarize this process as "if [assumptions from climatology models], then humans are the problem", it merely demonstrates your complete ignorance on how climate is actually modelled in GCMs.

    Curiously, however, there is one class of 'scientist' who only ever present simple, statistical models of climate - ie, whose output could be described as "if assumptions, then results".  That class are the AGW deniers.  They are so confident in their theories that they never dare model them based on detailed representations of physical law.  

    0 0

You need to be logged in to post a comment. Login via the left margin or if you're new, register here.


The Consensus Project Website

THE ESCALATOR

(free to republish)


© Copyright 2024 John Cook
Home | Translations | About Us | Privacy | Contact Us