


 Arguments


Land Surface Warming Confirmed Independently Without Land Station Data
Posted on 8 April 2013 by dana1981
A new paper published in Geophysical Research Letters, Independent confirmation of global land warming without the use of station temperatures by Compo et al. (2013) takes a new approach at confirming the accuracy of the instrumental surface temperature record.
Their study seeks to bypass all criticisms of the thermometers themselves by creating a surface temperature record that does not include land thermometer station data. The results are shown in Figure 1 with their surface land temperature reconstruction (dark blue) compared to that from the University of East Anglia Climatic Research Unit (CRU) (CRUTEM4, in red), and the average of five other instrumental surface temperature data sets in black.
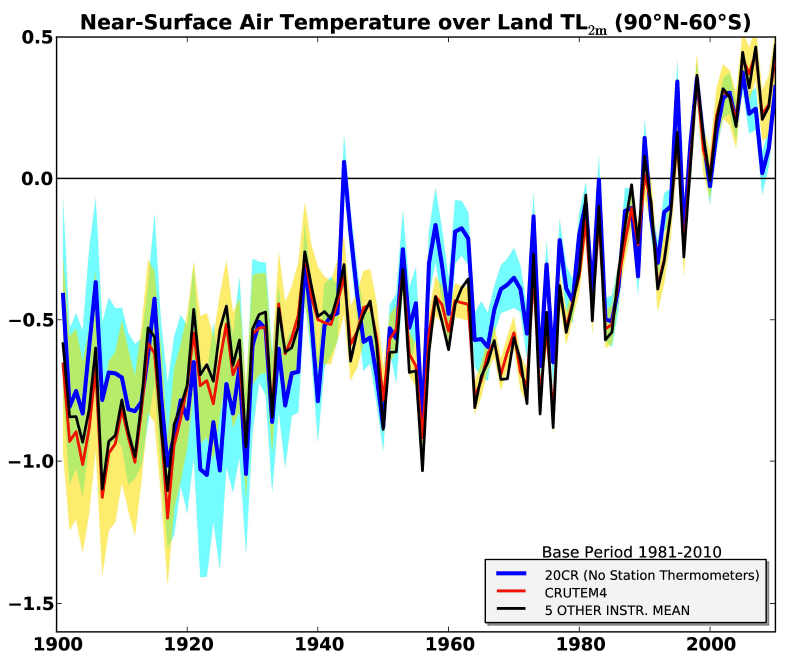
Figure 1: Temporal comparison of near-global land (90°N–60°S) 2 meter air temperature anomalies (TL2m) between 20CR and station-temperature based estimates. Red curve: global TL2m anomaly series from CRUTEM4, black curve: the average of five additional station-temperature datasets, and blue curve: the 20CR. 95% uncertainty ranges are shown for CRUTEM4 (yellow fill) and 20CR (blue fill) and their overlap (green fill). From Compo et al. (2013)
Compo Data and Methods
The Compo paper uses the National Oceanic and Atmospheric Administration (NOAA) 20th-Century Reanalysis (20CR). A ‘reanalysis’ is a climate or weather model simulation of the past that incorporates data from historical observations.
"The 20CR ... uses a time-varying weighting between pressure observations and an ensemble of 56 nine-hour forecasts made with a NOAA atmosphere/land general circulation model (AGCM) to estimate the three dimensional state of the atmosphere every six hours"
They use 20CR to infer the global surface temperature given only data for atmospheric CO2, solar and volcanic radiative forcing agents, sea surface temperatures, sea ice concentrations, and barometric pressure observations. The authors then compare that surface temperature reconstruction to data sets based on instrumental temperature measurements from CRU, NOAA, NASA's GISTEMP, the Japanese Meteorological Agency (JMA), and the University of Delaware (UDEL).
The paper focuses on the 1901–2010 period and the more rapidly-warming 1952–2010 period, examining temperatures averaged over 90°N–60°S, where all instrumental data sets have coverage over land areas. This leaves out the sparsely-covered Antarctic, but includes the Arctic where there is less land area, particularly at the highest latitudes which are comprised mostly of ocean and sea ice.
Results
As Figure 1 shows, the correlation between 20CR and the instrumental temperature data sets is very strong, between 0.84 and 0.92. They also find that the uncertainty estimates are similar, although the instrumental data sets may be somewhat underestimating the uncertainty in the mid-20th century where there is a small disagreement with 20CR.
"Although the agreement between 20CR and the station-based datasets is strong, the mean square differences between them are somewhat larger than expected from their respective confidence intervals (Table S3). This suggests that the datasets underestimate their uncertainty, particularly 20CR during the periods of disagreement in 1944–45, and the 1960s and 1970s"
The spatial patterns in the warming trends are also similar, with correlations between 0.67 and 0.78 over the 1901–2010 period.
"A few regions, however, do deviate from this general agreement, notably the Midwestern United States, eastern Brazil, and Argentina (Figure 2)"
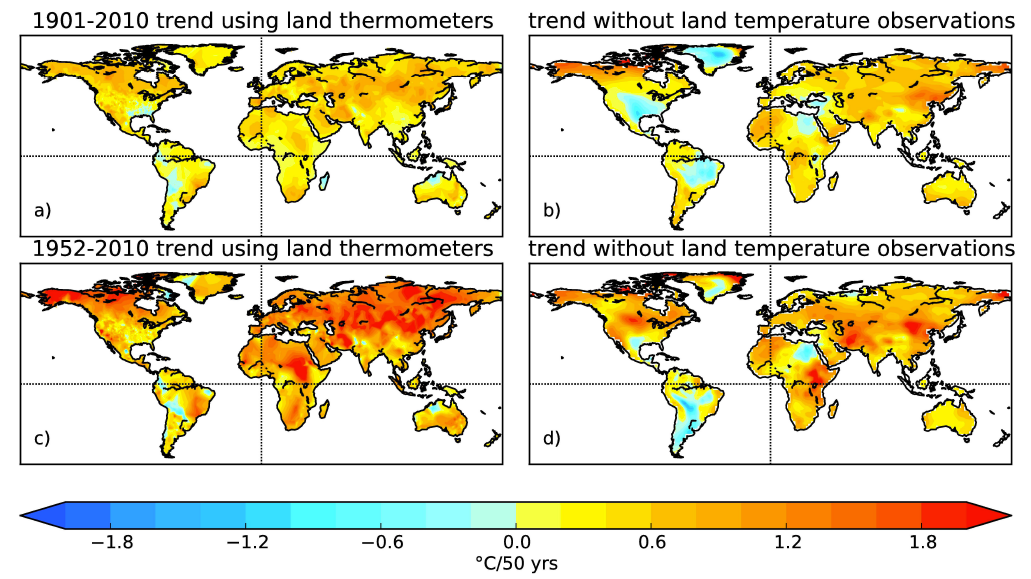
Figure 2: Spatial comparison TL2m trends between 20CR and the station-temperature based CRU_TS3.10. Local linear trends estimated using least-squares from (a, c) CRU_TS3.10 and (b, d) 20CR shown as °C change per 50 years over the (a, b) 1901–2010 and (c, d) 1952–2010 periods. From Compo et al. (2013)
The overall global surface temperature warming trend in 20CR is 0.09°C per decade for 1901–2010 and 0.13°C per decade for 1952–2010. These are indeed very similar to the trends in the instrumental temperature record, of about 0.08°C and 0.12°C per decade for those two timeframes, respectively.
Yes Virginia, the Instrumental Temperature Record is Reliable
The authors conclude that their independent data set has confirmed that the land instrumental temperature record and data sets "are reliable and robust estimates of large-scale TL2m variability and change," although they have identified some "interesting differences in some regions such as the Midwestern United States, Argentina, and eastern Brazil." As a result, they have independently confirmed the overall global surface warming trends measured by the instrumental record since 1901 and 1952.
This new study is added onto the many lines of evidence confirming the accuracy of the instrumental surface temperature record.
- Studies investigating urban heat island effects and other adjustments made to the raw data.
- Comparisons of raw to adjusted data, which have essentially the same warming trend.
- All surface temperature records, including the Koch-funded Berkeley Earth project, have essentially the same warming trend.
- Comparisons of satellite to surface temperature measurements, which have essentially the same warming trend.
- Temperature proxies (natural thermometers) having a strong correlation with instrumental temperature measurements.
- Other reanalysis comparisons have essentially the same warming trend.
Denial of the instrumental temperature record accuracy remains popular – coming in at #7 in the most used climate myths database – because it's a simple way to indirectly deny global warming. If the thermometers are wrong, then maybe the planet isn't warming after all, or at least not enough to worry about, and we can all go about our lives without worrying about that pesky climate change. But with so many different studies and so many different lines of evidence confirming the instrumental temperature record accuracy (including contrarians' own efforts), it's something that has become increasingly hard to deny.
The most often-cited recent effort to dispute the instrumental record accuracy is a draft paper by climate contrarian blogger Anthony Watts, which we previously showed is full of numerous fundamental flaws which entirely undermine its conclusions. The paper has not even been submitted for peer-review, but that has not stopped Watts from referencing it in two separate interviews to deny the surface temperature record accuracy, as did John Christy in testimony to US Congress. In their new paper, Compo et al. even reference Christy's congressional testimony as an example of efforts to dispute the accuracy of the surface temperature record, but demonstrate once again that these criticisms are baseless.
How much more evidence do we need? The accuracy of the instrumental global surface temperature record is essentially settled science at this point. The Earth is warming, it's warming very fast, and continuing to deny this fact is a waste of time.
Note: the Compo et al. (2013) results have been incorporated into the rebuttal to the myth that the surface temperature record is unreliable.


Also worth mentioning is the recent paper by Anderson et.al. 2013, which extends proxy temperature records forward to 1980. The Anderson data also nicely confirm thermometer records' accuracy; at 20-year smoothing, Anderson and HADCRUT4 are virtually indistinguishable from 1920 forward.
keith @1 - indeed, Anderson is the 'natural thermometers' reference in the 5th bullet at the end of the post.
Do I feel dumb. I didn't understand a word of this article. What data were they using to determine the temperature change over the period studied.
william - They used data from the Twentieth Century Reanalysis Project and:
[Emphasis added]
This was done to remove influences of various influences on surface land stations such as urban heat influence, station moves, equipment changes, land use, statistical processing, and all of the other things that 'skeptics' have been complaining about.
In short, they estimate air temperatures by what they could be when constrained by the other measurements.
Note - an earlier summary of this paper as a poster presentation is available here, for those blocked by the paywall.
This poster also describes using an ensemble of AGCM (atmospheric global climate model) integrations without the pressure observations, finding that the reconstructions with the pressures are a much better match to surface temperature observations - the barometric pressures add considerable information.
What strikes me is how different the trends are in some parts of the globe between the two maps. Does this imply that some areas have a huge warm or cool bias in the temperature record? Seems most unlikley to me. So either there are errors in the non temperature data at the "local" level or the model is ok in aggregate but error prone at the detail level or???
This reanalysis is known to have large temperature biais in some part of the world. This is expected since there is no land temperature input and sea temperature are also a reconstructed. It is expected that in the next generation of reanalysis will integrated the temperature and wind measurments to improve the results. Nevertheles, and conterintuitively, most of the information is carried by pressure measurments. It is also expected that the addition of recentely reconvered historical weather data (like Old weather project) will improve further the results.
Dana,
Your "Note" at the end of the OP needs an edit.
Also, shouldn't the rebuttal article, It's Urban Heat Island effect also be updated in a similar manner?