Climate Science Glossary

Term Lookup

Enter a term in the search box to find its definition.

Settings

Use the controls in the far right panel to increase or decrease the number of terms automatically displayed (or to completely turn that feature off).

Term Lookup

Settings


All IPCC definitions taken from Climate Change 2007: The Physical Science Basis. Working Group I Contribution to the Fourth Assessment Report of the Intergovernmental Panel on Climate Change, Annex I, Glossary, pp. 941-954. Cambridge University Press.

Home Arguments Software Resources Comments The Consensus Project Translations About Support

Bluesky Facebook LinkedIn Mastodon MeWe

Twitter YouTube RSS Posts RSS Comments Email Subscribe


Climate's changed before
It's the sun
It's not bad
There is no consensus
It's cooling
Models are unreliable
Temp record is unreliable
Animals and plants can adapt
It hasn't warmed since 1998
Antarctica is gaining ice
View All Arguments...


Username
Password
New? Register here
Forgot your password?

Latest Posts

Archives

The Latest Pre-Bunked Denialist Letter in Lieu of Real Science

Posted on 1 December 2012 by dana1981

For climate denialists, the preferred route by which to air their grievances about global warming is not via the scientific peer-review process, but rather through opinion letters published in the mainstream media.  The reasons are obvious — a paper submitted to a peer-reviewed scientific journal must pass a fairly rigorous review by scientific experts, whereas a letter published in a newspaper does not undergo any expert review, and thus can contain whatever unsubstantiated nonsensical arguments the contrarians think the general public will believe.

The latest such letter was published in the Financial Post, authored by Tom Harris (who is best known for grossly misinforming Carleton University students about climate change in a Climate and Earth Science class he should never have been teaching).  Harris convinced 125 mostly similarly unqualified individuals to sign the letter, including Anthony Watts, Joe Bastardi, Christopher Monckton, Nils-Axel Mörner, Oliver Manuel, Fritz Vahrenholt, Tim Ball, William Happer, Richard Cohen, Syun-Ichi Akasofu, Don Easterbrook, Joe D'AleoIvar Giaever, Cliff Ollier, Fred Singer, Ole Humlum, Jan-Erik Solheim...the list of individuals with no climate expertise or with a history of being wrong on climate issues goes on and on and on.

Of course any scientific assertions should be evaluated based on their own merit, regardless of who makes them.  As is always the case with these sorts of opinion letters, the Financial Post letter contains little more than a Gish Gallop of false, unsupported assertions.  Fortunately we have already debunked most of them at Skeptical Science, so dispelling these zombie myths once more is a relatively simple task.

Denialists Pre-Bunked on Continued Global Warming

The main assertion, made several times in the letter, is a repeat of the myth that global warming stopped 16 years ago.  This is one of the few arguments in the letter that has a shred of supporting evidence, as the contrarians claim:

"The U.K. Met Office recently released data showing that there has been no statistically significant global warming for almost 16 years."

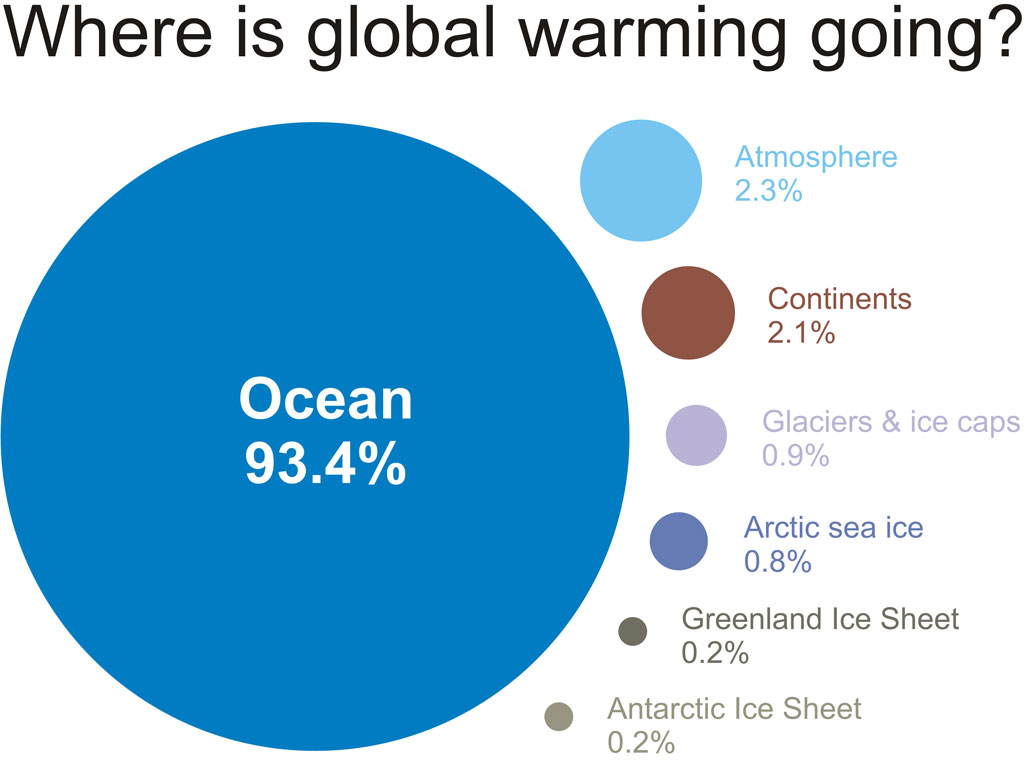
This assertion quite clearly refers to the misleading Daily Mail article which was pre-bunked by Nuccitelli et al. (2012).  While the measured global surface warming over the past 16 years is not statistically significant (0.047±0.128°C per decade), the central value is positive, meaning the average surface temperature has most likely warmed over this period.  More importantly, rising global surface temperatures represent a very small percentage of overall global warming, most of which is borne out through the warming of the world's oceans (Figure 1).  As Nuccitelli et al. (2012) showed, this global warming has continued unabated (Figure 2).

where is warming going

Figure 1: Components of  global warming for the period 1993 to 2003 calculated from IPCC AR4 5.2.2.3.
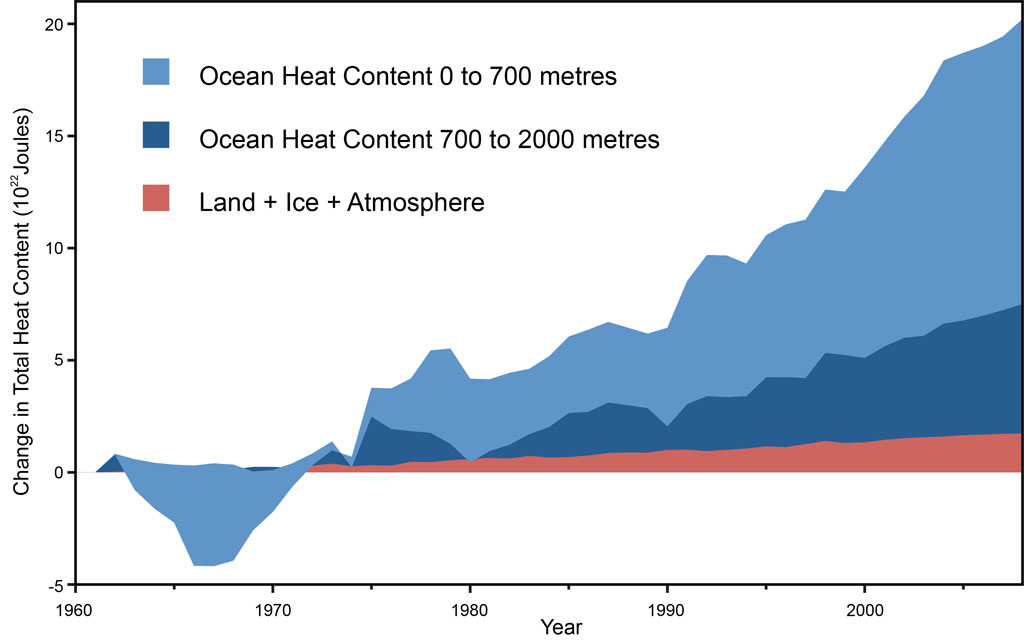
 

Fig 1

Figure 2: Land, atmosphere, and ice heating (red), 0-700 meter OHC increase (light blue), 700-2,000 meter OHC increase (dark blue).  From Nuccitelli et al. (2012).

Denialists Pre-Bunked on Accurate Global Warming Projections

The climate denialsts also picked a very bad time to claim that global warming projections are exaggerated:

"Rigorous analysis of unbiased observational data does not support the projections of future global warming predicted by computer models now proven to exaggerate warming and its effects."

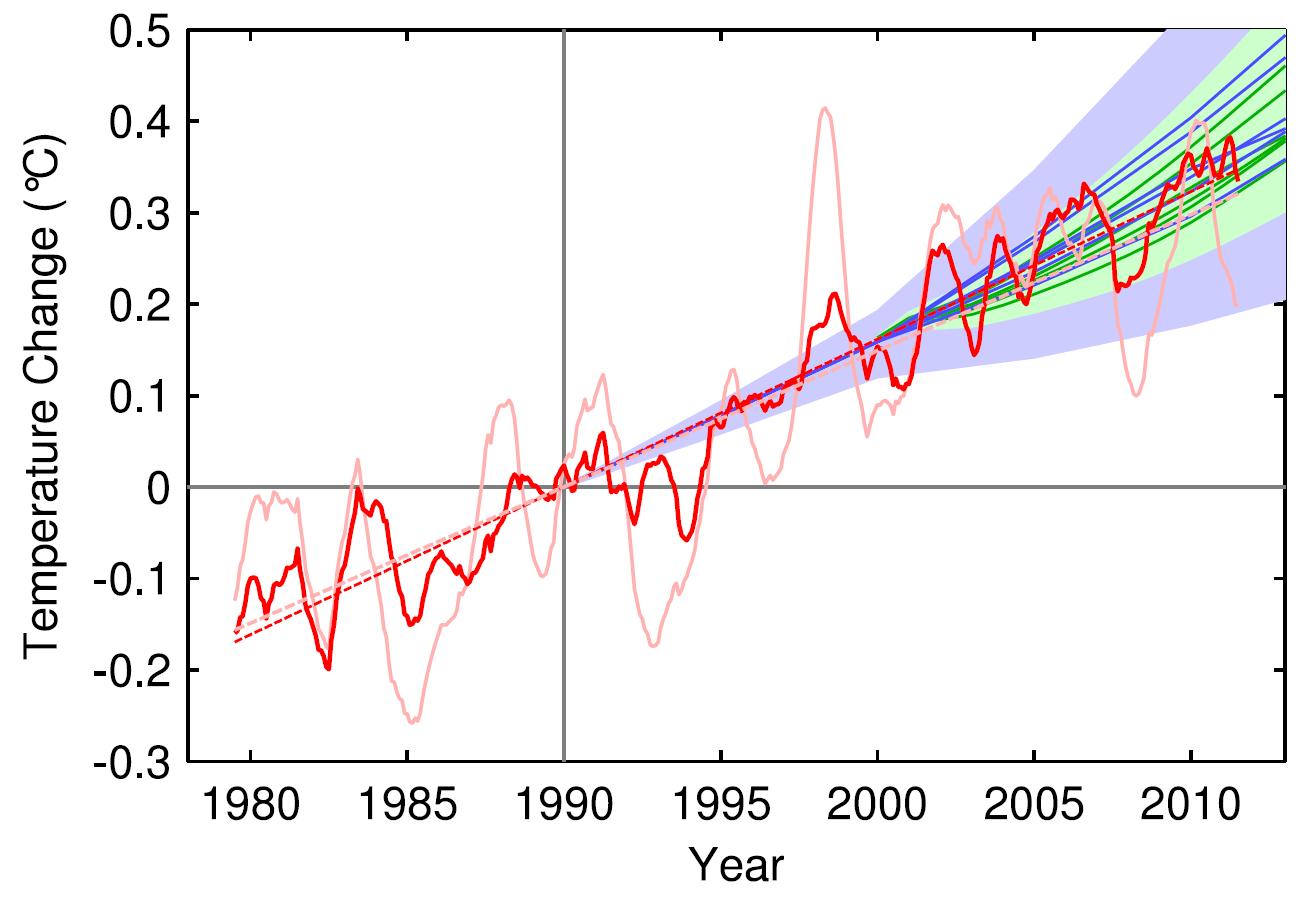
The timing is very poor because Rahmstorf et al. (2012) just pre-bunked this claim by verifying the accuracy of the global surface temperature projections made by the climate models used in the IPCC report (Figure 3).

RFC12 Fig 1

Figure 3: Observed annual global temperature, unadjusted (pink) and adjusted for short-term variations due to solar variability, volcanoes and ENSO (red) as in Foster and Rahmstorf (2011).  12-month running averages are shown as well as linear trend lines, and compared to the scenarios of the IPCC (blue range and lines from the 2001 report, green from the 2007 report).  Projections are aligned in the graph so that they start (in 1990 and 2000, respectively) on the linear trend line of the (adjusted) observational data.

Denialists Pre-Bunked on Solar Non-Cooling

Several climate contrarians who have predicted impending global cooling signed the letter, which contained the following assertion:

"Some scientists point out that near-term natural cooling, linked to variations in solar output, is also a distinct possibility."

Feulner & Rahmstorf (2010) examined the impact on global warming if the sun fell into a grand minimum.  They found that average global surface temperature would be diminished by no more than 0.3°C, which would only offset a tiny fraction of human-caused global warming (Figure 4).
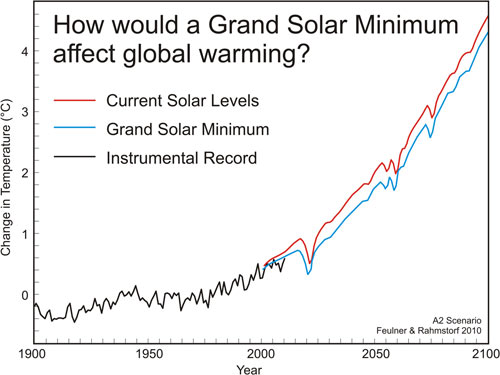


Figure 4: Global mean temperature anomalies 1900 to 2100 relative to the period 1961 to 1990 for the A2 scenario. The red line represents temperature change for current solar levels, the blue line represents temperature change at Maunder Minimum levels. Observed temperatures from NASA GISS until 2010 are also shown (black line) (Feulner & Rahmstorf 2010).

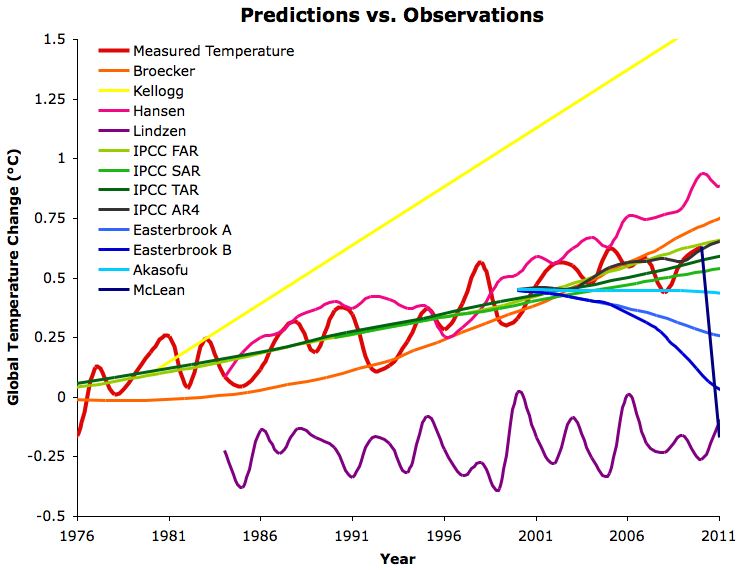
And how have those contrarian global cooling predictions (by Akasofu and Easterbrook, among others) fared thus far?  Unlike the IPCC, not well at all (Figure 5).

1976-2011 all predictions

Figure 5:  Various best estimate global temperature predictions evaluated in the 'Lessons from Past Climate Predictions' series vs. GISTEMP (red).  The warmer colors are generally mainstream climate science predictions, while the cooler colors are generally contrarian predictions.

Denialists Wrong on Extreme Weather

The letter steals from the Roger Pielke Jr. obfuscation playbook, trying to argue that climate change is not linked to extreme weather because thus far there is no clear link between human-caused global warming and economic losses from extreme weather.  While the scientific evidence indicates that the intensity and/or frequency of many types of extreme weather is increasing due to human-caused global warming, there is not yet a clear trend in economic damage caused by extreme weather, when increases in population are taken into account.  This may be in part to improving technology making our buildings and infrastructure more resistant to extreme weather.

Note the careful wording in the letter (emphasis added):

"The U.N.’s own Intergovernmental Panel on Climate Change says in its Special Report on Extreme Weather (2012) that there is “an absence of an attributable climate change signal” in trends in extreme weather losses to date."

However, the letter also asserts:

"The incidence and severity of extreme weather has not increased."

This is incorrect.  For example, the same IPCC report on extreme weather cited by the contrarians states:

"It is likely that anthropogenic influences have led to warming of extreme daily minimum and maximum temperatures at the global scale. There is medium confidence that anthropogenic influences have contributed to intensification of extreme precipitation at the global scale. It is likely that there has been an anthropogenic influence on increasing extreme coastal high water due to an increase in mean sea level."

As noted above, there is a large and growing body of scientific literature finding not only that the incidence and severity of many types of extreme weather has increased, but also that human-caused global warming is the cause.

Denialists' Sandy Strawman

The letter is specifically addressed to United Nations Secretary-General H.E. Ban Ki-Moon, and the contrarians falsely accuse him of "making unsupportable claims that human influences caused [Hurricane Sandy]."  In reality, Ban Ki-Moon did not say climate change caused Hurricane Sandy, he said:

"...extreme weather due to climate change is the new normal."

This is true — as discussed above, climate change is increasing the frequency and/or intensity of many types of extreme weather.  Human-caused global warming also amplified the impacts of Hurricane Sandy.

Wrong, Unsupported, and Misguided Denialists

Ultimately the denialists advise that we should not try to mitigate global warming by reducing greenhouse gas emissions, but that we should instead focus our efforts on adapting to "all dangerous climatic events however caused."  While adaptation is a necessary step due to the impacts from already-caused climate change, adaptation alone is an insufficient response.  As we frequently quote Lonnie Thompson saying about the consequences of human-caused climate change,

"The only question is how much we will mitigate, adapt, and suffer."

We simply cannot adapt to the probable catastrophic consequences of a continued business-as-usual path.  If these contrarians want to make a convincing case that the consequences will not be bad and adaptation is sufficient, they need to make the case in the peer-reviewed scientific literature, as mainstream climate scientists do.  It would be foolish to be convinced by a letter published by a list of non-experts in a newspaper, full of false, long-debunked, and unsubstantiated assertions.  The public deserve better from scientists.

0 0

Printable Version  |  Link to this page

Comments

1  2  Next

Comments 1 to 50 out of 59:

  1. Given the transparency - and increasing desperation - of their tactics I suspect pre-bunks (of bunkum!) are going to be with us for a while. The chart with the McLean prediction cracks me up every time!
    0 0
  2. Is this a worldwide phenomenon? I noticed a very effective rejoinder in yesterday's Irish Times to a letter from a faux-sceptic with many of the points made in the post. Irish Times Letter The rejoinder is authored by a physics lecturer at Waterford IT.
    0 0
  3. If the pseudoskeptics had a real case, they'd be presenting it in the literature. Of course, they don't, but to cover that they have the ready-made excuse that we saw on the El Niño thread: "gatekeeping" allegedly keeping their papers from being published.
    0 0
  4. For climate denialists, the preferred route by which to air their grievances about global warming is not via the scientific peer-review process, but rather through opinion letters published in the mainstream media. It would be foolish to be convinced by a letter published by a list of non-experts in a newspaper, full of false, long-debunked, and unsubstantiated assertions. The public deserve better from scientists. 1 2 To my knowledge no papers has been peer reviewed & published on Hurricane Sandy, yet it was OK for SKS to have multiple post (just 2 of the 5?) above with news stories claiming GW's effect on Sandy. Can't have it both ways & be credible IMO.
    0 0
  5. Clyde @4, you might want to try reading the SkS Sandy post, which contains references to a ton of peer-reviewed studies. The other stories you reference that we linked to are just that - news stories, not letters by scientists advocating a position on climate mitigation.
    0 0
  6. The other stories you reference that we linked to are just that - news stories, not letters by scientists advocating a position on climate mitigation. My point exactly. Those (OK some/most of those) new stories wasn't written scientists. Their non scientists advocating a position on climate mitigation. If not directly, then indirectly. Can anybody proof what Sandy would have been if GW was smaller? They can "speculate" that she wouldn't have been as damaging as she was. Would a few cm lower seal level helped her be less damaging? Would .06 degree cooler water made much of a difference?
    0 0
  7. @Clyde #6: I highly recommend that you read the following two articles. The Science behind Superstorm Sandy’s Crippling Storm Surge by David Biello, Scientific Amterican, Nov 7, 2012 Sandy’s Storm Surge Explained and Why It Matters by Micael Lemonick, Climate Central, Oct 29, 2012 These articles will provide you with a basic understanding of the mechanisms of storm surges and why the height of the sea relative to the shoreline plays such a critical role.
    0 0
  8. Would a few cm lower sea level helped [Sandy] be less damaging? A few centimeters of water: More or less damaging than those same few centimeters less? Water is sort of a binary thing when it comes to it being inside homes; even the first centimeter of water inside a house makes a world of difference.
    0 0
  9. I strongly object to the practice of insreting short and "naked" and pointless links as Clyde did @4. As I understand the comment policy, every link must be accompanied by a comment and explanation that suggests the commenter has read the link and ideally should help other readers to understand the science. Inserting two numbers and hand waiving as in Clyde@4, not only means nothing to me but annoys me and wastes my time. If I was Clyde, and I wanted to make his point, I'd at least check the articles (not too many, some 5-10 of them) in the posts linked and listed the source newspapers herein with my comment about the credibility/associations of each nwespaper. That would help the readers forming an opinion. But, with the "skeptic" background, Clyde is expressing here, the useless hand waving as seen @4 is the typical modus operandi.
    0 0
  10. Clyde @6 - again, read the link I posted @5, where I answered the questions you're asking. If you're not going to bother to read the links provided to you then there's not much point in continuing a one-way discussion.
    0 0
  11. I often wonder what it will take for people like Clyde to even consider there might be human-induced climate change, in the absence of natural causes. The climate is made up of weather events. Climate change is their duration, severity and their frequency. I can only speak for where I live, but the pattern is world-wide. In Australia, the following are “some” of weather-related events in the last three (3) years. # Victorian “firestorm” bushfires killed 173 people and burnt down over 2000 homes. It was hotter in the howling winds than out and; # A 1,000 kilometer-long thick chocking red-dust storm swept from central Australia, across the east coast and went as far as New Zealand and; # Record Queensland, New South Wales and Victorian floods that caused a “tsunami” on top of a mountain range. These floods required a national flood levy to be set up by the federal government and; # Category 5 cyclone Yasi slammed into North Queensland and; # Record- breaking sea temperatures in the oceans around Australia and; # Record-breaking dry period in central Australia -147 days and; # Record-breaking land temperatures around Australia, with record temperatures for November in parts of Victoria only 2 days ago. The clear evidence shows no sign of slackening.......
    0 0
  12. @dana1981 - 10 Hyper linked from the link you claim i never read. But the issue is far from settled, and climate change is not the only factor. For example, while sea surface temperatures are currently about 3 °C above average along the Atlantic coast, the expected increase due to global warming is just 0.6 °C, according to Kevin Trenberth, a climate scientist at the National Center for Atmospheric Research in Boulder, Colorado. So while the changing climate certainly plays a role, Trenberth says, there is plenty of space for natural variability. Looks like Trenberth agrees with me. Nobody can say how much a role GW played. On the link you claim i didn't read. "While it’s impossible to say how this scenario might have unfolded if sea-ice had been as extensive as it was in the 1980s, the situation at hand is completely consistent with what I’d expect to see happen more often as a result of unabated warming and especially the amplification of that warming in the Arctic" Trenberth said that the null hypothesis would be that the negative North Atlantic Oscillation was just part of the oscillation's natural phases, and at present the influence of polar warming was speculative. There is actually a fairly simple answer to this question: human-caused climate change amplified the hurricane's impacts. My question is by how much? If there was no GW would Sandy's damage been mild compared to what is actually was? So for news article to say GW caused Sandy to do X amount of damage is "Gish Gallop." I'm not saying GW had zero effect on Sandy. I'm just saying it can't be proved how much of an effect it did have, nor can it be proven what Sandy would have been like say in 1980. Was the climate a whole lot different in 2011? Why didn't Irene turn into a Sandy?
    0 0
  13. The Financial Post article also contains a claim that "The NOAA “State of the Climate in 2008” report asserted that 15 years or more without any statistically-significant warming would indicate a discrepancy between observation and prediction. Sixteen years without warming have therefore now proven that the models are wrong by their creators’ own criterion." This doesn't seem like a correct reading of the NOAA report. The claim from NOAA seems to be that an _observed_ 16-year trend of zero (or negative) warming would deviate statistically from the model. The FP article claims instead that any trend non-significantly different from zero (no matter how positive) invalidates the model. That is something quite different, and in the denialist's favour. (the NOAA report is linked from the FP article. See p23-24 in the report.)
    0 0
  14. Clyde: Can anybody proof what Sandy would have been if GW was smaller? I presume you are aware of the rhetorical device of deliberately asking an unanswerable question (for example by comparison to a hypothetical), and then drawing a conclusion from the fact that the question is unanswered? Let me respond with a very concrete and answerable question: According to Munich Re by what factor have weather and climate related disaster losses increased compared to earthquake losses when comparing the period since 2000 to the period before 1980?
    0 0
  15. In the Wikipedia article, Clyde@14 has linked to, Trenberth is quoted:
    "The answer to the oft-asked question of whether an event is caused by climate change is that it is the wrong question. All weather events are affected by climate change because the environment in which they occur is warmer and moister than it used to be."
    And he goes on to explain the differences between weather and climate. The fact that after having read it (supposedly), Clyde continues to ask a question of "proof what Sandy would have been if..." indicates that Clyde did not understand own link! We all know the basic difference between weather and climate predictions: weather is about extrapolating the current precise conditions into the short future, climate is about modelling the average long-term conditions. Clyde's question does not make sense because it confuses/contradicts weather terms with climate terms (especially this silly "proof, what if" requisition made me laugh big times!), while Kevin's question is a very reasonable question about an average fingerprint of a changing climate.
    0 0
  16. It is pretty describing that out of the 17 denialists mentioned in the article, no less than three of them (Giæver, Humlum, Solheim) all come from a tiny, semi Arctic country with a population of not much more than 4 million. These disinformers get quoted frequently in the national press, while those top level climate scientists who produce real science (Benestad, Drange, etc) rarely get any mention and have their replies to the frequent denialist Op-eds censored, etc. 2012 was a game changer in the US, and it looks like the population finally woke up, thus the increased desperation of the denial industry. For Europe, and especially Northern Europe, the opposite is the case. A cold and wet summer has now been replaced by frigid winter conditions, due to the negative NAO. As a result, denialism is thriving.
    0 0
  17. As soon as you see "no significant warming since xxxx", you know you are dealing with the undead.
    0 0
  18. [snip] The GISS SAT record in red appears to end in 2010. I realize it is a centred running average, however the trace could have been extended to 2011, assuming the smoothing was less than 18 months or so. The record should turn sharply down after 2010 but this part of the trace is ommitted.
    0 0
    Moderator Response: [RH] Snipped per policy.
  19. Klapper @18... Do you believe that would change the overall conclusion of what the graph is presenting?
    0 0
  20. Rob Honeycutt @19: Why not show the downturn then? Who's going to to offer up the reason the temperature graph was terminated on a high point (2010), while the forecasts continued to 2011?
    0 0
  21. Rob, This gets so tiring. Is there anything that is not construed by certain types -- let's call them D'ers -- as part of some vast conspiracy?
    0 0
  22. Klapper @18&20, the most recent years data is not shown in figure 5 for the simple reason that it was prepared in Oct 2011, and only used data to that date. Preparing these graphs is time consuming, unfortunately, slanders to the effect that SkS authors are paid for their efforts are in fact false. Dana's herculean efforts are unpaid, and he must find the time for them between the hours spent in paid employment and independent (peer reviewed) academic research. Consequently graphics are not updated with every reuse, nor with every update of the data source. As it happens, if you do prepare a graph of Gistemp with a 12 month running mean, the result is effectively the same as the pink line in figure 3 above. The decline in temperature is so slight that all of the denier predictions other than Akasofu's are still falsified by the data, and Akasofu's prediction is running on the edge of falsification. If you account for volcanic, ENSO and solar influences (as in the red line in figure 3), it is clear that the temperature increase has been accurately predicted by the IPCC TAR and AR4, and not accurately predicted by any denier. In the meantime, I am left wondering, how often will it be necessary to state the obvious: La Nina events are not the same as the onset of the next ice age. That is so obvious a point that you would think that just once deniers would extract the ENSO signal before discussing whether temperatures have increased or not.
    0 0
  23. Klapper @20... You didn't answer my question. Would it change the conclusion of the graph? If not, why does it matter?
    0 0
  24. Tom Curtis@22: The pink line in Figure 3 terminates outside what is probably the "ensemble envelope" (the green shade). Your reasoning is that La Nina's are responsible but these events don't count in the longer term. I'm not so sure that is true. I think the major oscillations advance temperature (or not) by changing the ratio/frequency of El Ninos to La Ninas. If I am wrong then there is no need to compensate for ENSO since there will be no secular trend in it after you get past 15 years of trend length or so. As for volcanic influence there is none significant in the last 17 years or so. As for solar, 2013 will be getting into the peak of cycle 24, although it is a weak cycle. All this leads into a prediction for 2013 which Dana has made (GISS = +0.76). I'm not sure if he's going to update that based on the most recent ENSO prediction, but I don't believe 2013 will be that warm. It would be a record by quite a lot. Either way it will be a test of the hypothesis the real warming trend is being suppressed by ENSO/TSI.
    0 0
  25. Rob Honeycutt@23: The truncation at 2010 does change the strength of your argument, subtle as the change might be. Tom Curtis had a reasonable explanation. Turn the question the other way around. Imagine you saw a graph published by a skeptic which truncated the data a year short of the record, when you knew that year showed a nice bump in temperature. You would likely want to know why, even if it seemed like a minor point.
    0 0
  26. Dana's prediction assumed an El Nino which looks unlikely, so yes, I would say prediction has to be revived. However, while La Nina is predominate at the moment (which stores heat), are you betting El Nino's arent going to happen? When we get one with an index greater than 1, I'd say that will blow the records out of the water regardless of where in hte solar cycle (but not volcano).
    0 0
  27. My only prediction was that 2013 will break the annual average surface temperature record. The 0.76C anomaly was a projection based on a particular solar and ENSO scenario. I should probably revise it with more updated data, now that it appears we will get a weak El Nino at best.
    0 0
  28. Klapper #24: For Figure 3 (Fig 1 from Rahmstorf et al 2012) you're guilty of comparing an individual realisation (what we see on Earth) with ensemble means of dozens of model projections. Ensembles of model projections smooth out El Nino/La Nina occurrences, as in the model the El Ninos don't all happen at the same time - this smoothing reveals the forced component of climate change. The trajectory on Fig 3 is ensemble means with their uncertainties, essentially just the forced component of climate change. Unforced year-to-year variations, such as ENSO, which do not have a long-term warming or cooling impact, will vary widely about the forced component of climate change. If you've ever looked at a spaghetti chart of individual model realisations and compare them to the ensemble means, you'll see this. Uncertainties on the range of the ensemble mean must not be confused with uncertainties about the range of temperature for individual ensemble members. The former are much, much smaller than the latter in the short term. Perhaps an analogy, relevant to those who have lived through the topsy-turvy weather in Melbourne, Australia over the past week. November temperature in Melbourne is on average (think ensemble mean) 22.5C. The standard deviation of November averages is 1.4C, so common November max temperature monthly averages range from 21C to 24C. This is like the coloured bands in the Foster et al figure. It might be somewhat akin to decadal global temperature averages, smoothing out the year-to-year variation. December's average is 24.5C (std dev 1.7C), indicative of the warming trajectory between the two months, and akin in this analogy to the global warming we expect over the next decade or so. This year, November's mean temperature (one realisation of the ensemble mean), was 23.3C, nicely within the 1-sigma band. But individual temperatures in November (akin to one single realisation of global temperature at one point) range a greast deal beyond those bounds. For example last week we baked in 39C, today it's just 18C, on Saturday it will be 37C, a few days later it will be back to 20C. These are the daily temperature equivalents of El Nino and La Nina, for Melbourne our "El Nino" is when a north wind blows off the hot continent, and our "La Nina" is when the wind blows off the relatively cool Southern Ocean. The highest single November daily max temperature in Melbourne (1980-2011 data) is 40.3C, the lowest is 12.7C. Does that invalidate the ensemble mean, and the tight uncertainty surrounding it? Of course not! Foster et al show that the general trajectory of global warming is exactly where you'd expect (or the IPCC expects) it to be, despite the swash and backwash of individual El Nino/La Nina events on either side of the trend. Melbourne's temperature is on track where we expect it to be for this time of year, despite the individual swash/backwash of hot and cool days. For global temperatures, we're right where we expect to be having just had a double-dip La Nina, and I would suspect ENSO-neutral conditions will take us pretty close to record temps next year. A question for climate analysts out there .... Has the global temperature record ever been broken in an ENSO-neutral year? I suspect not, but the unusual combined pattern of ENSO and solar activity from 1997 to present, alongside continued rising CO2 forcing, makes this possible next year.
    0 0
  29. Ever notice how these meticulous folks claim there has been no warming, but never seem to offer an explanation for where all the trillions of calories of heat incrementally added to the system by the Greenhouse Effect may have wandered off to. Cloud Cuckoo Land? Teleported to Venus? Should that not be our first question to these highly ethical gentlepersons?
    0 0
  30. Klapper @25... No, actually, it has very little impact on the conclusions, if any at all. And, in fact, if we were to turn the question around and apply it to a "skeptical" argument I might wonder why there was a truncation and I might look into it. If it did not change the overall conclusions I would certainly not make any accusations of deceit as you did.
    0 0
  31. Dana1981@27: I looked at your Table 1 from the March post on 2013. I was attempting to reverse engineer to see what baseline you were using for the GISS anomaly. I regressed the observed vs predicted anomaly and got an RSQ'd of 0.29 (2001 to 2011 inclusive). However, looking for the baseline by backcalc'ing from the predicted number and ENSO/TSI/CO2 adjustments, I got a jumble of numbers. If I took the baseline to be 0.427 and redid the prediction through straight addition of your by year adjustments I got a much better RSQ'd (0.63), quite impressive actually. I may have made an error, or your formula may have exponents or coefficients I don't know about. Either that or Table 1 has some errors.
    0 0
  32. Gingerbaker - "Cloud Cuckoo Land? Teleported to Venus? " Well interesting answers. Favourite would be "sensitivity is low - usually needs a magical negative feedback (Spenser, Lindzen like clouds) or a belief that empirical data has somehow disproved Clausius–Clapeyron. Or perhaps more reasonably that a sensitivity of 2 "isnt that bad" (better than taxes or anything else that might interfere with "freedom" or change lifestyle). Non-physicists can always claim acceptance of 1st and 2nd law but then fail to translate into more complicated physics. The latest we have seen here is "LW doesnt warm the oceans because it only penetrates a few microns". In short, a lot of people more interested in finding some plausible excuse for doing nothing than facing reality. My favourites are those who hold to a political ideology more strongly than a commitment to reality. The argument goes like this. "Solutions for AGW violate my political ideology ergo AGW doesnt exist" rather than trying to find a solution within their ideology. Basically an admission of a bankrupt political ideology.
    0 0
  33. Non-physicists can always claim acceptance of 1st and 2nd law but then fail to translate into more complicated physics. The latest we have seen here is "LW doesnt warm the oceans because it only penetrates a few microns".
    And that includes such skeptic luminaries as Bob Tisdale, seen in response to KR on comment #134 on this thread... Physics... Who needs it when you can doubt anything!
    0 0
  34. At least Ivar Giæver is honest about where he gets his funding: He admits to being sponsored by Statoil (the worlds 13th largest oil company). He says so in his Bio at the Nobel prize organization website: http://www.nobelprize.org/nobel_prizes/physics/laureates/1973/giaever-bio.html
    0 0
  35. Reading Ivar Giævers newspaper Op-eds, one of his main arguments for AGW not being a problem is that despite the grave warnings from environmentalists and scientists, Ozone depletion and acid rain turned to be non-issues (according to him) since we don't hear much about those problems any more. This from a Nobel Prize winner. You can't make this stuff up.
    0 0
  36. Oh, jeez...wrong thread for my comment @36, re: "We will see if Bob returns...... Kevin C, stunning work! This entire thread has been most illuminating and educational." Yoop/mod-on-the-beat, could you please delete that part, here, and move it to the Tisdale/ENSO thread? That's what I get for having eleventy windows open at once...;)
    0 0
    Moderator Response:

    [Sph] We can delete what's here, but we don't have tools to easily move comments (yet, look for it in 2013). You should re-enter the comment in the right place, and when you do, I'll delete these.

    [DB] First comment is deleted; please repost on the correct thread per SPH.

  37. It is obvious to most people that this denialist petition is nothing more than a publicity stunt prior to the United Nations Climate Change Conference in Doha. That said, I am surprised the denialists continue with the childish notion that an increase thermal energy immediately translates into greater temperature. As most people with a secondary school diploma already know, one calorie of heat is required to raise the temperature of one gram of water by one Celsius degree. These students also know that 80 calories are required to convert one gram of ice to one gram of liquid water. If the average global temperature has not increased as fast as century trend-line projections then you need only look for melting ice to locate the missing thermal energy. The arctic, which is melting at an unprecedented rate, is the likely culprit but what will happen to global temperature when all the ice has melted?
    0 0
  38. Did Tom Harris actually vet those who signed the letter? One was banned from WUWT for carpet bombing the site with his nutty views of the sun. (Watt's words, not mine). But as someone who worked with children for all of his professional career, I find this person's past to be rather unsavoury. (That is a meiosis.)
    0 0
  39. jackdale @38 - it really doesn't seem like it. They were clearly going for quantity over quality in the letter signatories, similar to the Oregon Petition. They try to get big numbers on these lists, but to do that you need to have really low standards, because nobody who knows anything about climate would sign such utter nonsense.
    0 0
  40. daba@39 It interesting who did not sign it; Curry and Spencer being the most conspicuous. I assume that would have been asked.
    0 0
  41. Indeed jackdale, no Lindzen, Spencer, Christy, Curry, etc.
    0 0
  42. [Unproductive insult snipped]
    0 0
    Moderator Response: [d_b] Please contribute comments at Skeptical Science to the extent you're able to further the conversation in a productive manner. If you're not able to be a useful part of the conversation, this is not a good place to spend your time writing comments.
  43. Dang - I missed Brian's argument. I'm guessing it was Heartland par for the course: blah blah hoax blah blah liberal commie blah blah.
    0 0
  44. DSL@43 You can read the snipped text since it has only been commented out in the HTML. View the page-source. Sorry, can not contribute anything else of use to this thread.
    0 0
  45. After doing so, I find that Brian's argument is one of the more cogent I've seen from a Heartland shill. And the more passionate elements of the assertion (about 99% of the comment) are, coming from an expert like Brian, quite the compliment. Everyone, a big shout out toward the apparatchik hives of greater DC! Alas, I suspect this will be deleted, since it is in response to a deleted comment. However, perhaps this request will be left: Brian, can you explain why you once felt it necessary to claim that "I'm a thorough carbon dioxide climate change denialist and I wouldn't believe in carbon dioxide induced climate change at gunpoint - because it is physically impossible." Now that's a good, skeptical, open mind at work.
    0 0
  46. Why certainly, Mr Digital Subscribers Line, happy to oblige. You must first give me your interpretation of the "atmospheric greenhouse effect." There are numerous of them (Hansen, AMS, Ramanathan ...) Pick your favorite, and I will show why the reasoning is false. Will you change your opinion about the effect if you are shown why your interpretation cannot be valid? (-snip-). I will only do this exercise once.
    0 0
    Moderator Response: [DB] Inflammatory tone snipped.
  47. When you answer, answer in the right thread. There are a variety, and navigation is easy. Let's just go with the standard greenhouse effect: CO2 absorbs/emits at pressure-broadened bands in the thermal infrared range, the range within which the sun-warmed earth emits. Increasing atmospheric concentration of CO2 means greater likelihood that radiation will be absorbed before being radiated to space. Once absorbed, conduction or re-rediation can occur, but the direction of re-radiation is random, and the process repeats until the energy is transformed or is radiated to space. Increasing atmospheric CO2 therefore effectively decreases the cooling efficiency of the climate system. Oceans store energy via GHE by skin temp increase, preventing the sun-warmed top meter (or so) from cooling as much convectively. Oceans also warm via GHE indirectly through a variety of mixing and land-interaction processes. That CO2 is a greenhouse gas and does result in downwelling longwave radiation has been instrumentally verified (e.g. Puckrin et al. 2004, among others). And of course the satellite inference and decades of lab work and practical application. I don't know what direction you're going to take this, so I can't suggest an appropriate thread for your response. I'm all ears with an open mind. If you can show me how increasing atmospheric CO2 does not result in greater energy storage within the climate system, I'll be a very happy person.
    0 0
  48. Hmm, given that Ramanathan, Hansen believe in same GH effect (modern codes build on Ramanathan), I have a bad feeling about this. Is this going to be: AGW violates 2nd law of thermodynamics (please read extensively into thread and also do the textbook stuff at Science of Doom) the greenhouse effect has been falsified Postma has disproved the greenhouse effect Or something novel? Please no "slaying the sky dragon" stuff. This is a science site.
    0 0
  49. I think we need to be careful here, Hansen's and Ramanathan's interpretation are not quite the same. Hansen describes it as radiation increasing from higher levels in the atmosphere to maintain an equilibrium with (outer space), Ramanatan does not. Keep in mind too, that the oceans are not in equilibrium with the atmosphere, surely, as ocean evaporation takes place - and this is the bulk of the heat transfer of the ocean to drive the ocean temperature towards the air temperature. According to the World Meteorological Organization climate is defined as "Synthesis of weather conditions in a given area, characterized by long-term statistics (mean values, variances, probabilities of extreme values, etc.) of the meteorological elements in that area“ (International Meteorological Vocabulary. Sec. ed. WMO-No. 182. Geneva, 1992). However, what is considered in the center of this climate disputation: the globally average near-surface temperature of about {T} =288 K. This temperature has, if at all, only a minor physical relevance. Most explanations of the so-called atmospheric greenhouse effect are related to temperature {T}. The explanation of the American Meteorological Society, for instance, reads: “The heating effect exerted by the atmosphere upon the Earth because certain trace gases in the atmosphere (water vapor, carbon dioxide, etc.) absorb and re-emit infrared radiation. Most of the sunlight incident on the Earth is transmitted through the atmosphere and absorbed at the Earth's surface. The surface tries to maintain energy balance in part by emitting its own radiation, which is primarily at the infrared wavelengths characteristic of the Earth's temperature. Most of the heat radiated by the surface is absorbed by trace gases in the overlying atmosphere and reemitted in all directions. The component that is radiated downward warms the Earth's surface more than would occur if only the direct sunlight were absorbed. The magnitude of this enhanced warming is the greenhouse effect. Earth's annual mean surface temperature of 15°C is 33°C higher as a result of the greenhouse effect than the mean temperature resulting from radiative equilibrium of a blackbody at the Earth's mean distance from the sun. ..." These 33 K are based on physical nonsense because the temperature of the so-called planetary radiative equilibrium, T_e = 255 K, and the globally averaged near-surface temperature are two completely different temperatures. The temperature T_e = 255 K is computed using a planetary albedo of 30 percent. This value, however, is only acceptable for the entire earth-atmosphere system. For an earth in the absence of an atmosphere for which this 255 K should be valid, the planetary albedo should be much lower. This was already discussed by Budyko in his textbook on climatic change published in 1977. Another requirement is that the surface temperature is homogeneously distributed over the entire planet. We know that this is wrong even in case of the earth having an atmosphere. If we perform the same calculations for our moon, we will obtain a temperature of T_e = 270 K for a planetary albedo of 12 percent. This is more than 55 K higher than the value determined by Monstein (2001) using remote-sensing-techniques (see attachment). More than 60 years ago, there were also remote-sensing observations, the results were higher than those of Monstein, but 30 K lower than T_e = 270 K. Consequently, we may conclude that this prediction of a temperature of a planetary radiative equilibrium is based on assumptions that are not fulfilled and the results notably disagree with observations. Often, it is stated that the moon is an inappropriate instance because of its slow rotation velocity. If this would be true (it is not), why did Pierrehumbert use this formula in case of the Venus (see his physics today paper, 2011)? The rotation velocity of the Venus is four times lower than that of the moon. It is interesting that the Enquete Commission of the German Parliament "Schutz der Erdatmosphere" (Protection of the Earth's Atmosphere) related in its report from 1990 these 33 K to various greenhouse gases by following Kondratyev. The explanation of the atmospheric greenhouse effect by Ramanathan et al. is not better. It is also related to {T} = 288 K. The authors argue that this temperature leads to a radiative emission of 390 W/m^2, but at the top of the atmosphere the emission into the space is only 236 W/m^2 . Thus, they argue that "the intervening atmosphere causes a significant reduction in the long-wave emission to space. This reduction in the long-wave emission to space is referred to as the greenhouse effect." This argument is unacceptable of two reasons: First of all, the power law of Stefan and Boltzmann cannot be applied to an averaged surface temperature because it is based on two integrations, namely the integration of the Planck over all wavelengths (or frequencies) and the integration over the adjacent half space. The latter is an integration over a vector field. Secondly, the globally averaged surface temperature has no physical meaning in the global energy budget for the earth-atmosphere system. In the well-known figure of Trenberth et al there is an energy budget for the earth's surface. The so-called net radiation in the infrared range (emitted radiation minus down-welling radiation) amounts to 63 W/m^2. This value serves to "warm" the atmosphere, but not the surface. It is much smaller than the sum of the fluxes of sensible and latent heat that also warm the atmosphere. Warming means the increase of the total internal energy of the atmosphere. If the down-welling infrared radiation is related to a temperature of the atmosphere, T_a, as commonly done in so-called Dines-type two-layer energy balance models for the earth-atmosphere system, one can determine this net radiation in the infrared range by many pairs of {T} and T_a values. So far these problems deal only with the definition of the "greenhouse effect." The absolute misunderstanding comes from the consequence of what the "greenhouse effect" must imply. If higher levels of the atmosphere (stratosphere) must cool in response to the effect, then heat transfer by radiation from lower levels to higher levels in the atmosphere necessarily increases, as the temperature differences increase, by assumption. Thus some sort of "decreased heat transfer" from the low levels to the higher levels cannot possibly be true. Furthermore, any radiation imbalance caused by this disturbance will (eventually) be equilibrated by molecular conduction. True, the component of molecular conduction is small, and convection effects are negligible. Nevertheless this phenomenon happens over the same time period that the radiation effect of CO2 in the atmosphere is assumed to warm the surface. The Earth and its atmosphere are an open system. The consequences of radiation heat transfer are different in an open and a closed system. This is where the problem comes in, and the misunderstanding of what the "greenhouse effect" must imply in an open system
    0 0
  50. I'm a signatory to the "denialist letter" (your terminology). There are REASONS for this. This is not simply "ad hoc negativism"
    0 0

1  2  Next

You need to be logged in to post a comment. Login via the left margin or if you're new, register here.


The Consensus Project Website

THE ESCALATOR

(free to republish)


© Copyright 2024 John Cook
Home | Translations | About Us | Privacy | Contact Us