


 Arguments


The connection between Hurricane Sandy and global warming
What the science says...
There are several ways in which human-caused global warming contributed to the damage caused by Hurricane Sandy - by causing higher sea levels (bigger storm surges and flooding), warmer oceans (a stronger hurricane), and more moisture in the air (more flooding).
Climate Myth...
The connection between Hurricane Sandy and global warming
"The magnitude of ignorance on display by people claiming Sandy is a sign of global warming is stunning!" (Joe Bastardi)
Hurricane Sandy was an unprecedented storm in modern times, arriving late in the hurricane season, making landfall abnormally far to the north on the US east coast, with an exceptionally low pressure, and a record-breaking storm surge. The hurricane also had among the most kinetic energy of all tropical cyclones on record at 222 trillion Joules (the equivalent of 3.5 Little Boy Hiroshima atomic bombs) - more energy than Category 5 hurricanes like Katrina despite Sandy just being Category 1, because Sandy was spread over a much larger area.
Given the unprecedented nature of this event, many people are asking whether it was caused by or its impacts amplified by global warming, and many others are of course trying to deny any hurricane-climate links. There is actually a fairly simple answer to this question: human-caused climate change amplified the hurricane's impacts.
Higher Sea Levels Cause Bigger Storm Surges
One reason we can draw this conclusion is that as Michael Mann noted, sea levels around the New York area are now close to 1 foot higher than they were a century ago. For example, Figure 1 shows the annual mean sea level rise since 1900 for Battery Park, New York from tide gauge data.
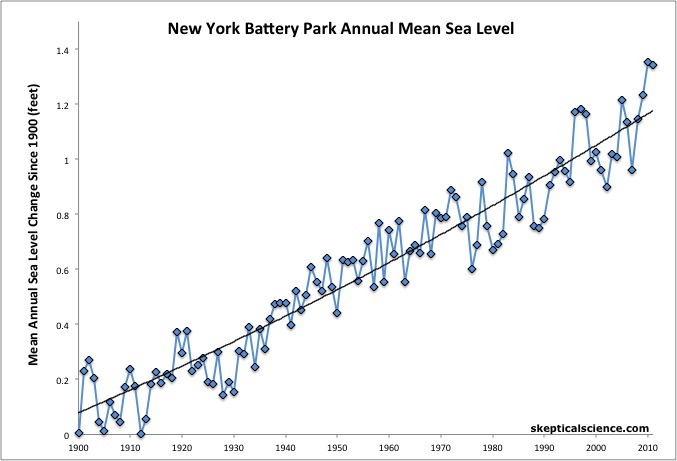
Figure 1: Annual mean sea level rise in Battery Park, New York from Permanent Service for Mean Sea Level (PSMSL) tide gauge data.
While Battery Park represents just one tide gauge, there are many other tide gauges in the region which tell a very similar story, as you can see at the PSMSL site. And of course we know that the global sea level rise (approximately 0.6 feet since 1900, on average) is predominantly caused by melting land ice and the thermal expansion of the oceans. As Church et al. (2011) found, approximately 40% of the average global sea level rise since 1972 is due to thermal expansion, and approximately 60% due to land ice melting (Figure 2), both of which in turn are predominantly driven by human-caused global warming.
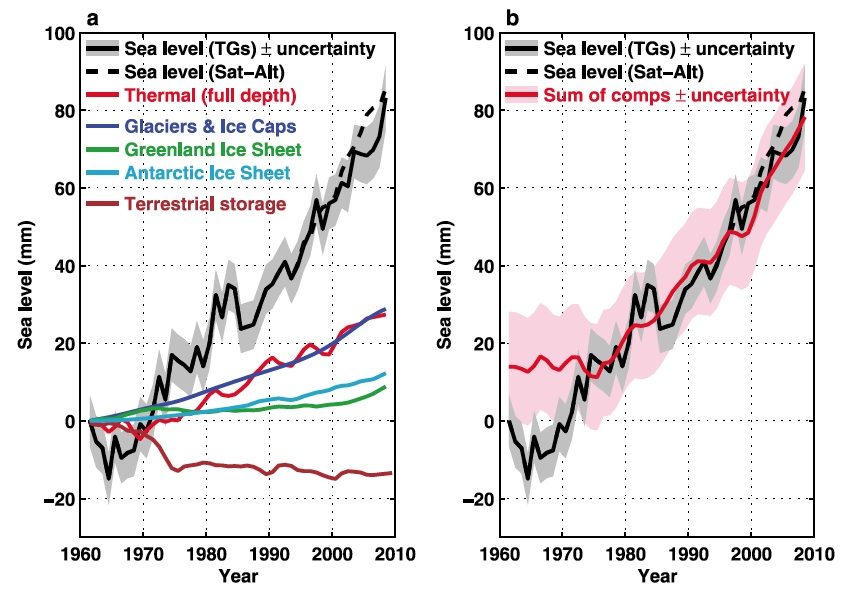
Figure 2: The global sea level budget from 1961 to 2008. (a) The observed sea level using coastal and island tide gauges (solid black line with grey shading indicating the estimated uncertainty) and using TOPEX/Poseidon/Jason‐1&2 satellite altimeter data (dashed black line). The two estimates have been matched at the start of the altimeter record in 1993. Also shown are the various contributing components. (b) The observed sea level and the sum of components. The estimated uncertainties are indicated by the shading. The two time series are plotted such that they have the same average over 1972 to 2008. From Church et al. (2011).
Looking into what we can expect for the impact of future sea level rise on hurricanes, Lin et al. (2012) found that:
"The combined effects of storm climatology change and a 1 m [sea level rise] may cause the present NYC 100-yr surge flooding to occur every 3–20 yr and the present 500-yr flooding to occur every 25–240 yr by the end of the century."
So this human contribution to the Sandy-related damage is quite straightforward. This is what we know:
- Humans increased the greenhouse effect.
- The greenhouse effect caused the planet to warm.
- The warming planet caused land ice to melt and the oceans to expand.
- Melting land ice and thermal expansion caused average sea level to rise.
- Higher sea level made the storm surge worse than it would have been in the past, thus causing more flooding.
Warmer Oceans Fuel Hurricanes
As Katharine Hayhoe noted, Atlantic sea surface temperatures (SSTs) are also significantly warmer than they were a century ago as a result of human-caused global warming. Figure 3 shows global surface temperature anomalies for the period 2000 to 2011 compared to 1900 to 1910. SSTs over most of the Atlantic ocean warmed 0.5 to 1.0°C over that timeframe.
Figure 3: Surface temperature change (°C) from 1900-1910 to 2000-2011, from NASA GISS.
MIT hurricane expert Kerry Emanuel first proposed in Emanuel (1987) that warmer SSTs should lead to stronger hurricanes. Emanuel (2005) confirmed that hurricanes have grown stronger over the past several decades, in part due to human-caused global warming. As he put it in Emanuel (2012),
"In the North Atlantic region, where tropical cyclone records are longer and generally of better quality than elsewhere, power dissipation by tropical cyclones is highly correlated with sea surface temperature during hurricane season in the regions where storms typically develop"
As a result, hurricane strength and damage are projected to increase in a warming world (Figure 4).
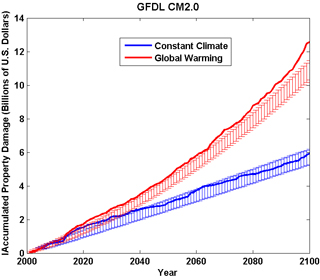
Figure 4: Accumulated damage from 2000 to the year on the x-axis using the the GFDL CM2.0 global climate model with climate held fixed at its 1981–2000 mean condition (blue) and under the global warming scenario associated with IPCC SRES Scenario A1B (red). The error bars shows one standard deviation up and down from the ensemble mean. From Emanuel (2012).
Elsner et al. (2012) confirmed that warmer SSTs feed stronger hurricanes, finding when mean seasonal SSTs are above 25°C
"a significant trend trend with increasing SST indicating a sensitivity of 7.9 ± 1.19 m s-1 K-1"
Elsner et al. and Knutson et al. (2010) also find that hurricanes will become stronger in a warming world.
"higher resolution modelling studies typically project substantial increases in the frequency of the most intense cyclones, and increases of the order of 20% in the precipitation rate within 100 km of the storm centre."
Again we have a very clear connection between human-caused global warming and impacts from Hurricane Sandy.
- Humans increased the greenhouse effect.
- The greenhouse effect caused the planet (including oceans) to warm.
- Warmer oceans feed stronger hurricanes.
However, note that during the hurricane event, SSTs along the coast were approximately 3°C above average, whereas global warming has increased SSTs by closer to 0.6°C. Thus as Kevin Trenberth notes, while global warming contributed to the hurricane intensity, so did natural variability.
More Atmospheric Moisture Causes More Rainfall
Kevin Trenberth notes that due to global warming there is now more moisture in the atmosphere than there was a century ago, which contributed to the flooding in the impacted areas, as Trenberth described:
"With every degree F rise in temperatures, the atmosphere can hold 4 percent more moisture. Thus, Sandy was able to pull in more moisture, fueling a stronger storm and magnifying the amount of rainfall by as much as 5 to 10 percent compared with conditions more than 40 years ago. Heavy rainfall and widespread flooding are a consequence."
This conclusion is consistent with the findings of Trenberth et al. (2005), which found that
"recent trends in precipitable water are generally positive and, for 1988 through 2003, average 0.40±0.09 mm per decade or 1.3±0.3% per decade for the ocean as a whole"
We have another fairly simple causal relationship here:
- Humans increased the greenhouse effect.
- The greenhouse effect caused the planet (including atmosphere) to warm.
- A warmer atmosphere can hold more water vapor.
- This allows hurricanes to pull more moisture from the atmosphere.
- More rainfall during the hurricane causes more widespread flooding.
Changing Weather Patterns Resulting from Arctic Warming
Francis and Vavrus (2012) found evidence that that the decline in Arctic sea ice and snow cover are linked to extreme weather, for example through more frequent blocking patterns. Liu et al. (2012) also found that "the decrease in autumn Arctic sea ice area is linked to changes in the winter Northern Hemisphere atmospheric circulation," which results in more frequent episodes of blocking patterns.
An atmospheric blocking pattern over Greenland, which may potentially be linked to this year's record low Arctic sea ice extent (though we can't say for certain), helped force the storm to make a left turn into the United States mainland. As Dr. Francis stated in an interview with Justin Gillis,
"While it’s impossible to say how this scenario might have unfolded if sea-ice had been as extensive as it was in the 1980s, the situation at hand is completely consistent with what I’d expect to see happen more often as a result of unabated warming and especially the amplification of that warming in the Arctic"
Extreme Weather on Steroids
The bottom line is that while global warming did not cause Hurricane Sandy, it did contribute to the "Frankenstorm" at least by causing higher sea levels (and thus bigger storm surges and flooding), warmer sea surface temperatures (and thus a stronger hurricane), and more moisture in the atmosphere (and thus more rainfall and flooding).
More importantly, as Francis noted and as many impacted residents are coming to realize, this type of extreme weather has and will continue to become more commonplace as the planet continues to warm. We know that many types of extreme weather events have already been linked to global warming, including hurricane intensity. A warmer world will "load the dice" and make extreme events, including strong hurricanes, more likely to occur. It's important not to lose sight of the long-term trends in arguing about whether or not climate change contributed to any single extreme weather event. As Dave Roberts notes,
"There is no division, in the physical world, between “climate change storms” and “non-climate change storms.” Climate change is not an exogenous force acting on the atmosphere. There is only the atmosphere, changing. Everything that happens in a changed atmosphere is “caused” by the atmosphere, even if it’s within the range of historical variability."
And as Stephan Lewandowsky put it,
"We are living with climate change.
It is happening now.
Debating the extent to which Frankenstorm Sandy was put on steroids by climate change is a distraction.
Nearly all weather events now have a contribution from climate change and it is up to us to manage and reduce that risk with mitigative action."
We often come back to the words of Lonnie Thompson, who said that climate change will result in some mix of mitigation, adaption, and suffering. So far we have failed to achieve significant mitigation of greenhouse gas emissions, and as a result, extreme weather events on steroids like Hurricane Sandy will cause more suffering than they would otherwise have, and we will have to adapt to a future in which these types of events occur more frequently. Unfortunately, as we saw in North Carolina, some science-denying policymakers are not even willing to implement the necessary adaptation measures. This type of denial will maximize future suffering.
Imagine a world where this type of extreme weather event happens once per decade instead of once per century. That's one small part of what we're talking about when we discuss the impacts of climate change.
Intermediate rebuttal written by dana1981
Update July 2015:
Here is a related lecture-video from Denial101x - Making Sense of Climate Science Denial
Last updated on 9 July 2015 by pattimer. View Archives


Tom13
Just a couple of comments on your views about contribution of sea level rise to hurricane Sandy. I think you have to be careful with your back of envelope calculation. You are assuming the global sea level rise since 1850 applies to the area struck by hurricane sandy. In fact rates of sea level rise can differ quite a lot regionally, so the 6% attribution is probably more likely.
And whatever the number its only going to increase in the future.
You claim "A) the 1 foot SLR since circa 1850 would only be partly attributable to AGW. As the the graph from the study note, there has been a reasonably steady rate of SLR since circa 800ad. A reasonable estimate of the SLR since circa 1850 would be less than 1/2 foot. Obvioulsy cant attribute the full 1ft to AGW."
Your understanding or information is wrong. Sea level rose from AD800 to around 1500 then fell until about 1900, then started rising as in the link below. This correlates reasonably well with burning of fossil fuels so all or nearly all this sea level rise can be attributed to fossil fuels.
www.realclimate.org/index.php/archives/2011/06/2000-years-of-sea-level/
Tom13:
You have a lot of brass asing me to produce citations when you never do.
Now you are just making things up. As nigelj has shown your claim "there has been a reasonably steady rate of SLR since circa 800ad" (with no citation) is simply fabricated from whole cloth. You have made a great many other unsubstantiated claims here at SkS.
Readers beware: Tom13 is simply fabricating his claims. I do not have time to look up citations to counter your fabricated data.
Nigelj: I was going to link to the realclimate post but I noticed you already had.
Sorry, this is the only reference I could find to hurricanes. My question is that it seems I've for read for years that there is no scientific consensus on increasing numbers of hurricanes but that there is consensus on growing intensity. Exchanging posts with a skeptic I failed to back the statement on hurricane intensity. The studies I've looked use modeling the future but as we know the word modeling only receives derision from climate skeptics. I couldn't find any actual proof that hurricanes have intensified. I couldn’t find any climate signals that support the premise.
I hope the more knowledgable people involved in SkS can provide more helpful information.
But I found the following by searching the internet for information about 'cyclone intensity' rather than the 'hurricane' sub-set term:
Intensity of tropical cyclones is probably increasing due to climate change
Even weak tropical cyclones have grown more intense worldwide – we tracked 30 years of them using currents
stranger1548 @9,
Perhaps a link to Kossin et al (2020) 'Global increase in major tropical cyclone exceedance probability over the past four decades' would assist.
More generally, idea that tropical cyclones will be fewer but more intense is a pretty basic finding when considering the impacts of a warmer climate. While the warmer seas will cause cyclones to reach higher intensities, the fators which assist in cyclone formation are reduced (cyclones being kilometer-high funnels built of nothing but swirling air).
Perhaps it is worth mentioning the problems of deciding if a storm in, say, the 1890s or even the 1950s reached Force 3 or even whether the number of storms in the early record is significantly wrong. Thus with reliable records stretching back just fifty years (so using satellite data) it is very easy to argue that any trends found in the records of storm numbers are just some form of natural variability. Where I think such argument can be dismissed is in the seasonal ACE data. The graphic below is a couple of years out of date (snatched from Wikipedia which also has an interesting graph plotting PDI & SST and which also needs updating [PDI is similar to ACE but for landfall cyclones]), with 2021 ACE=145 and 2022 ACE=95, thus 2022 breaking the run of "above normal" seasons. So over the full record back to 1850, we see 46 of these "above normal" seasons in the North Atlantic (the graph below only shows back to 1950) with 18 of these in the last 30 years and just 28 in the 143 years 1850-1992. And it is pretty-much impossible to find anything approaching the run of six "above normal" seasons 2016-21 in the earlier records, this accounting for the potential for any significant errors in those records.
Thanks MA Rogers and OPOF.