


 Arguments


Cliff Ollier: Swimming In A Sea of Misinformation
Posted on 17 April 2012 by Rob Painting
One of the benefits, it seems, of being a 'skeptic' scientist is never having to bother with the time-consuming chore of actually researching the subject you're writing about. One might also expect some degree of reason, logic, and coherency from someone with a background in science, but all too often these rather fundamental requirements are sadly lacking when these 'skeptic' scientists comment publicly.
A recent example of this is an op-ed written in The Australian by Cliff Ollier, a retired Australian geology professor, where he makes numerous erroneous claims about sea level rise. It seems Ollier's comments were prompted by the Port Macquarie Hastings Council's recent proposals, an acknowledgement of the threat of future sea level rise to low-lying coastal properties.
If some of the territory I'm about to cover seems awfully familiar to long-time SkS readers, that's because we've covered the same topics many times before. But, as always, it's necessary to cover some background to fully appreciate the scientific basis for concern over future sea level rise.
Acceleration of sea level rise is a historical fact
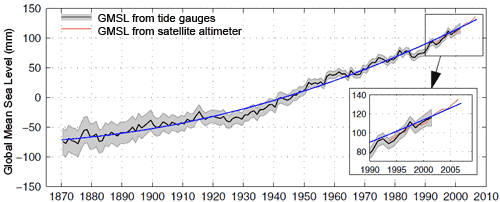
Figure 1 - acceleration of sea level rise from the late 19th century to 21st century. From Church (2008).
Sitting atop the Antarctic and Greenland continents are immense sheets of ice kilometres thick. So much water is locked up in those ice sheets that, if they were to completely melt, they would raise global sea levels about 65-70 metres. That the ice sheets will melt with further global warming is not in serious dispute; the issue is how fast we might reasonably expect them to melt, and how fast might sea level rise as a consequence.
Looking at the 20th Century we see that an acceleration of global temperatures during the century was, not surprisingly, accompanied by an acceleration of global sea level rise (Figure 1). See also Merrifield (2009) and Church (2011). And looking further back in time we find that this acceleration in sea level rise extends back to the 18th/19th century (Figure 2), coinciding with the start of the Industrial Revolution.
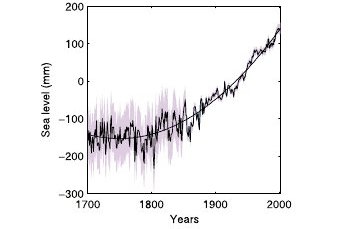
Figure 2 - Sea level reconstruction since 1700 from Jevrejeva 2008. Shadow represents the errors of the reconstruction & fitted curve is a second order polynomial fit.
To put this into deeper historical context, it's important to realize that global sea levels have been rising since the immense continental icesheets of the last Ice Age (Glacial Maximum) began to melt around 20,000 years ago. But the rate of sea level rise had been gradually tapering off until this recent surge in sea level rise. Figure 3. 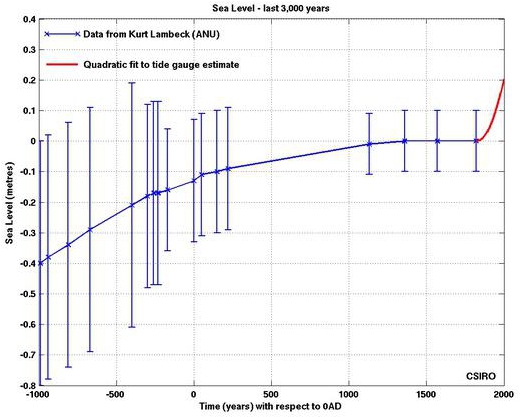
Figure 3- global sea level rise over the last 3000 years. From CMAR CSIRO and based upon data from Kurt Lambeck at the Australian National University. See also Lambeck 2002.
Note that regional sea level trends, such as the Pacific, during this current interglacial (the Holocene) are a lot more convoluted - a highstand (higher sea level) occurred in the Pacific around 2000 years ago. The trend shown in Figure 3 is the global average.
Recent sea level trends
Long-term sea level rises not only from the continued melt of land-based ice, but also from the thermal expansion of seawater as the oceans warm. Unlike the icesheets, which have the potential to rapidly accelerate sea level rise should they begin to collapse, thermal expansion is a rather steady process. Steady, perhaps, but not monotonic - contrary to popular perception, there was slowdown in the heat uptake in the upper ocean (0-700 metres deep) layers from 2003-2008, when compared to the previous half-decade. As a result the sea level trend has risen in a more linear manner if we only look at the observations since 1993 - the period of satellite measurements.
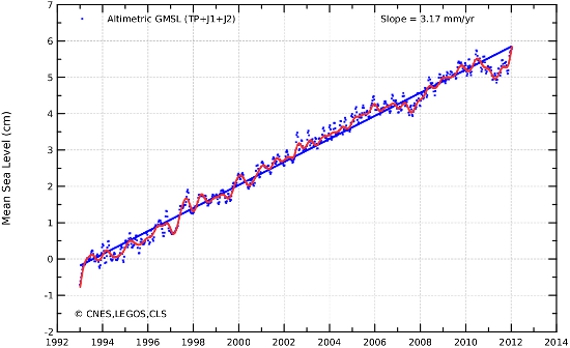
Figure 4 - Global mean sea level since January 1993 calculated after removing the annual and semi-annual signals. A 2-month filter is applied to the blue points, while a 6-month filter is used on the red curve. By applying the postglacial rebound correction (-0.3 mm/year), the rise in mean sea level has thus been estimated as 3.17 mm/year. From AVISO.
This trend is to be expected, the Earth should respond to the net radiative forcing over this interval, and in the last decade several factors have consipired to temporarily reduce the amount of ocean heating, and therefore the thermal expansion component of sea level rise. These factors are the prolonged solar minimum over the period, which saw a reduction in the amount of sunlight heating the ocean, and the increase in stratospheric (the upper atmosphere) aerosols - reflective particles which block the amount of sunlight reaching the ocean surface.
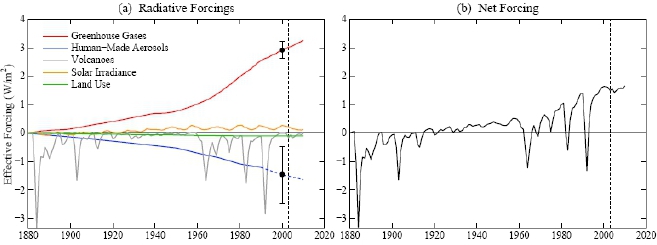
Figure 5 - net forcing from Hansen (2011).
An additional sea level-related consideration is the ENSO trend (El Niño/La Niña), which causes large, but temporary, fluctuations in sea level. See SkS post: Sea level fell in 2010 for further detail, but simply put La Niña is when global sea level typically falls due to rainfall and snow being focused over land (the 'potholes' in Figure 4). For the last 5 years La Niña has been the dominant ENSO mode.
Whether the stratospheric aerosol forcing will persist is unknown, but the solar cycle is on its way to the next peak, so increased warming of the ocean is already underway. The ENSO trend is unlikely to last much longer as well, and the fact that the sea level trend continued in a linear manner despite a 'slowdown' in ocean heating, suggests the contribution of ice melt to sea level rise is accelerating. This is consistent with the accelerated loss of ice mass from both the Greenland and Antarctic ice sheets (Rignot [2011], Luo [2012] & Box [2012]).
All-in-all the evidence indicates an acceleration of sea level rise in the near future. As far as the contribution of melting Greenland and Antarctic ice is concerned, an acceleration of this component of sea level rise is already taking place.
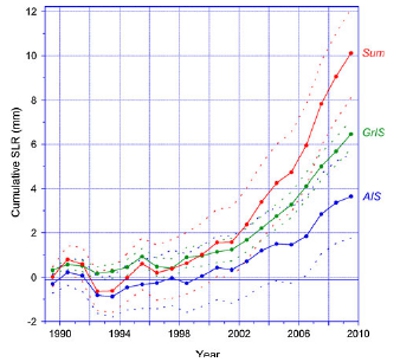
Figure 6 -Cumulative sea level rise contributions (1989–2009) from the Antarctic Ice Sheet (blue) and the Greenland Ice Sheet (green) and their sum (red). Dashed lines indicate uncertainty margins. From Van den Broeke (2011).
The Eemian Interglacial: An analogue for future sea level rise?
In the last several million years, the Earth has been dominated by ice ages - long cold intervals, where global sea levels fell (over 100 metres) as gigantic icesheets grew upon the Northern Hemisphere land masses. These were interspersed with comparatively short, warm interglacials, where the continental ice sheets melted and sea level rose. The most recent of these interglacials (prior to the present) being the Eemian. Around 115-130,000 years ago, due to Earth's different orbital and tilt characteristics, temperatures were perhaps 1-2°C warmer than present, and sea levels reached a 'highstand'. Estimates indicate sea level was 6-9 metres higher than present (Kopp [2009]).
This is consistent with the melt of a large fraction of the Greenland icesheet and, perhaps, the complete loss of the entire West Antarctic ice sheet (Muhs [2011]). McKay (2011) estimate that 4.1 to 5.8 metres of sea level rise during the Last Interglacial came from the Antarctic Ice Sheet, so this reinforces the notion that the ice sheet response to global warming poses a great risk of accelerating sea level rise, although the timeframe is uncertain.
Maybe the most relevant piece of information from this time was that the Greenland and Antarctic icesheets were in states of ice cover not too dissimilar from today. Despite the small and gradual 'nudge' from the evolving change in the Earth's orbit and tilt, the ice sheets melted quickly enough to cause sea level rise of close to a metre per century, and at times short pulses up to 36mm per year - ten times the current rate (Blanchon (2009). These are higher than many scientific projections of sea level rise for the 21st Century.
Because the position of the continents, mountain ranges, ocean circulations and land-based vegetation were similar to modern-day, this period serves as a useful, albeit far from perfect, analogue for the near-future. The lesson here being that since metre-rates of sea level rise per century occurred in the Eemian when ice cover on Greenland and Antarctica were not that different from today, then it's not unreasonable that a repeat this century, with a much stronger 'nudge' from greenhouse gases, is within the realms of possibility.
Myth busting time
Now armed with the all-important context, it's time to take a look at some of the myths propagated by Cliff Ollier in his op-ed:
IPCC sea level projections
Ollier writes: "Note that the IPCC estimates have been falling with each report"
This isn't true. Why would it be given the details explained above? Firstly, the IPCC (Intergovernmental Panel on Climate Change) 2007 report sea level projection was for 2090-2099, whereas the previous reports were for 2100. This explained in 10.6.5 of the IPCC report. Secondly, the 2001 IPCC report included contributions to sea level (such as melting permafrost) that were excluded from the 2007 version. And most importantly, the 2007 reports excludes dynamical changes in ice sheet melt in their projections, because modeling of this component of sea level rise is not sufficiently advanced enough to make accurate projections.
It is easy to appreciate why the authors of that chapter did so, but by simply taking a central estimate for ice loss from the Greenland & Antarctic icesheets from 1993-2003 and assuming that rate will persist throughout the 21st century was always likely to be a gross underestimate - as figure 6 readily shows.
A global map of sea level rise
Ollier: "Most stations show a rise of sea level of about 2mm a year, but note the considerable variations even within a single state, though these are no cause for alarm."
Rather than trawl through a database of tidal gauge data, it easier and more informative to look at global maps of sea level rise based on satellite data. This has the added benefit of showing global, not just coastal, trends. See figure 7. The tidal gauge data does show a similar total sea level rise trend however.
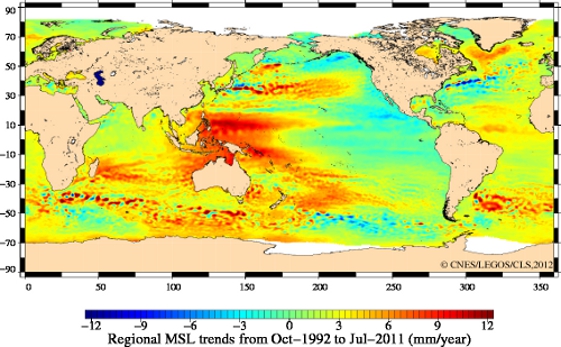
Figure 7 -Map of regional patterns of observed sea level (in mm/year). From AVISO.
Guess the sea level trend around Australia - no prizes for getting it right
Ollier: ".....the CSIRO says that since 1993 sea levels have risen up to 10mm a year in the north and west. That means that somewhere has had a 19cm-rise in sea level since 1993. Where is this place?"
Note the global trends around Australia since 1993 in figure 7. Ollier has a large number of Australian coastal towns he can choose from.
Constant sea level?
Ollier: "The European satellite says that sea levels have been constant for the past eight years."
Arguably one could say constantly rising, but certainly not constant as in not changing. See figure 4.
Tuvalu - the 'skeptic' sea level piñata
Ollier: "Indeed, the IPCC and CSIRO try to alarm the world with stories of the drowning of low islands, such as Tuvalu. But detailed mapping has shown that Tuvalu, and many other coral islands, have actually grown during the past 20 years."
Sea level at Tuvalu in the last 60 years has risen at almost 3 times the global average. See SkS post: What's happening with sea level at Tuvalu?. 10% of this trend is due to land subsidence.
The study referenced by Ollier (Webb & Kench [2010]) revealed that land area at select atoll islets in the Pacific had actually increased in the last half a decade - a result of sand and coral rubble washing ashore. It is notable that many of the Tuvalu islets in that particular study appear to be uninhabited - see figure 5 in their paper. It is not immediately clear how debris accumulating on uninhabited islets, or any islets for that matter, is supposed to help protect Tuvaluans from rising sea level.
Seas of change
So to summarize the main points:
- Cliff Ollier has simply repeated a number of myths about sea level, that could have been easily corrected if he had to bothered to consult the peer-reviewed scientific literature.
- Sea level rise has been observed to accelerate over the last few centuries, and throughout the 20th century. This has been primarily due to thermal expansion of the oceans as they warm, and the melting of mountain glaciers. Greenland and Antarctic ice sheet melt has barely contributed until the last two decades or so.
- Melting of the Greenland and Antarctic Ice sheets is expected to be the main contributor to sea level rise this century, and recent observations, revealing that melt of land-based ice is now the dominant component of sea level rise, support this.
- The last (almost) two decades have seen a more linear (straightline) rise of global sea level. This is in keeping with the forcings (climatic warming/cooling agents) over the period, and natural variability, but this is not expected to last. See Hansen (2011).
- The last interglacial saw sea level rises of around a metre per century at a time when ice cover on the Greenland and Antarctic ice sheets were similar to the present. This suggests that high rates of sea level rise, in excess of IPCC projections, are indeed possible this century with further global warming.


aviso.oceanobs.com Mean Sea Level rise References
You will find this link:
Why has an acceleration of sea level rise not
been observed during the altimeter era? R. Steven Nerem (University of Colorado)
And this illustration on the last page of the presentation:
http://i39.tinypic.com/nr14bq.jpg