Sun & climate: moving in opposite directions
What the science says...
| Select a level... |
 Basic
Basic
|
 Intermediate
|
 Advanced
| ||||
|
In the last 35 years of global warming, the sun has shown a slight cooling trend. Sun and climate have been going in opposite directions. |
|||||||
Climate Myth...
It's the sun
"Over the past few hundred years, there has been a steady increase in the numbers of sunspots, at the time when the Earth has been getting warmer. The data suggests solar activity is influencing the global climate causing the world to get warmer." (BBC)
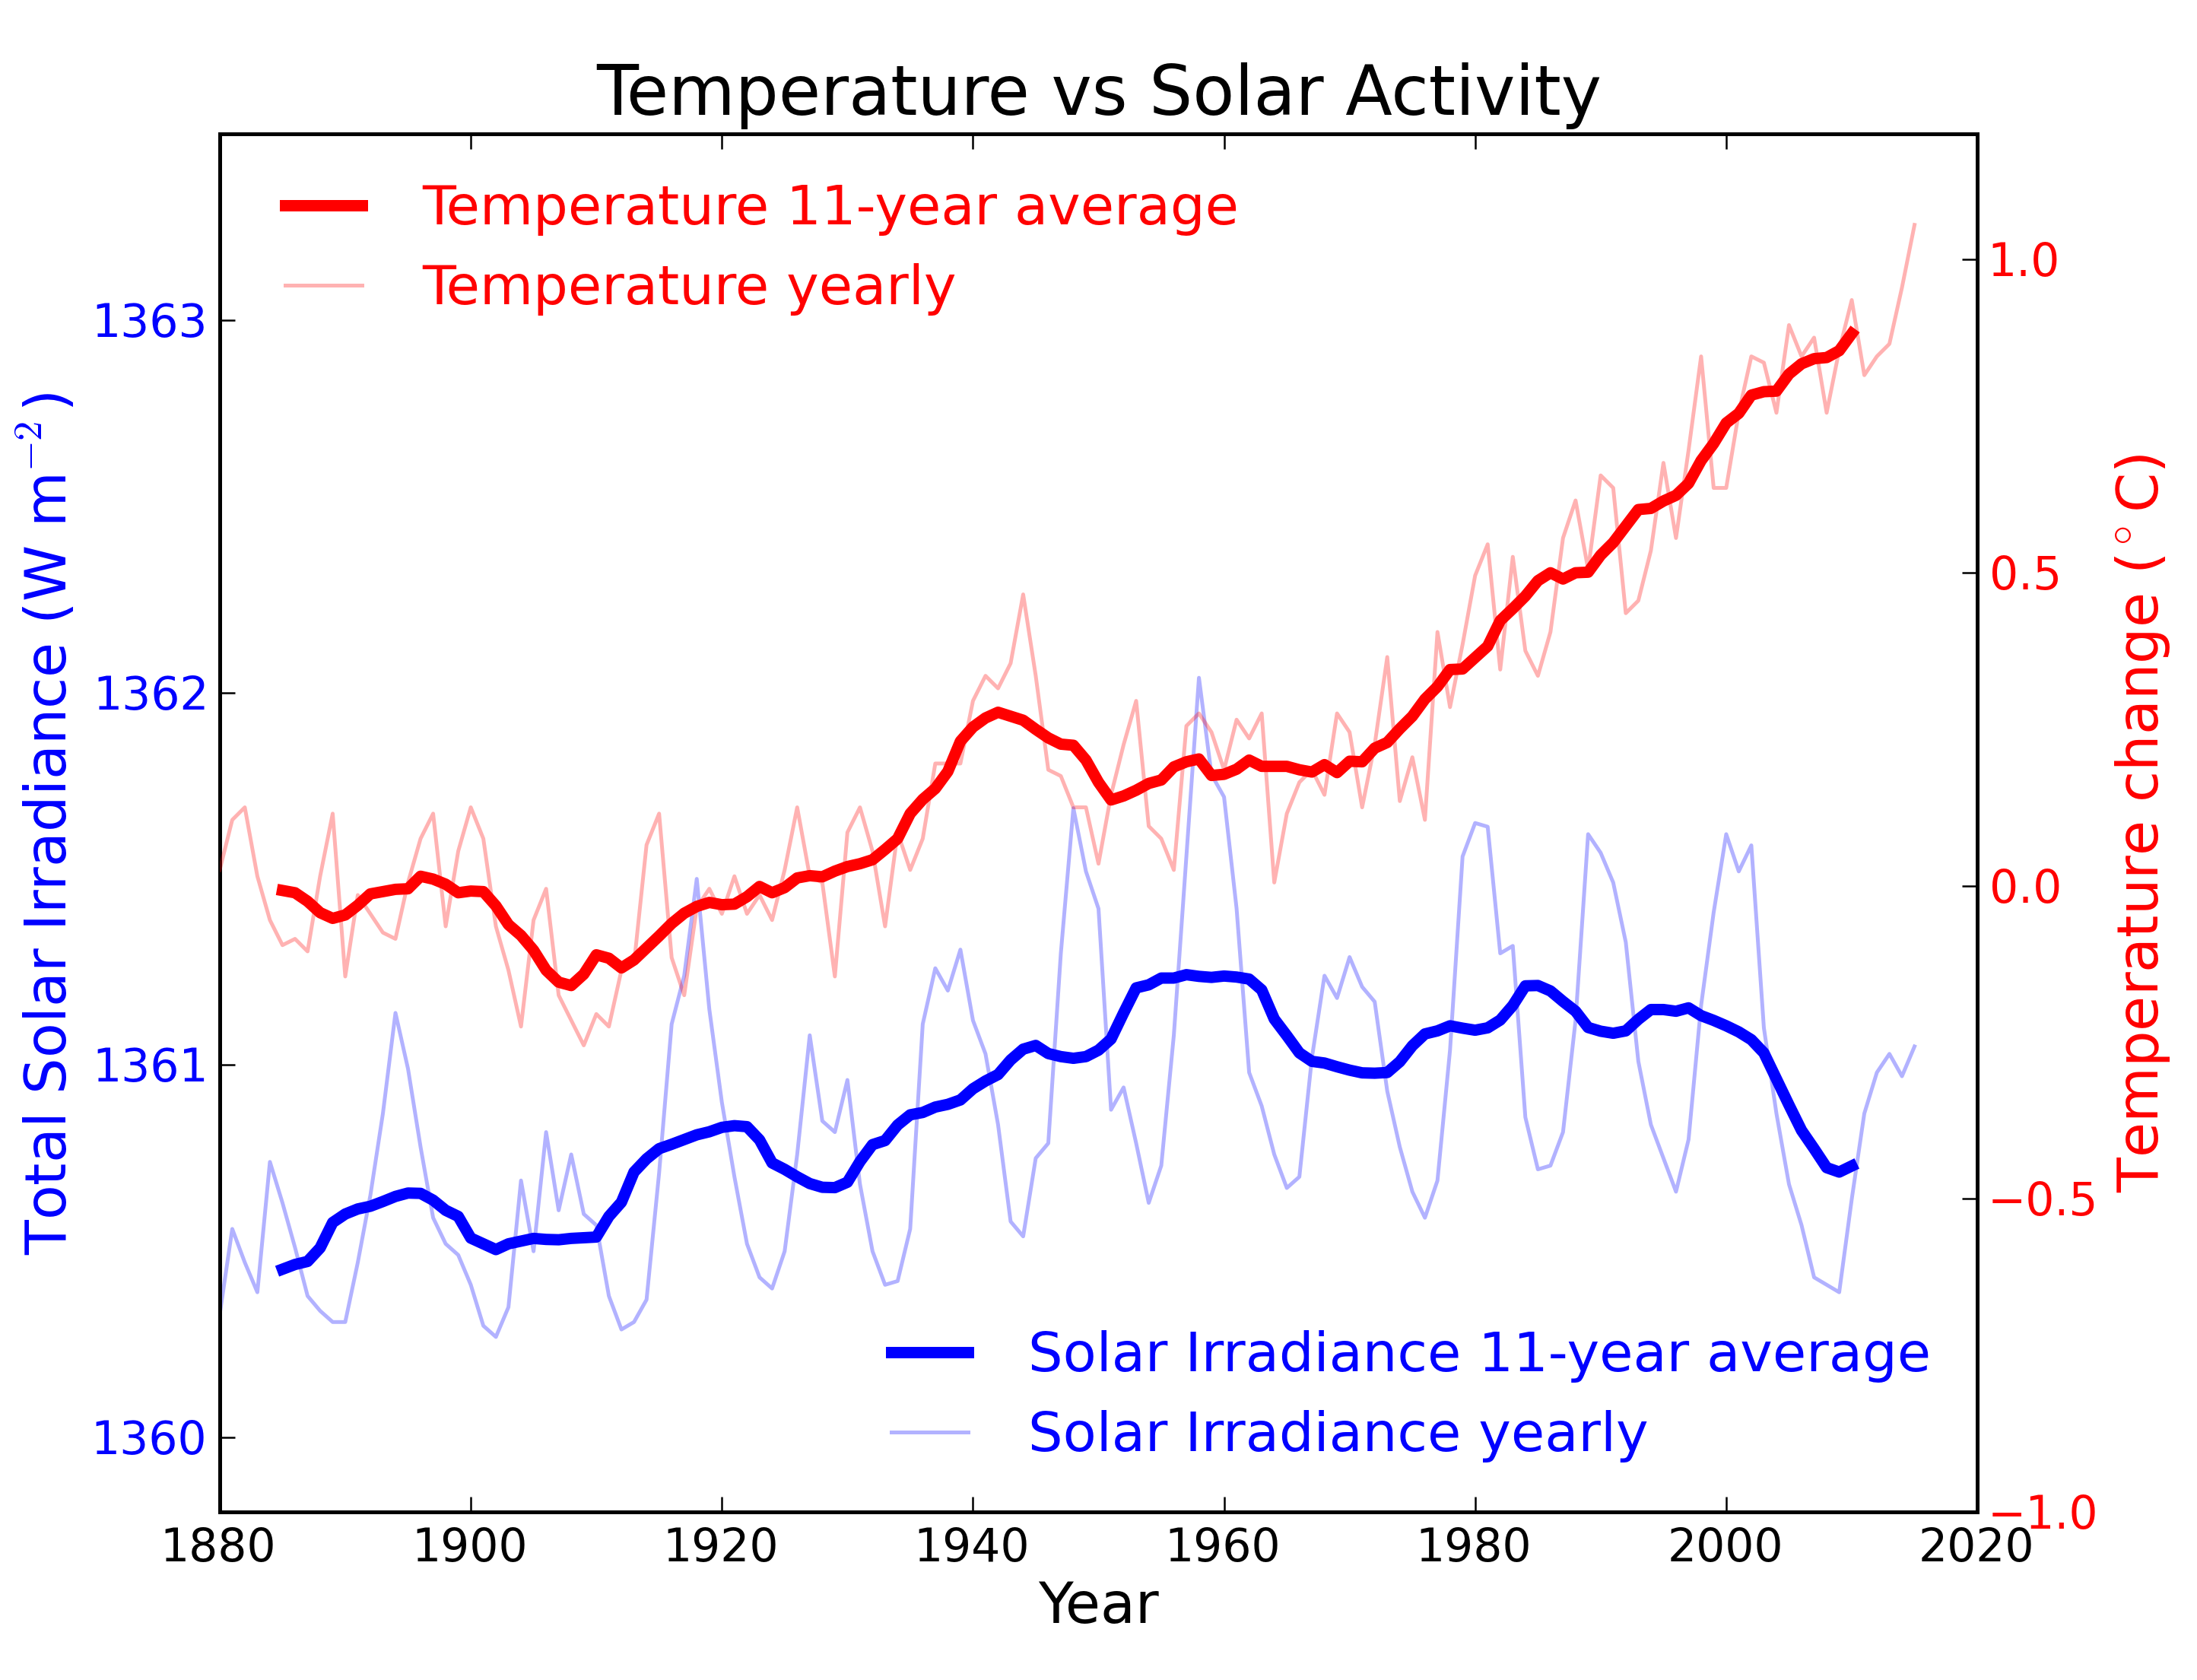
As supplier of almost all the energy in Earth's climate, the sun has a strong influence on climate. A comparison of sun and climate over the past 1150 years found temperatures closely match solar activity (Usoskin 2005). However, after 1975, temperatures rose while solar activity showed little to no long-term trend. This led the study to conclude, "...during these last 30 years the solar total irradiance, solar UV irradiance and cosmic ray flux has not shown any significant secular trend, so that at least this most recent warming episode must have another source."
In fact, a number of independent measurements of solar activity indicate the sun has shown a slight cooling trend since 1960, over the same period that global temperatures have been warming. Over the last 35 years of global warming, sun and climate have been moving in opposite directions. An analysis of solar trends concluded that the sun has actually contributed a slight cooling influence in recent decades (Lockwood 2008).

Figure 1: Annual global temperature change (thin light red) with 11 year moving average of temperature (thick dark red). Temperature from NASA GISS. Annual Total Solar Irradiance (thin light blue) with 11 year moving average of TSI (thick dark blue). TSI from 1880 to 1978 from Krivova et al 2007 (data). TSI from 1979 to 2015 from PMOD (see the PMOD index page for data updates).
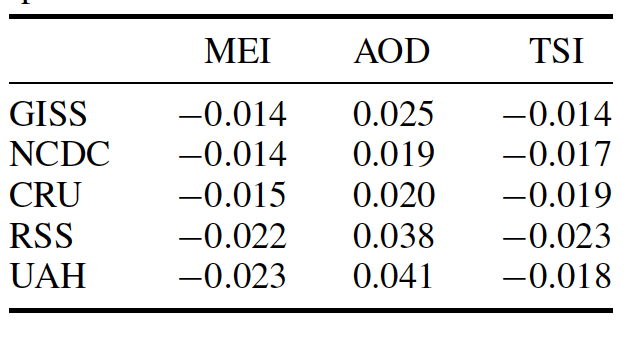
Foster and Rahmstorf (2011) used multiple linear regression to quantify and remove the effects of the El Niño Southern Oscillation (ENSO) and solar and volcanic activity from the surface and lower troposphere temperature data. They found that from 1979 to 2010, solar activity had a very slight cooling effect of between -0.014 and -0.023°C per decade, depending on the data set (Table 1, Figure 2).
Table 1: Trends in °C/decade of the signal components due to MEI, AOD and TSI in the regression of global temperature, for each of the five temperature records from 1979 to 2010.
Figure 2: Influence of exogenous factors on global temperature for GISS (blue) and RSS data (red). (a) MEI; (b) AOD; (c) TSI.
Like Foster and Rahmstorf, Lean and Rind (2008) performed a multiple linear regression on the temperature data, and found that while solar activity can account for about 11% of the global warming from 1889 to 2006, it can only account for 1.6% of the warming from 1955 to 2005, and had a slight cooling effect (-0.004°C per decade) from 1979 to 2005.
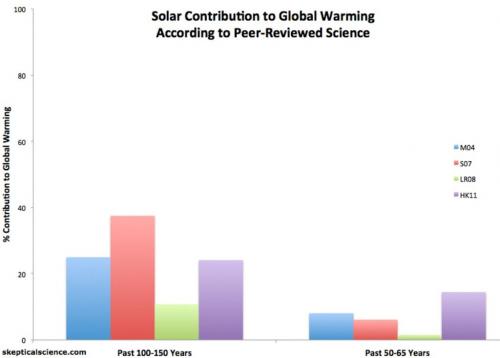
A number of studies have used a variety of statistical and physical approaches to determine the contribution of greenhouse gases and other effects to the observed global warming. Those studies find a relatively small solar contribution to global warming, particularly in recent decades (Figure 3).
Figure 3: Solar contribution to global warming according to various peer-reviewed attribution studies. The studies are Meehl et al. 2004 (M04, blue), Stone et al. 2007 (S07, red), Lean and Rind 2008 (LR08, green), and Huber and Knutti 2011 (HK11, purple).
Other studies on solar influence on climate
This conclusion is confirmed by many studies finding that while the sun contributed to warming in the early 20th Century, it has had little contribution (most likely negative) in the last few decades:
- Huber and Knutti (2011): "Even for a reconstruction with high variability in total irradiance, solar forcing contributed only about 0.07°C (0.03-0.13°C) to the warming since 1950."
- Erlykin 2009: "We deduce that the maximum recent increase in the mean surface temperature of the Earth which can be ascribed to solar activity is 14% of the observed global warming."
- Benestad 2009: "Our analysis shows that the most likely contribution from solar forcing a global warming is 7 ± 1% for the 20th century and is negligible for warming since 1980."
- Lockwood 2008: "It is shown that the contribution of solar variability to the temperature trend since 1987 is small and downward; the best estimate is -1.3% and the 2? confidence level sets the uncertainty range of -0.7 to -1.9%."
- Lean 2008: "According to this analysis, solar forcing contributed negligible long-term warming in the past 25 years and 10% of the warming in the past 100 years..."
- Lockwood 2008: "The conclusions of our previous paper, that solar forcing has declined over the past 20 years while surface air temperatures have continued to rise, are shown to apply for the full range of potential time constants for the climate response to the variations in the solar forcings."
- Ammann 2007: "Although solar and volcanic effects appear to dominate most of the slow climate variations within the past thousand years, the impacts of greenhouse gases have dominated since the second half of the last century."
- Lockwood 2007: "The observed rapid rise in global mean temperatures seen after 1985 cannot be ascribed to solar variability, whichever of the mechanism is invoked and no matter how much the solar variation is amplified."
- Foukal 2006 concludes "The variations measured from spacecraft since 1978 are too small to have contributed appreciably to accelerated global warming over the past 30 years."
- Scafetta 2006 says "since 1975 global warming has occurred much faster than could be reasonably expected from the sun alone."
- Usoskin 2005 conclude "during these last 30 years the solar total irradiance, solar UV irradiance and cosmic ray flux has not shown any significant secular trend, so that at least this most recent warming episode must have another source.
- Solanki 2004 reconstructs 11,400 years of sunspot numbers using radiocarbon concentrations, finding "solar variability is unlikely to have been the dominant cause of the strong warming during the past three decades".
- Haigh 2003 says "Observational data suggest that the Sun has influenced temperatures on decadal, centennial and millennial time-scales, but radiative forcing considerations and the results of energy-balance models and general circulation models suggest that the warming during the latter part of the 20th century cannot be ascribed entirely to solar effects."
- Stott 2003 increased climate model sensitivity to solar forcing and still found "most warming over the last 50 yr is likely to have been caused by increases in greenhouse gases."
- Solanki 2003 concludes "the Sun has contributed less than 30% of the global warming since 1970."
- Lean 1999 concludes "it is unlikely that Sun–climate relationships can account for much of the warming since 1970."
- Waple 1999 finds "little evidence to suggest that changes in irradiance are having a large impact on the current warming trend."
- Frolich 1998 concludes "solar radiative output trends contributed little of the 0.2°C increase in the global mean surface temperature in the past decade."
- Schurer 2013 finds that the sun is unlikely to have caused more than 0.15°C of the observed approximately 1°C warming over the past 300 years.
Intermediate rebuttal written by Larry M
This rebuttal was updated by Kyle Pressler in 2021 to replace broken links. The updates are a result of our call for help published in May 2021.
Last updated on 9 October 2016 by pattimer. View Archives


 Arguments


are proven by peer-reviewed studies to be correct and that: -
Recent oppositely directed trends in solar climate forcings and the global mean surface air temperature BY MIKE LOCKWOOD AND CLAUS FROHLICH
is shown by peer-reviewed studies to be wrong in some way, that still does not invalidate the fact that Solar output [once the 11-year cycle has been removed], has had no tend or virtually no trend. http://www.pmodwrc.ch/tsi/composite/pics/org_comp2_d41_61_0705.png
Claims that the recent anomalous warming are solely due to solar effects are unsustainable. It is clear that the current anomalos warming cannot be explained without including the effects of GHGs and CO2 in particular.
On the contrary, the enhanced greenhouse effect from CO2 has been confirmed by multiple lines of empirical evidence (eg - satellite measurements of infrared spectra, surface measurements finding more downward infrared radiation warming the planet’s surface).
"If I was to blame any atmospheric gas of a GH effect, I would blame the Water Vapor, not the the coolant CO2."
You would be right in that water vapour is the most dominant greenhouse gas. It's also the dominant positive feedback in our climate system and amplifies any warming caused by changes in atmospheric CO2. This positive feedback is why climate is so sensitive to CO2 warming.

What it shows is a close correlation between Solar Irradiance (the orange line) and global temperature (dotted blue line). But they also show the correlation ends when the modern global warming trend begins in the mid-70's. The data is all there and it's unambiguous - there's a reason why so many studies (listed above under "Other Studies on solar influence on climate") conclude the sun's influence on recent global warming is minimal.However, this is not what is observed over the 20th century. Solar activity levels out in the 1950's. However, the modern global warming trend began in the mid 1970s. If the sun was the cause of global warming, the planet would've been at its highest energy imbalance in the 1950s. Then the planet would gradually have approached equilibrium over the next few decades.
The opposite has occured. The energy imbalance has in fact increased over the past 3 decades and is still increasing. Of course, we now know why the planet is in radiative imbalance - due to an enhanced greenhouse effect caused by increasing greenhouse gases such as CO2 and methane.