Climate Science Glossary

Term Lookup

Enter a term in the search box to find its definition.

Settings

Use the controls in the far right panel to increase or decrease the number of terms automatically displayed (or to completely turn that feature off).

Term Lookup

Settings


All IPCC definitions taken from Climate Change 2007: The Physical Science Basis. Working Group I Contribution to the Fourth Assessment Report of the Intergovernmental Panel on Climate Change, Annex I, Glossary, pp. 941-954. Cambridge University Press.

Home Arguments Software Resources Comments The Consensus Project Translations About Support

Twitter Facebook YouTube Mastodon MeWe

RSS Posts RSS Comments Email Subscribe


Climate's changed before
It's the sun
It's not bad
There is no consensus
It's cooling
Models are unreliable
Temp record is unreliable
Animals and plants can adapt
It hasn't warmed since 1998
Antarctica is gaining ice
View All Arguments...


Username
Password
New? Register here
Forgot your password?

Latest Posts

Archives

Sun & climate: moving in opposite directions

What the science says...

Select a level... Basic Intermediate Advanced

In the last 35 years of global warming, the sun has shown a slight cooling trend. Sun and climate have been going in opposite directions. In the past century, the Sun can explain some of the increase in global temperatures, but a relatively small amount.

Climate Myth...

It's the sun

"Over the past few hundred years, there has been a steady increase in the numbers of sunspots, at the time when the Earth has been getting warmer. The data suggests solar activity is influencing the global climate causing the world to get warmer." (BBC)

It's often considered "common sense" that global warming is caused by the Sun.  After all, the Sun is the source of almost all of the energy on Earth.  The Sun has both direct and indirect influences over the Earth's temperature, and we can evaluate whether these effects could be responsible for a significant amount of the recent global warming.  As shown in the Intermediate level rebuttal of this argument, dozens of studies have concluded that the Sun simply cannot account for the recent global warming, but here we'll go through the calculations for ourselves.

Direct solar effect

The Sun's largest influence on the Earth's surface temperature is through incoming solar radiation, also known as total solar irradiance (TSI).  Changes in TSI can be converted into a radiative forcing, which tells us the energy imbalance it causes on Earth.  This energy imbalance is what causes a global temperature change.

The solar radiative forcing is TSI in Watts per square meter (W-m-2) divided by 4 to account for spherical geometry, and multiplied by 0.7 to account for planetary albedo (Meehl 2002).  The albedo factor is due to the fact that the planet reflects approximately 30% of the incoming solar radiation.

This is a very straightforward and easy to understand formula - the larger the change in solar irradiance, the larger the energy imbalance it causes, and thus the larger the radiative forcing.  Studies have reconstructed TSI over the past 300 years.  Wang, Lean, and Sheeley (2005) compared a flux transport model with geomagnetic activity and cosmogenic isotope records and to derive a reconstruction of TSI since 1713.

Wang 2005

Figure 1: Total Solar Irradiance from 1713 to 1996 (Wang 2005)

Satellites have directly measured TSI since 1978.

PMOD TSI

Figure 2: Total Solar Irradiance as measured by satellite from 1978 to 2010

As you can see, over the past 32 years, TSI has remained unchanged on average.  In the early 20th century, from about 1900 to 1950 there was an increase in TSI from about 1365.5 to 1366 W-m-2.  The change in global temperature in response to a radiative forcing is:

Where 'dT' is the change in the Earth's average surface temperature, 'λ' is the climate sensitivity, usually with units in Kelvin or degrees Celsius per Watts per square meter (°C/[W-m-2]), and 'dF' is the radiative forcing.

So now to calculate the change in temperature, we just need to know the climate sensitivity. Studies have given a possible range of values of 2 to 4.5°C warming for a doubling of CO2 (IPCC 2007), which corresponds to a range of 0.54 to 1.2°C/(W-m-2) for λ.  We can then calculate the change in global temperature caused by the increase in TSI since 1900 using the formulas above.  Although Wang, Lean, and Sheeley's reconstruction puts the change in TSI since 1900 at about 0.5 W-m-2, previous studies have shown a larger change, so we'll estimate the change in TSI at 0.5 to 2 W-m-2.

with a most likely value of 0.15°C

We can confirm this by comparing the calculation to empirical observations.  From 1900 to 1950 the Earth's surface temperature warmed by about 0.4°C.  Over that period, humans increased the amount of carbon dioxide in the atmosphere by about 20 parts per million by volume.  This corresponds to an anthropogenic warming of:

with a most likely value of 0.22°C.

Therefore, the solar forcing combined with the anthropogenic CO2 forcing and other minor forcings (such as decreased volcanic activity) can account for the 0.4°C warming in the early 20th century, with the solar forcing accounting for about 40% of the total warming.  Over the past century, this increase in TSI is responsible for about 15-20% of global warming (Meehl 2004).  But since TSI hasn't increased in at least the past 32 years (and more like 60 years, based on reconstructions), the Sun is not directly responsible for the warming over that period.

Foster and Rahmstorf (2011) used multiple linear regression to quantify and remove the effects of the El Niño Southern Oscillation (ENSO) and solar and volcanic activity from the surface and lower troposphere temperature data.  They found that since 1979, solar activity has had a very slight cooling effect of between -0.014 and -0.023°C per decade, depending on the data set (Table 1, Figure 3).

Table 1: Trends in  °C/decade of the signal components due to MEI, AOD and TSI in the regression of global temperature, for each of the five temperature records from 1979 to 2010.

table 3

Figure 7

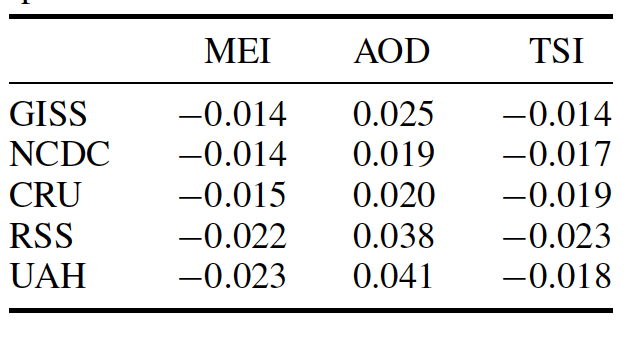
Figure 3: Influence of exogenous factors on global temperature for GISS (blue) and RSS data (red). (a) MEI; (b) AOD; (c) TSI.

Like Foster and Rahmstorf, Lean and Rind (2008)performed a multiple linear regression on the temperature data, and found that while solar activity can account for about 11% of the global warming from 1889 to 2006, it can only account for 1.6% of the warming from 1955 to 2005, and had a slight cooling effect (-0.004°C per decade) from 1979 to 2005.  Similarly, Schurer et al. (2013) uses multiple linear regression and finds that the sun is unlikely to have caused more than 0.15°C of the observed approximately 1°C warming over the past 300 years.

Note that this multiple linear regression technique it makes no assumptions about various solar effects.  Any solar effect (either direct or indirect) which is correlated to solar activity (i.e. solar irradiance, solar magnetic field [and thus galactic cosmic rays], ultraviolet [UV] radiation, etc.) is accounted for in the linear regression.  Both Lean and Rind and Foster and Rahmstorf found that solar activity has played a very small role in the recent observed global warming.

Indirect Solar Effects

Ultraviolet Radiation

It has also been proposed that ultraviolet (UV) radiation, which varies more than other solar irradiance wavelengths, could amplify the solar influence on the global climate through interactions with the stratosphere and atmospheric ozone.  Shindell et al. (1999) examined this possibility, but found that while this UV variability has a significant influence over regional temperatures, it has little effect on global surface temperatures.

"Solar cycle variability may therefore play a significant role in regional surface temperatures, even though its influence on the global mean surface temperature is small (0.07 K for December–February)."

Moreover, Shindell et al. found that anthropogenic ozone depletion (via chlorofluorocarbon emissions) may have reduced the impact of UV variability on the climate, and may have even offset it entirely.

"Another consideration is that upper stratospheric ozone has decreased significantly since the 1970s as a result of destruction by halogens released from chlorofluorocarbons.  This ozone decrease, which has been much larger than the modeled solar-induced ozone increases, may have limited the ability of solar irradiance changes to affect climate over recent decades, or may have even offset those effects."

Galactic cosmic rays

Henrik Svensmark has proposed that galactic cosmic rays (GCRs) could exert significant influence over global temperatures (Svensmark 1998).  The theory goes that the solar magnetic field deflects GCRs, which are capable of seeding cloud formation on Earth.  So if solar magnetic field were to increase, fewer GCRs would reach Earth, seeding fewer low-level clouds, which are strongly reflective.  So an increased solar magnetic field can indirectly decrease the Earth's albedo (reflectivity), thus causing the planet to warm.  Thus in order for this theory to be plausible,

  1. Solar magnetic field must have a long-term positive trend.
  2. Galactic cosmic ray flux on Earth must have a long-term negative trend.
  3. Cosmic rays must successfully seed low-level clouds.
  4. Low-level cloud cover must have a long-term negative trend.

Fortunately we have empirical observations with which to test these requirements.

Solar magnetic field

Solar magnetic field strength correlates strongly with other solar activity, such as TSI and sunspot number.  As is the case with these other solar attributes, solar magnetic field has not changed appreciably over the past three decades (Lockwood 2001).

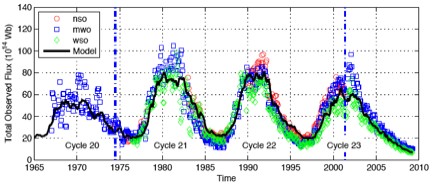
Figure 3: Solar Magnetic Flux from 1967 to 2009 (Vieira and Solanki 2010)

Galactic Cosmic Ray Flux

Cosmic ray flux on Earth has been monitored since the mid-20th century, and has shown no significant trend over that period.

Figure 4: Cosmic Ray Intensity (blue) and Sunspot Number (green) from 1951 to 2006 (University of New Hampshire)

GCR Cloud Seeding

Numerous studies have investigated the effectiveness of GCRs in cloud formation.  Kazil et al. (2006) found:


"the variation of ionization by galactic cosmic rays over the decadal solar cycle does not entail a response...that would explain observed variations in global cloud cover"


Sloan and Wolfendale (2008) found:

"we estimate that less than 23%, at the 95% confidence level, of the 11-year cycle changes in the globally averaged cloud cover observed in solar cycle 22 is due to the change in the rate of ionization from the solar modulation of cosmic rays."

Kristjansson et al. (2008) found:

"no statistically significant correlations were found between any of the four cloud parameters and GCR"

Calogovic et al. (2010) found:

"no response of global cloud cover to Forbush decreases at any altitude and latitude."

Kulmala et al. (2010) also found

"galactic cosmic rays appear to play a minor role for atmospheric aerosol formation events, and so for the connected aerosol-climate effects as well."

Low-Level Cloud Cover

Unfortunately observational low-level cloud cover data is somewhat lacking and even yields contradictory results.  Norris et al. (2007) found

"Global mean time series of surface- and satellite-observed low-level and total cloud cover exhibit very large discrepancies, however, implying that artifacts exist in one or both data sets....The surface-observed low-level cloud cover time series averaged over the global ocean appears suspicious because it reports a very large 5%-sky-cover increase between 1952 and 1997. Unless low-level cloud albedo substantially decreased during this time period, the reduced solar absorption caused by the reported enhancement of cloud cover would have resulted in cooling of the climate system that is inconsistent with the observed temperature record."

So the jury is still out regarding whether or not there's a long-term trend in low-level cloud cover.

Inability to explain other observations

In addition to these multiple lines of empirical evidence which contradict the GCR warming theory, the galactic cosmic ray theory cannot easily explain the cooling of the upper atmosphere, greater warming at night, or greater warming at higher latitudes.  These are fingerprints of the increased greenhouse effect, the major mechanism of anthropogenic global warming.

Dansgaard-Oeschger Events

Some individuals, most notably Fred Singer, have argued that Dansgaard-Oeschger (D-O, a.k.a. Bond) events could be causing the current global warming.  D-O events are rapid climate fluctuations that occur quasi-periodically with a 1,470-year recurrance time and which, according to Singer, are "likely caused by the sun."  However, there is significant debate as to the cause of these D-O events, with changes in solar output being just one possibility (NOAA Paleoclimatology).

Regardless, the most obvious flaw in this argument is that the planet wasn't warming 1,470 years ago.  The previous warm event was the Medieval Warm Period approximately 1,000 years ago.

2000 year temps

Figure 5: Global temperature reconstructions over the past 2,000 years (Wikipedia)

Bond et al. (1999) added further evidence that the timing of D-O events disqualifies them from being responsible for the current warming, by showing that the most recent D-O event may have contributed to the Little Ice Age (LIA):

"evidence from cores near Newfoundland confirms previous suggestions that the Little lce Age was the most recent cold phase of the 1-2kyr cycle"

And a study by Rahmstorf (2003) also concludes that the LIA may be the most recent cold phase of the D-O cycle, and his research suggests that the 1,470-year periodicity is so regular that it's more likely due to an orbital cycle than a solar cycle.

"While the earlier estimate of ±20% [Schulz, 2002] is consistent with a solar cycle (the 11-year sunspot cycle varies in period by ±14%), a much higher precision would point more to an orbital cycle. The closest cycle known so far is a lunar cycle of 1,800 years [De Rop, 1971], which cannot be reconciled with the 1,470-year pacing found in the Greenland data. The origin of this regular pacing thus remains a mystery."

However, according to Braun et al. (2005), D-O events could be caused by a combination of solar cycles and freshwater input into the North Atlantic Ocean.  But their study also concludes that D-O events are not expected to occur during the Holocene (the current geologic epoch).

"the 1,470-year climate response in the simulation is restricted to glacial climate and cannot be excited for substantially different (such as Holocene) boundary conditions...Thus, our mechanism for the glacial ,1,470-year climate cycle is also consistent with the lack of a clear and pronounced 1,470-year cycle in Holocene climate archives."

The bottom line is that regardless of whether or not the D-O cycles are triggered by the Sun, the timing is clearly not right for this cycle to be responsible for the current warming.  Particularly since solar output has not increased in approximately 60 years, and has only increased a fraction of a percent in the past 300 years, as discussed above.

Ironically, prior to publishing a book in 2007 which blamed the current warming on D-O cycles, Singer argued that the planet wasn't warming as recently as 2003.  So the planet isn't warming, but it's warming due to the D-O cycles?  It's quite clear that in reality, neither of these contradictory arguments is even remotely correct.

Inability to explain empirical observations

Aside from the fact that solar effects cannot physically explain the recent global warming, as with GCRs, there are several empirical observations which solar warming could not account for.  For example, if global warming were due to increased solar output, we would expect to see all layers of the atmosphere warm, and more warming during the day when the surface is bombarded with solar radiation than at night.  Instead we observe a cooling of the upper atmosphere and greater warming at night, which are fingerprints of the increased greenhouse effect.

Conservation of Energy

Huber and Knutti (2011) have published a paper in Nature Geoscience, Anthropogenic and natural warming inferred from changes in Earth’s energy balance.  They take an approach in this study which utilizes the principle of conservation of energy for the global energy budget, and summarize their methodology:

"We use a massive ensemble of the Bern2.5D climate model of intermediate complexity, driven by bottom-up estimates of historic radiative forcing F, and constrained by a set of observations of the surface warming T since 1850 and heat uptake Q since the 1950s....Between 1850 and 2010, the climate system accumulated a total net forcing energy of 140 x 1022 J with a 5-95% uncertainty range of 95-197 x 1022 J, corresponding to an average net radiative forcing of roughly 0.54 (0.36-0.76)Wm-2."

Essentially, Huber and Knutti take the estimated global heat content increase since 1850, calculate how much of the increase is due to various estimated radiative forcings, and partition the increase between increasing ocean heat content and outgoing longwave radiation.  The authors note that more than 85% of the global heat uptake (Q) has gone into the oceans, including increasing the heat content of the deeper oceans, although their model only accounts for the upper 700 meters.

Figure 6 is a similar graphic to that presented in Meehl et al. (2004), comparing the average global surface warming simulated by the model using natural forcings only (blue), anthropogenic forcings only (red), and the combination of the two (gray).

knutti attribution

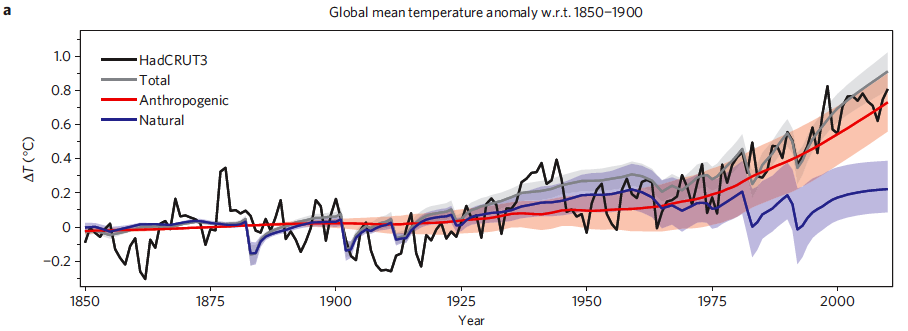
Figure 6: Time series of anthropogenic and natural forcings contributions to total simulated and observed global temperature change. The coloured shadings denote the 5-95% uncertainty range.

In Figure 7, Huber and Knutti break down the anthropogenic and natural forcings into their individual components to quantify the amount of warming caused by each since the 1850s (Figure 7b), 1950s (7c), and projected from 2000 to 2050 using the IPCC SRES A2 emissions scenario as business-as-usual (7d).

knutti breakdown

Figure 7: Contributions of individual forcing agents to the total decadal temperature change for three time periods. Error bars denote the 5–95% uncertainty range. The grey shading shows the estimated 5–95% range for internal variability based on the CMIP3 climate models. Observations are shown as dashed lines.

Solar and volcanic activity are the main natural forcings included in the Huber and Knutti study.  Both are slightly positive since 1850, and account for approximately 0.2°C of the observed 0.8°C surface warming over that period.  Since 1950, the volcanic forcing has been negative due to a few significant eruptions, and has offset the modestly positive solar forcing, such that the net natural external forcing contribution to global warming over the past 50 years is approximately zero (more specifically, the authors estimate the natural forcing contribution since 1950 at -10 to +13%, with a most likely value of 1%).

The authors also note that they chose a reconstruction with high variability in solar irradiance, so if anything they may have overestimated the natural contribution to the observed warming.

"Even for a reconstruction with high variability in total irradiance, solar forcing contributed only about 0.07°C (0.03-0.13°C) to the warming since 1950."

Other Attribution Studies

A number of studies have used a variety of statistical and physical approaches to determine the contribution of greenhouse gases and other effects to the observed global warming.  Those studies find a relatively small solar contribution to global warming, particularly in recent decades (Figure 8).

solar attribution

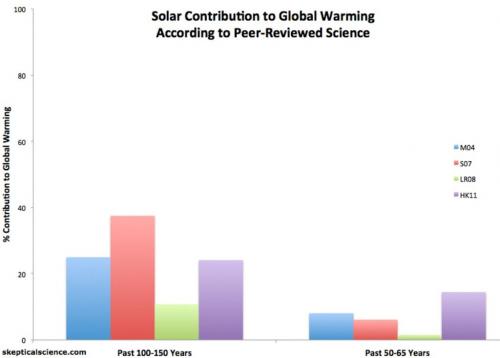
Figure 8: Solar contribution to global warming according to Meehl et al. 2004 (M04, blue), Stone et al. 2007 (S07, red), Lean and Rind 2008 (LR08, green), and Huber and Knutti 2011 (HK11, purple).

It's not the Sun

As illustrated above, neither direct nor indirect solar influences can explain a significant amount of the global warming over the past century, and certainly not over the past 30 years.  As Ray Pierrehumbert said about solar warming,

“That’s a coffin with so many nails in it already that the hard part is finding a place to hammer in a new one.”

Advanced rebuttal written by Larry M


Update July 2015:

Here is a related video from our Denial101x - Making Sense of Climate Science Denial- MOOC

Expert interview with Mike Lockwood

Last updated on 6 August 2015 by pattimer. View Archives

Printable Version  |  Offline PDF Version  |  Link to this page

Argument Feedback

Please use this form to let us know about suggested updates to this rebuttal.

Related Arguments

Further viewing

Related video from Peter Sinclair's "Climate Denial Crock of the Week" series:

Further viewing

This video created by Andy Redwood in May 2020 is an interesting and creative interpretation of this rebuttal:

Myth Deconstruction

Related resource: Myth Deconstruction as animated GIF

MD Sun

Please check the related blog post for background information about this graphics resource.

Denial101x videos

Related lecture-videos from Denial101x - Making Sense of Climate Science Denial

and

Additional video from the MOOC

Expert interview with Mike Lockwood

Comments

1  2  3  4  5  6  7  8  9  10  11  12  13  14  15  16  17  18  19  20  Next

Comments 1 to 25 out of 1317:

  1. "From the actual data we conclude that the graphs from Lockwood and Frölish were flawed: 1. The methodology used by Lockwood and Frölish to smooth the lines was applied only to maxima of R (sunspot number), dismissing the TSI. This practice hides the minima, which for the issue are more important than the maxima. For example, if the minimum of TSI in 1975 was 1365.5 W/m^2, it would contrast dramatically with the minimum of TSI of 1998 that was 1366 W/m^2 (0.033% higher). That would make the Sun in 1975 “colder” than in 1998. However, if we compare minimum values with maximum values, then the Sun would be frankly “warmer” in 1998 -when the solar energy output was 1366 W/m^2- than in 1975 -when the energy output was 1366.1111 W/m^2. Today (21/07/07), the global TSI was 1367.6744 W/m^2); hence, we see that we must not smooth maxima values through movable trends because we would be hiding the minima values, which are more important because the baseline of the “cooler” or lower nuclear activity of the Sun are higher everyday. The coolest period of the Sun happened during the Maunder Minimum when the TSI was 1363.5 W/m^2. The coolest period of the Sun from 1985 to date occurred in 1996 when the TSI was 1365.6211 W/m^2. An interesting blotch is that in 1985 the TSI was 1365.6506 W/m^2 and in 2000 was 1366.6744." http://biocab.org/Solar_Irradiance_is_Actually_Increasing.html#anchor_15
  2. Just assuming for the sake of argument that your assertions based upon http://biocab.org/Solar_Irradiance_is_Actually_Increasing.html#anchor_15
    are proven by peer-reviewed studies to be correct and that: -
    Recent oppositely directed trends in solar climate forcings and the global mean surface air temperature BY MIKE LOCKWOOD AND CLAUS FROHLICH
    is shown by peer-reviewed studies to be wrong in some way, that still does not invalidate the fact that Solar output [once the 11-year cycle has been removed], has had no tend or virtually no trend. http://www.pmodwrc.ch/tsi/composite/pics/org_comp2_d41_61_0705.png
    Claims that the recent anomalous warming are solely due to solar effects are unsustainable. It is clear that the current anomalos warming cannot be explained without including the effects of GHGs and CO2 in particular.
  3. I think I have the right to argue on my article based on peer reviewed papers. When we consider a short period, for example an 11 years period we can argue that the intensity of the solar irradiance is decreasing; however, if we consider a longer period, for example 400 years, we can see that the intensity of solar irradiance has not decreased. Some 400 years ago the solar irradiance intensity was 1365.5946 W/m^-2, while in 2000 the total solar irradiance intensity was 1366.6620 W/m^2. This year the Sun has been mostly spotless, but the solar irradiance intensity has been 1365 W/m^-2. This constitutes evidence on the existence of other solar "pulses" that we have not understood well: http://science.nasa.gov/headlines/y2003/17jan_solcon.htm Regarding the particularity of CO2 on the global warming, I don't see why to blame the CO2 of GW when its particular thermal characteristics show that the CO2 is not capable of producing any warming. The Pp of the CO2 in the atmosphere is roughly 0.00034 atm*m, wich limits the absorptivity-emissivity of the CO2 to only 0.00092 (dimensionless value), not the 0.2 given by the IPCC. The absorptivity-emissivity of CO2 is 0.00092 conduces to its total emittancy of barely 0.414 W/m^2, not the 5.35 W/m^2 given by the IPCC. If I was to blame any atmospheric gas of a GH effect, I would blame the Water Vapor, not the the coolant CO2.
    Response: "its particular thermal characteristics show that the CO2 is not capable of producing any warming"

    On the contrary, the enhanced greenhouse effect from CO2 has been confirmed by multiple lines of empirical evidence (eg - satellite measurements of infrared spectra, surface measurements finding more downward infrared radiation warming the planet’s surface).

    "If I was to blame any atmospheric gas of a GH effect, I would blame the Water Vapor, not the the coolant CO2."

    You would be right in that water vapour is the most dominant greenhouse gas. It's also the dominant positive feedback in our climate system and amplifies any warming caused by changes in atmospheric CO2. This positive feedback is why climate is so sensitive to CO2 warming.
  4. Biocab: surely you can agree with the consensus that solar irradiance has not increased significantly in the last 50 years, while the global average temperature has? The only conclusion can be that changes in solar irradiance cannot have contributed to recent warming in the last half century. With regard to CO2: I think you are not completely aware of the exact concept of the natural greenhouse effect, the enhanced greenhouse effect and most important of all radiative forcing. I am not an expert on the exact chemistry of all the trace gases and how that works, so I cannot judge your comments on the exact emissivity (though my gut feeling hints at the missing of the immediate re-emittance of longwave IR-radiation while you seem to be talking only about the independent emittance of the absorbed heat). I do know the following though: the absolute value of carbon dioxide (whether expressed in ppm or Pp) is not relevant when it comes to the increase or decrease of the Earth's surface temperature. Changes in the exact amount of each gas are what is important. The reason for this is that such changes will cause changes in radiative fluxes and, as a part of the total atmospheric adjustment for these radiative inbalances, the earth's surface cools or warms. Now given that carbon dioxide concentrations have risen at least 35% since 1900, there surely must have been some warming due to carbon dioxide (though not due to the existance of the gas in the first place, but because of the increase in its concentration). I am more at home in meteorology, so some rough calculations about that: the upward surface flux of the earth is around 390 W/m² (sigma T^4 = 5,6704x10^-8 * 288^4 ~ 390) and the outward flux at the top of the atmosphere is (1-a)S/4 where a ~ 0.3 (the global, terrestial albedo of the atmosphere) so this flux comes down to about 240 W/m². Now you can easily see that a large amount of longwave radiation must have been absorbed by the atmosphere, roughly 150 W/m². We know that water vapour is by far the primary absorber and carbon dioxide relatively weak (that is what you have showed, I think). Then comes radiative forcing: this can be understood simply by looking at toy models, which show that if the solar input or emissivity of the earth or the atmosphere (e.g. the greenhouse gasses) changes, the Earth's surface temperature changes. To conclude, models have shown that a doubling in CO2 concentration will likely cause a radiative forcing of around 3,7 W/m². One can now find that the coefficient for determining the radiative forcing caused by an increase or decrease of CO2 concentration from any given value A to B, will be C = 3.7 / ln(2) = 5.34 (and reversing the equation results in DF = 5.34 ln(co2/co2_orig) ). I am just a layman but I am pretty sure the value you quoted, 5.35, is NOT the total emissivity of carbon dioxide but only a coefficient effectively indicating the climate sensitivity to CO2 doubling. The value is not even in W/m² but dimensionless. Note of caution: I consider myself a layman and excuse me for any dramatic failures in reasoning. Willing to learn though :). Ben
  5. 5.35 needs to have units: delta T = W/m^2 [Ln (ppmv/ppmv)] / 4 (W/m^2*K^4) (K^3) If don't, how could we eliminate W/m^2 from Stephan-Boltzmann constant?
  6. I don't agree with consensus, I agree with science. In the last 50 years the Intensity of Solar Irradiance increased in 1981 uo to 1366.6829 W/m^2. Higher than in 1957 (1365.7689 W/m^2); consequently, in 1981 was higher than 50 years ago. In 2000 the ISI was 1366.6620 W/m^2, and it was higher than 50 years ago (ISI in 1957 was 1365.7689 W/m^2). The last year (2006) the ISI was 1367.25 W/m^2, higher than in 1957, 1981 and 2000. Is ISI increasing or decreasing in the last 50 years? The inciding IR upon the surface is not 240 W/m^2, but ~469 W/m^2. From the last load of energy, the surface absorbs ~356.15 W/m^2 (median ~342 W/m^2) (1- Manrique, José Ángel V. Transferencia de Calor. 2002. Oxford University Press. England. 2- Maoz, Dan. Astrophysics. 2007. Princeton University Press. Princeton, New Jersey Some scientists from the IPCC think that the value 5.35 W/m^2 is wrong... I agree: http://www.nap.edu/catalog.php?record_id=10787
  7. An increase of 1365,7689 to 1366,6620 is not in any way statistical significant. Pick two others years and you get a decrease (e.g. what Lockwood did). You did not account for the 11-year periodic cycle which needs to be substracted before looking at trends, which underlines the uselessness of randomly picking TSI from any given year or years. Ergo: looking at the data with the 11-year cycle substracted, the trend in the last 50 years is more or less neutral (+0,08 W/m²) and in any case not statistical significant, given the amount of variance in that same period. Inciding IR upon the Earths surface is not ~240 W/m², sure I agree with that, but then again I am not claiming it is (I said it was the outgoing flux at the TOA). The ~469 W/m² is the [total] incoming IR at the surface, which is a combination of solar flux and radiation coming from the GHGs (water vapour, carbon dioxide, so on). IPCC puts it at 492 W/m² as a consensus though. Of that amount about 452 W/m² goes into the atmosphere by latent heat exchange, evapo(trans)piration and absorption by GHGs (the latter roughly 350 W/m²). The atmosphere itself radiates 195 W/m² upwards into space and 324 W/m² downwards towards the surface. About 40 W/m² makes it directly from the Earth's surface into space. The incoming solar flux is ~235 W/m² (and outgoing as well), of which 67 W/m² is absorbed by the atmosphere and 168 W/m² reaches the surface. So summarizing: the [surface] incoming flux is ~492 W/m² and outgoing as well, the TOA incoming and outgoing flux is ~235 W/m². The atmosphere absorbs 519 W/m², most of it from below from the Earth's surface, and emits this upwards and downwards (mostly the latter). As far as I can tell, nothing of this appears in real contradication with your article from Manrique (2007). The 5.34/5.35 is indeed in W/m², I stand corrected. The ln(co2/co2_orig) only scales the value and deltaF is in W/m². Ben
  8. Well, let's compare 1957 (50 years ago) with 2006 (one year ago). In 1957 the ISI was 1365.7689 W/m^2, while in 2006 the ISI was 1367.25 W/m^2. Where is the decrease? The radiative forcing from ISI is 0.85 K per each W/m^2 of solar IR. From 1957 the extent of ISI has been 1.4811 W/m^2, that is 1.26 K. It is more credible than the 0.02 K from the heat absorbed by the CO2. The point where I don't agree with you is the radiative forcing for CO2, which is not 5.35 W/m^2, but 0.414 W/m^2. That was considered in the NAS paper. It seems, from the article, that the value for deltaF wasarbitrarly fixed.
  9. What is your source of 1367,25 W/m² for 2006, honestly for me it would seem like an unrealistic jump from the late 1990's to now. According to the PMOD-WRC data (link above, 'direct satellite measurements'), which is consistent with Lean (2000), the average TSI last year was 1365,4 or 1365,5 W/m² which seems more appropriate than 1367 W/m². In any case you cannot directly compare 1957 with 2006 because 2006 was the 11-year cycle minimum and 1957 was a cycle maximum, so compare maxima or minima or averages per solar cycle instead. E.g. if I use the Lean (2000) data from your webpage and compare 1957 with 2000 (maximum of solar cycles 19 and 23), I get 1366,681 and 1366,724, which equates to deltaF = 0,043 W/m² or a deltaT of 0,06 according to your equation. The first half of the century however I see a deltaF of 1,6 W/m² in the maxima and deltaF of 1,0 W/m² in the minima, equating to deltaT = 1,6-2,4 degrees. This strikes me more as a debate on data than principals or methods, by the way. The detrended data shows no [significant] decrease or increase in TSI/ISI. From that perspective I neither agree with the Lockwood article that ISI has decreased in the last 25 years nor with the claim that it has increased in the last 50 years. I would have to make myself more familiar with the exact fundamentals of radiative forcing before investigating whether or not the trend found would induce any (significant) forcing, your equation looks nice but I want to check it for myself first :-). On CO2 forcing: climate sensitivity to doubling of its concentration has a probability range even in the IPCC reports, however further discussion on this is not meant for this page.
  10. Small addition: this is what you get when you compare random years, say 1966 and 1996 (thirty years): 1365,951 and 1365,621, a decrease of -0,330 W/m². This is all using the Lean (2000) data from your webpage. Now 1966 was three years away from the maximum of cycle 20 in 1969 and 1996 was the minimum at the end of cycle 22.
  11. I like your analysis Ben. If you haven't, check Tamino's post "PMOD vs ACRIM." He did an outstanding job of examining solar data. Hope John isn't going to get tired of me always referring to other sites!
    Response: Not at all - the point of Skeptical Science is to point people to relevant resources, primarily the peer reviewed papers but good blog posts too. Tamino has two great posts which I link to from my Is the sun getting hotter? page (and I even lifted one of his graphs to use on my page).
  12. Ben Lankamp, the source is http://lasp.colorado.edu/science/solar_influence/index.htm It's not unrealistic given that the data is NH instrumental. Solar irradiance is going up, not down. You cannot take just one sunspots cycle out of context. The last would be pseusoscience.
    Response: The only information at the LASP page about long term trends in solar irradiance is the following graph:

    What it shows is a close correlation between Solar Irradiance (the orange line) and global temperature (dotted blue line). But they also show the correlation ends when the modern global warming trend begins in the mid-70's. The data is all there and it's unambiguous - there's a reason why so many studies (listed above under "Other Studies on solar influence on climate") conclude the sun's influence on recent global warming is minimal.
  13. No, what it shows is that the solar irradiance in 2006 was 1367.25 W/m^2.
  14. What it also shows for the 20th century is that the timing is not quite right. Temp increases sharply before the TSI and then, even before the TSI reaches its first 20th century spike, the temp actually starts to decrease, followed by a TSI decrease, and then the temp increases again, followed again (very modestly) by the TSI. If I was using a skeptical aproach to attempt a correlation between the 2 on this graph, it would appear that TSI was driven by temperature during the 20th century.
  15. I notice John, that you have done some renovating. Where did your last thirty years of satellite measurements of the TSI disappear to? To the unpracticed eye nothing out of the ordinary is apparent, but to people familiar with the site, it looks as though you are erasing key information that supports Biocab's contention that in regard to TSI it is the minimum measurement extended over time that is the most important. And the minimum is trending up - or rather was. If the current lack of sunspots extends a while longer, and the next solar cycle sees a drop in overall activity followed by a drop in global temperature, will you become a co2 denier? What about you Phil?
    Response: Not sure what you're refering to but I haven't removed anything (I am constantly tweaking the site but it's mostly adding links to new studies as I encounter them). Perhaps you were thinking of the discussion of satellite TSI data at The sun is getting hotter. As for the next solar cycle and the prospect of a drop in global temperature, it's funny you should mention that - I'm working up a page on that very subject which I'll post later this week.
  16. I'm checking out biocabs data and I cannot see where the mystery is here? There is no substantial hole where someone needs to plug CO2 into. http://biocab.org/Solar_Irradiance_is_Actually_Increasing.html#anchor_15
  17. So what is the data source for the dotted blue line? Is it USHCN? Or partially USHCN?
  18. I question the physics behind the response: a crucial finding was the correlation between solar activity and temperature ended around 1975....... The assumption is that there is always an energy balance between heat radiated from earth and input from the sun. Lets say that solar activity remained above this energy balance, one would have to assume that temperature would still increase, until some new energy balance is achieved. This means that temperature can still increase as long as the input is greater that the output. basic example: take a pot of water at room temperature, it is in an energy balance, and temperature is constant. then take that pot and turn the stove on high the temperature will increase then turn the elopement down, and the water still warms up. until it reaches an energy balance. It does not seem reasonable to assume that reduced solar activity always equals reduced temperatures on earth. Reduce solar activity, that is still more active then in 1900 should then still result in increasing temperature.
    Response: If solar activity increases then plateaus, the climate will then be in energy imbalance with more energy coming in than radiating back out to space. The earth will immediately start warming. As it warms, the energy radiated back to space gradually increases until the climate reaches radiative equilibrium. Then warming stops. This period it takes to reach equilibrium is refered to as climate time lag.

    However, this is not what is observed over the 20th century. Solar activity levels out in the 1950's. However, the modern global warming trend began in the mid 1970s. If the sun was the cause of global warming, the planet would've been at its highest energy imbalance in the 1950s. Then the planet would gradually have approached equilibrium over the next few decades.

    The opposite has occured. The energy imbalance has in fact increased over the past 3 decades and is still increasing. Of course, we now know why the planet is in radiative imbalance - due to an enhanced greenhouse effect caused by increasing greenhouse gases such as CO2 and methane.
  19. There is new evidence that TSI may have varied a lot less than previously thought, which would require an extremely high sensitivity to allow for such small variations to influence climate. http://www.leif.org/research/GC31B-0351-F2007.pdf
  20. I am seeing some papers that contradict the statement that the solar-climate connection somehow disappeared in 1975. To me it looks good at least through 2003, but, it seems the fit is good but the cause is too small for the effect. Neither the blue nor the red line in the second from top graph are right today, solar activity was most definitely not trending down in the 1998-2000 period for instance. Could you maybe update or correct them?
  21. I believe Leif Svalgaard paper (available as a pdf) might answer some of your questions. In any case, TSI and its reconstructions are thorny areas. See this post: http://tamino.wordpress.com/2007/07/24/pmod-vs-acrim/ and part2 of it as well. Would be nice to provide links or references when you mention peer-reviewed stuff, it helps. As an aside, Energy and Environment is not a peer-reviewed science publication.
  22. About the sun. Whether the solar irridiance has increased or not during the past 50 years, I think it's important to know that solar irridiance changes most in the shorter wavelengths such as UV during a sunspotcycle. Part of this extra radiation will be absorbed by stratopheric ozone and shouldn't reach the earth-atmosphere system at all. But... 1) Couldn't the climate became more sensitive to solar activity because of the 'ozone hole' the past few decades? Due to less ozone a higher intensity of UV-light reaches the earth surface. These are just the wavelenghts that an active sun submits. 2) Another point is that shortwave radiation penetrates deeper in the ocean as longwave radiation does (this effect gives the typical blue light in deep waters). So an active sun heats the deeper layers of the ocean where it can be stored for years or, probably, several decades, before it comes to the surface. This means that climate responds delayed on solar activity and perhaps explains the lag of about 10 years found by Solanki and the higher climate sensitivity for longterm sunspotcycles. The oceans absorb most solar energy in the tropics. The small zenit-angle results not only in a high net radiation but also in a deeper penetration of UV-light, and the ozone layer is thinner around the equator. Furthermore the ocean is stratified here so the heat can be well stored before it can be transported by ocean currents. The ocean releases its heat especially on higher latitudes to the atmosphere, possibly modulated by fluctuations in thermo-halien circulations. It also seems that climate responds more sensitive on high latitudes. This hypothesis means that we should't under-estimate the solar influence on global warming. Though there is no significant increase in solar irridiance in recent decades, the climate may still warming due to the major increase during the first half of twentieth century and loss of ozone. This is my first post on this site and I like to discuss about climate more. I'm a dutch meteorologist (semi-professional) and very interested in climate change and its mechanism. I'm not convinced by AGW because there are some questions left. Thanks to John Cook for this forum and the possibility to debate here with open mind. Regards, Victor de Vries
  23. Yes Victor, the change in output during high solar activity is not uniform for wavelength and I don't know how important that is. It does seem like a mighty large effect for such a small change so there must be something more to it.
  24. Odd I google it and get tons or references of course I typed in "Reginald Newell MIT" I felt it was safe to use him as an example as he has passed away. I would disagree that any of the 3 stated positions that were not supported by their research. Also if that was the criteria look how many people on the other side would be unemployed. Hey folks what is the other thread where people were discussing the solar spectra Victor asked about I cant remember.
  25. OK, I went back to do a little digging and found out that first, I appear to be incorrect since George Taylor appears to still be the State Climatologist. Was he one of the ones that you were thinking of? Anyway, keeping with Mr. Taylor, I tried to get a record of his publications and there was nothing listed on his site so I went the Web of Science and found the following 4 publications. Going back to your statement, “ people who have lost jobs because they did perfectly competent research that didn't support the AGW idea,” Which of these do you consider competent research that does not support AGW and how does it fit in with Mr. Taylor’s statements. Title: Regional precipitation-frequency analysis and spatial mapping for 24-hour and 2-hour durations for Washington State Title: Observer bias in daily precipitation measurements at United States cooperative network stations Title: A knowledge-based approach to the statistical mapping of climate Title: Spatial variability and interpolation of stochastic weather simulation model parameters In regards to Reginald Newell, thanks, the name change was a help. Unfortunately all I was able to find was a quote from an interview. Is there anything more substantive than that? Regards, John PS, For the thread with Victor, try It's the Sun

1  2  3  4  5  6  7  8  9  10  11  12  13  14  15  16  17  18  19  20  Next

Post a Comment

Political, off-topic or ad hominem comments will be deleted. Comments Policy...

You need to be logged in to post a comment. Login via the left margin or if you're new, register here.

Link to this page


The Consensus Project Website

THE ESCALATOR

(free to republish)


© Copyright 2024 John Cook
Home | Translations | About Us | Privacy | Contact Us