


 Arguments


Recent Comments
Prev 1987 1988 1989 1990 1991 1992 1993 1994 1995 1996 1997 1998 1999 2000 2001 2002 Next
Comments 99701 to 99750:
-
gallopingcamel at 17:30 PM on 14 January 2011What is the Potential of Wind Power?
"Brave New Climate" is an excellent source of information on energy issues. Here is a link on wind power: http://bravenewclimate.com/2010/09/01/wind-power-emissions-counter/ -
OPatrick at 17:27 PM on 14 January 2011What is the Potential of Wind Power?
I'm still holding out for Kitegen - accesses the much stronger and more reliable high altitude winds. http://cleantechnica.com/2010/10/16/astounding-eroei-of-kitegen-ready-to-test/ Can anyone tell me if there is any future in this? Seems it would be competing with planes for airspace (so win-win then!) -
kdkd at 17:18 PM on 14 January 2011The Queensland floods
Tom #58. I agree completely. You've taken my provision of enough scientific rope, and coiled it nicely on the deck, pending it's need for use some other time. The risk is of course that someone else will pick up your neat pile, tie it into a noose and slip. -
co2isnotevil at 16:40 PM on 14 January 2011The Physical Chemistry of Carbon Dioxide Absorption
KR, When the spectral characteristics of the Earth's emitted power spectrum are examined from space, there are spectral gaps at all of the absorption/emission wavelengths. We can explain this as the power passing through the transparent regions of the atmosphere. Based on the atmospheric transmittance, not enough power passes through from the surface and cloud tops into space, in fact, only about 40% of the required power passes through and into space through this window. Now the question for you is if the 60% of the missing power was emitted from GHG's in the absorption bands, which are the only places in the spectrum they emit, why are there absorption gaps in the measured spectrum? You must agree that the missing power is still passing through the transparent regions, just not originating from the surface or cloud tops. Where else can it originate from but the atmosphere itself? -
Philippe Chantreau at 16:25 PM on 14 January 2011Coral: life's a bleach... and then you die
Mike G your knowledge of coral and reef biology has proved quite helpful on this thread, as have the references you put forth. Thanks for your valuable contribution. -
co2isnotevil at 16:25 PM on 14 January 2011The Physical Chemistry of Carbon Dioxide Absorption
KR, I never said N2 or O2 absorbs or emits narrow band IR. However, O2 gas and N2 gas emit a broad band Planck spectrum of energy dependent on it's temperature. Are you trying to tell me that a gravitationally bound ball of N2 and O2 gas at some temperature T will remain at that temperature forever? Just because there's a ball of rock in the center doesn't change anything. -
citizenschallenge at 16:24 PM on 14 January 2011The Queensland floods
John, I'm coming in on this late, but want to share my relief that you and yours are OK, while sympathizing with all who weren't so lucky. I've spent hours reviewing various skeptic sites today, especially Morano's fraud - it makes me want to scream. How do they manage to keep up their glib fraud? -
The Physical Chemistry of Carbon Dioxide Absorption
co2isnotevil - Um, N2 and O2 do not emit in the IR; their emissivity is extremely low at surface and atmospheric temperatures, and they are essentially not factors in infrared blackbody (BB) radiation in the climate system. That's a red herring. The radiation seen at top of atmosphere is the surface radiation (BB spectra near 1.0 emissivity), clouds, and greenhouse gases. Not N2 or O2. If you disagree, please show the N2 and O2 emissive spectra in the IR. What I've seen shows no such IR emission from diatomic gases.
-
co2isnotevil at 15:43 PM on 14 January 2011The Physical Chemistry of Carbon Dioxide Absorption
hfranzen, Your energy balance on page 19 is relatively close to mine as discussed here. Your 302 W/m^2 of total absorption is close to my 292 W/m^2 and it is generally assumed that CO2 is about 1/3 (I calculate it as about 31%), which is why your 107.6 W/m^2 for CO2 alone may seem reasonable. However, my CO2 only absorption is for the clear sky, while the composite absorption (your 300 and my 292) is the cloud percentage weighted clear sky and cloudy sky absorption. One other point is the run I did for the earlier data was not at the average surface temperature, but the percentages are all correct, so the actual power absorbed is the percentage times your emitted surface power. Reading more of your paper, on page 24, you don't acknowledge that most of the power emitted by the atmosphere is not by greenhouse gas emissions, but is the BB radiation emitted by the rest of the atmosphere which has been warmed by GHG's. If you have any doubt that a heated gas emits BB radiation, consider that the photons from the Sun are BB radiation of the heated Hydrogen in the upper layers of it's atmosphere. Consider that we can measure the temperature of interstellar gas clouds by observing them in the IR. The picture on page 32 makes no sense. Is it CO2 absorption for Venus or something? The composite absorption of the Earth looks more like this.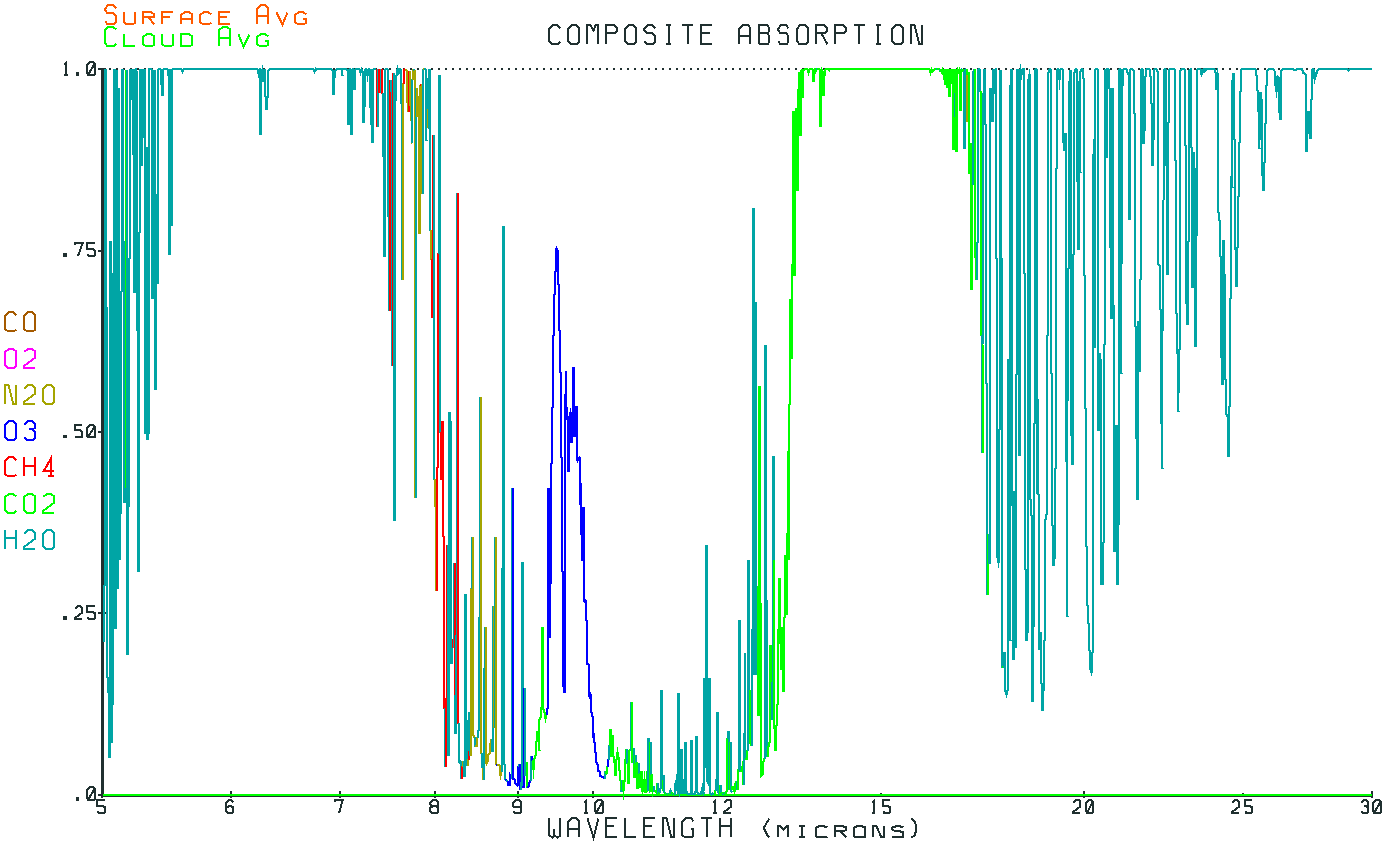 The colors indicate which gas is most responsible for each wavelength bucket. The image is shrunk a lot, so open it for a high resolution view.
The wave;ength resolution I've used is a logarithmic scale of about 26K buckets per decade with calculations performed over 4 decades from .1u to 1000u which is orders of magnitude finer than the spectral resolution you are using. I've also found that large wavelength buckets are not very accurate.
At this point it seems that you have 11 wavelength buckets spread between 9 and 19 microns, while my analysis covers over 100K logarithmic wavelength buckets between .1u and 1000u, moreover; my analysis with HITRAN data is far more accurate than yours using the Burch et all CO2 data. Whether or not your math is correct, which as far as I can tell looks OK, I know that the limited data you are starting from is insufficient to establish what you're trying to show.
The colors indicate which gas is most responsible for each wavelength bucket. The image is shrunk a lot, so open it for a high resolution view.
The wave;ength resolution I've used is a logarithmic scale of about 26K buckets per decade with calculations performed over 4 decades from .1u to 1000u which is orders of magnitude finer than the spectral resolution you are using. I've also found that large wavelength buckets are not very accurate.
At this point it seems that you have 11 wavelength buckets spread between 9 and 19 microns, while my analysis covers over 100K logarithmic wavelength buckets between .1u and 1000u, moreover; my analysis with HITRAN data is far more accurate than yours using the Burch et all CO2 data. Whether or not your math is correct, which as far as I can tell looks OK, I know that the limited data you are starting from is insufficient to establish what you're trying to show.
-
Mike G at 15:29 PM on 14 January 2011Coral: life's a bleach... and then you die
#39 Off the bat I have to admit that I'm not familiar with the research on the effects of warming or acidification on sea urchins, but we'll assume your recollection is good since it doesn't really change the answer of how that would affect reefs. The simple answer is "it depends." Some species of urchins are important grazers that prevent corals from being out-competed by algae. Their presence in sufficient numbers can increase coral cover by ensuring coral larvae have a clear place to settle. However, overabundance may also slightly reduce coral recruitment since they end up scraping off the coral larvae along with the algae they're eating. Other urchins like Echinometra tend to have a negative impact on coral cover for a couple of reasons. One is that they're basically the reef's bulldozers. They eat almost everything in their path including coral larvae and coralline algae. Coralline algae are important because they acts as a settlement cue for corals. The latter group of urchins are also important because they bore into the structure of the reef itself, and are one of the most important bio-eroders on the reef. In a world where the growth rate of the reef is reduced, a concurrent increase in erosion due to rock-boring urchins would hasten the transition to a "dead" reef- which basically just means that the corals don't grow fast enough to keep up with erosion. So depending on which species benefit more from acidification/temp change and how much they benefit, the impact could probably go either way. -
Mike G at 15:12 PM on 14 January 2011Coral: life's a bleach... and then you die
@mfripp The map in #5 isn't a map of coral stress. In fact, there are no coral reefs in large parts of the highlighted watch areas- e.g. most of the area between Australia and Madagascar or below about 25S. The map is just a model estimate of where conditions are likely to cause bleaching based on parameters like sea surface temperature anomalies. Some of the more sophisticated models also take wind and cloud cover into account, though I'm not sure if this particular one does. There's no latitudinal pattern to the map because in essence it's a map of cumulative SST anomalies, which don't necessarily increase towards the equator. -
archiesteel at 15:03 PM on 14 January 2011Coral: life's a bleach... and then you die
@HR: "I understand you don't like that but it doesn't make him a denier." Enough with the weasel words. You should apologize to Albatross. That would be the classy thing to do. -
Phila at 14:27 PM on 14 January 2011Could global warming be caused by natural cycles?
Putting aside whether apirate's interpretation of the graph is defensible, I think his question is somewhat silly. "Intelligent and educated" people routinely believe bizarre things on the basis of little or no evidence. What people need, generally speaking, is a self-reflexive stance that allows them some critical distance from their ego, political assumptions and so forth. Without that stance, and the humility that tends to accompany it, intelligent and educated people are as prone as anyone to make fools of themselves. Maybe more so. An educated and intelligent person might well look at this chart and doubt AGW. But a really intelligent, really educated person would then go on to consider whether it's plausible that thousands of scientists who have drawn the opposite conclusion are misreading the chart. That kind of self-questioning is what tends to be missing from the "skeptical" outlook, in my experience. Particularly when assessing a field that's not your own, the truly intelligent and educated approach is to assume that the experts in that field know a lot more about it than you do. And that if you propose to challenge them on their own turf, you need to start by gaining the same level of knowledge. There are very few "skeptics" on this site I'd describe as stupid or uneducated. Willful ignorance is a different matter entirely, and it's perfectly compatible with intelligence and education. In other words, I really don't understand what apirate is hoping to accomplish with this line of argument. -
actually thoughtful at 14:10 PM on 14 January 2011Could global warming be caused by natural cycles?
Apirate@116 - I can understand why thinking people doubt - until they examine the evidence! I started out "believing" in AGW - after all, scientists who dedicated their careers and lives to this research (for little pay - even now) had come to this conclusion - no upside for them. Then I began to see all the doubt, and I went to sites like The Air Vent and the Blackboard. These are sites were VERY smart people try to pick apart climate theory. I noticed that they focused on one world government, that they thought cap and trade was a bad idea. But when they focused on the science - they tended to support, or find that, using their analysis, warming was misstated by climate scientists by a few percentages (remember the Urban Heat Island issue? they tried to prove that UHI was inflating the data at the Blackboard - they instead found that climate scientists UNDERstated warming by a tenth of a degree or so, because they were too vigilant in correcting urban-influenced sites. So I then began to critically examine the arguments, and I found skeptic arguments, with the possible exception of the missing ocean data, were provably false. So I now know AGW is the correct theory (within the limits of scientific understanding) I have answered your question cheerfully - will you do one favor for me? Express as clearly as you can your strongest reason for doubting climate science (I say climate science because most people don't realize that AGW=climate science - if you understand climate science then you are an "AGW believer"; "pro-AGW" (your term); and you understand AGW.). Once you state it, read the responses you get here (and the explanations provided in the skeptic arguments section, and honor us with either a "I know understand this element and agree with the climate scientists" OR "I still don't agree because X." And then repeat this holistic process with each of your arguments. Most skeptics get to the point of stating their argument, but then they never process it and either state why it explained the matter to their satisfaction, or what information they need to satisfy themselves. It is a complicated issue - but I think anyone (such as myself even) who is not willing to accept what the highly trained professionals tell us at face value is responsible for understanding it on their own. It seems weird to not accept the scientific evidence, but not have nay other theory to support in its stead (I am ruling out denial as a scientific theory...) -
Could global warming be caused by natural cycles?
apiratelooksat50 - "Can you understand (not agree!) how intelligent, educated people around the world can question the theory of human induced climate change?" Yes, apiratelooksat50, but I cannot agree with them. In one word, "rates". We're warming at 5-6 times the fastest rate ever seen in the historic record, without any of the forcings (orbital inclination, solar variance) that have induced those changes. The only thing that matches current warming is CO2. When I state that I understand why people might not agree, I'm referring to any number of reasons - the feeling that we can't be affecting the globe, anthropocentric "the world was made for us" views, reluctance to change, the "get dem darn revenuers outta my back yard" resistance to large scale social interaction, any number of things. Reasons that I do not consider rational. Strong, yes, rational, no. Given the chart, and an unbiased reading of it, I can only conclude that we've f&%$@^d things up, and we're changing the climate. I don't understand how any other conclusion could be reached unless biased by preconceptions. -
Phila at 13:58 PM on 14 January 2011Could global warming be caused by natural cycles?
There is always something to learn! The effect of volcanic eruptions on the stratosphere, for instance. And the pointlessness of citing a decade-old opinion piece as "evidence" of cooling. -
muoncounter at 13:57 PM on 14 January 2011Could global warming be caused by natural cycles?
#117: Thanks, but SkS is not my website; I'm just a passenger on this bus. But I look forward to their questions and/or input. #116: What I cannot understand is how a scientifically or mathematically literate person can look at the GISS graph in #105 and not be struck that something very unusual is happening. Said literate person would then begin researching context (perhaps here), look for consistent explanations (and as I believe many have done), find a wealth of evidence that points to AGW or ACC or whatever we are calling it now. The literate person will weigh the evidence and consider the opinions of those with more experience in the field. In that process, the arguments of the so-called skeptics, particularly their reliance on unknown 'natural cycles' will come up short. You say 'given the chart'; I say the GISS graph is just one link in a long chain that must be followed to its logical conclusion. It's not easy, but it is an interesting and very important puzzle. -
Marcus at 13:56 PM on 14 January 2011Could global warming be caused by natural cycles?
apiratelooksat50 "Given the chart: Can you understand (not agree!) how intelligent, educated people around the world can question the theory of human induced climate change?" No, I can't. If you're going to question the theory, then you need to have a firm, scientific basis for doing so-yet you've failed to provide any basis beyond a strongly held belief. Look again at figures A & B at #105. The warming caused by the Milankovitch cycles occurred over *thousands* of years-equating to an average warming rate of less than +0.02 degrees per decade. The warming which has occurred since 1950 has been at a rate of +0.12 degrees per decade-with no sign of it leveling off. Since 1980, the warming rate has been +0.16 degrees per decade-suggesting that the warming trend is *accelerating*. This is in spite of the fact that the PDO has been trending downwards, & Total Solar Irradiance has fallen at a rate of 0.02 Watts/Meter Squared over that same time period. Not only that, but every *natural* source of warming should be warming the *entire* atmosphere fairly equally. Yet what we're seeing is a warming of the troposphere, but a cooling of the stratosphere-consistent with heat being trapped in the lower atmosphere & failing to get out to space. When you can provide a rational, scientific explanation for these phenomena, I'll be more than happy to listen to them, but so far you've failed to provide any. You learning anything yet? -
hfranzen at 13:52 PM on 14 January 2011Seawater Equilibria
I have recalculated the equilibrium results for surface seawater acid=base reactions using the data from F.J.Millero, Geochim. & Cosmochim. Acta, V 59, #4, pp 661-677, 1995. I now have linear equations for the total molality of dissolved CO2 vs. T at 387 ppm and vs P(CO2) at 288K and for the molality of hydrogen ion vs. P(CO2) at 288K. The results (and I will be happy to provide as much detail as anyone wants) show that if at 288K we could reduce the ppm to 350 instantaneously the decrease in equilibrium molality (the value toward which the total molality would drop if 350 ppm could be maintained) would be such that the total amount of CO2 removed from the atmosphere to get down to 350 ppm would be equal to the decrease in the total dissolved carbon dioxide in only 4.11 times 10 to the 19th kg of ocean. I say only because this is only 3% of the total ocean. In other words at an average depth of 3000 meters it would take only 90 meters of the surface oceans to provide, through the decrease in solubility, the same number of moles of CO2as were removed to get down to 350 ppm. Of course the ppm will not drop instantaneously to 350 ppm but this calculation shows the dimension of the problem faced by humankind. When we decrease our CO2 production slightly the oceans will respond by taking the gas phase content back in the direction of the starting point. In the instantaneous hypothetical about half way back. In the case of a slight decrease most of the way back. As the deniers have always said there is a very large amount of CO2 dissolved in the oceans- I just don't think they reasoned their way to the time bomb that represents for all mankind. -
apiratelooksat50 at 13:40 PM on 14 January 2011Could global warming be caused by natural cycles?
Muon @113 I actually have forwarded your website to my colleagues along with other websites. I've even linked to them on my school website and my Facebook page. I stress to my students to examine all sides and make up their own minds. That's why I love science. There is always something to learn! -
Marcus at 13:40 PM on 14 January 2011What is the Potential of Wind Power?
Whatever its current potential, it can definitely be increased via application of suitable storage technologies-to alleviate the issues of supply-demand offset curves. The most promising technology I've seen in this regard are Vanadium Flow cells, which can store quite significant amounts of power for release when wind speeds drop. This might hopefully mean that Wind-farms can supply a larger number of homes-but be of a smaller size. -
Albatross at 13:37 PM on 14 January 2011The Queensland floods
Eric @62, First, and FWIW, I for one actually appreciate (most of) your skeptical comments here. I need to look at the data more closely. The waters surrounding Oz have warmed significantly (> +0.7 C) since around 1900, with more than half of that occurring since the 60s. I'll get back to you once I've had a chance to look more carefully at the proxy data. With that all said, your argument about natural variability is a wee bit of a straw man...but more on that later too. My wife is going to give me heck-- Mma Ramotswe awaits. -
apiratelooksat50 at 13:35 PM on 14 January 2011Could global warming be caused by natural cycles?
Only KR attempted to answer my question. I am going to ask again. Refer to the chart the Moderator inserted at #105. Certainly, CO2 is spiking. Temperature has spiked for this cycle, and depending on the timeframe you analyze is either rising, holding steady or falling. Without debating what is happening now, or in the past 10 years, 30 years, 100 years, or whatever time period with temperature: Given the chart: Can you understand (not agree!) how intelligent, educated people around the world can question the theory of human induced climate change? Forget about anything else I've ever written, hinted at, been disagreed with, or been misunderstood about. And, just answer that question.Moderator Response: [Daniel Bailey] As an educator, surely you can appreciate one of your students trying to over-simplify something which is irreducibly complex. That is what you are doing. The temperature rise of the past 30 years is unparalleled in the paleo record. Over 100 years of hard-won knowledge of atmospheric physics and empirically-measured factors all point to the same explanation: the rise in CO2 (which is anthropogenically derived) is acting as a forcing to temps, driving them upwards (and will continue to do so beyond our lifetimes). Intelligent, educated people around the world (even educators) understand this. How is it you do not? You are failing this test. -
Marcus at 13:23 PM on 14 January 2011Could global warming be caused by natural cycles?
"Stratospheric temperature decreased after each volcanic eruption and then very slowly growing." I'm sorry, but this claim is factually *incorrect*. Volcanic Eruptions actually *warm* the stratosphere-not cool it-as the graph you link to clearly shows. Yet in spite of several major warming spikes, caused by major volcanic eruptions, there is a clear cooling trend in the stratosphere. Indeed, this cooling trend is almost a mirror image of the warming trend in the troposphere. Now what *natural* phenomenon can you think of that can consecutively warm the troposphere & cool the stratosphere? I certainly can't think of any-but I know of one man-made phenomenon which can. -
Eric (skeptic) at 13:22 PM on 14 January 2011The Queensland floods
Tom Curtis (and Albatross), the data from the chart in #59 seems to show as much variability as the chart in the paper I linked in #51 which is a measurement at a single location (albeit well north of Australia), so I'm not sure the averaging helps. The single location chart ends around 1950 at an anomaly of zero. The chart in #59 is at about 0.25 in 1950 (the gray bars) about 0.6 below the 1990's average as you said. That means the current anomaly would be 0.6 on the chart linked in #51 about 1/2 of the peak 1000 years ago. So the current measured SST anomalies are well within the range indicated by the proxies. -
muoncounter at 13:14 PM on 14 January 2011Climate sensitivity is low
UCAR strikes again: New study sure to stir up the sensitivity discussion: The study also indicates that the planet’s climate system, over long periods of times, may be at least twice as sensitive to carbon dioxide than currently projected by computer models, which have generally focused on shorter-term warming trends. This is largely because even sophisticated computer models have not yet been able to incorporate critical processes, such as the loss of ice sheets, that take place over centuries or millennia and amplify the initial warming effects of carbon dioxide. --emphasis added -
Daniel Bailey at 13:01 PM on 14 January 2011Could global warming be caused by natural cycles?
Re: apiratelooksat50 (105) Please see my in-line response to you in your comment at 105 above. Thank you. The Yooper -
Albatross at 12:50 PM on 14 January 2011Coral: life's a bleach... and then you die
HR @40, I have little tolerance for people misrepresenting my views, and you just did exactly that #40. I labeled no-one a "denier" as you claim. And,what I most definitely do not like is people distorting and misrepresenting the science as has been done on this thread. That does not constitute a "healthy debate". On that note, my frustration has nothing whatsoever to do with me not liking people having opposing views....but rather that having to continually counter the seemingly endless stream of misinformation and misleading statements coming overwhelmingly from "skeptics"-- if that were not an issue then there would be no need for Skeptical Science in the first place. Finally, please read the main post again and Rob's post @32 . The scientists in this field are not attributing all the problems facing coral to AGW. In fact, in my post @27 I made specific reference to cumulative impacts. That by definition means that I understand that there is more than one stressor at play here. So again, you have distorted my stance on this issue when you say "Arkadiusz has principally been drawing our attention to published scientific work. I understand you don't like that...". That sounds like innuendo to me. The long-term prospects for coral reefs around the world are not promising, and in all likelihood, the literature suggests that the multitude of problems and challenges that coral reefs face are only going to amplify as ocean acidification and bleaching ramp up. -
muoncounter at 12:49 PM on 14 January 2011Could global warming be caused by natural cycles?
#112: "science educated, experienced teachers (college and high school) who do not believe in the AGW theory" Perhaps Mr. Pirate could recommend SkS to some of his colleagues. Good educators -- especially in the sciences -- are expected to be 'life-long learners' and there's plenty to learn from right here. -
GCNP58 at 12:07 PM on 14 January 2011What is the Potential of Wind Power?
oops, try this: Article in Atmos. Chem. and Physics describing weather modification by large wind power arrayModerator Response: Thanks, but please provide some context--even one sentence--for links. -
GCNP58 at 12:05 PM on 14 January 2011What is the Potential of Wind Power?
http://www.atmos-chem-phys.net/10/769/2010/acp-10-769-2010.pdf -
HumanityRules at 11:54 AM on 14 January 2011Coral: life's a bleach... and then you die
39 Albatross It's obvious there is a health debate on the issue of corals and climate change in the literature. There's no reason that debate shouldn't be reflected on this website. Simply labelling people deniers won't work. Arkadiusz has principally been drawing our attention to published scientific work. I understand you don't like that but it doesn't make him a denier. -
hfranzen at 11:33 AM on 14 January 2011The Physical Chemistry of Carbon Dioxide Absorption
Response to #78. I am sorry, but I cannot understand the point of your first paragraph. It seems to me you are confusing albedo and absorption. In GWPPT6, when I introduce the idea of a 255 K earth, I clearly state in the absence of other sources of energy at the surface. Then, a slide or two later, I erroneously attribute the difference between the average temperature (288K) and 255 K to GHG's alone. I thank you for pointing it out this error. However I make no use of the difference except to say that the goal of my effort is to find the contribution that CO2 makes to the difference, so the error has no impact on the result. As to the question about the volume of the clouds - the point we were discussing has to do with the importance of the interaction between water and CO2 and it is your caim, apparently, that water vapor interferes with the CO2 absorption in the clouds. The quantity of CO2 so effected certainly would depend upon the volume of the clouds. The overall question we are discussing is, "what is the impact of water vapor upon the absorption of infrered energy by CO2?" If there were many overlapping spectral lines from the two vapor species (What is the evidence that there are? Why would one expect there to be?) then those overlapping wavelengths would be reduced in intensity by the water vapor absorptions and the CO2 would be less of an absorber than it is on the absence of the water vapor. But that is what the calculation of #65 shows to not be the case. Of course, as I stated above, I think there is something wrong with the calculation of #65 because the numbers are completely different from what is calculated in GWPPT6. I have no way of knowing what went into the calculation of #65 - on the other hand the data and equations used in GWPPT6 are there in the open for all to see. So if you think the physics of GWPPt6 is wrong in some way show me the error and I will retire in defeat. -
archiesteel at 10:57 AM on 14 January 2011Could global warming be caused by natural cycles?
@yooper: "Commenters on "both sides" of debate get moderated on SkS. " I can attest to this. I have often been moderated for being to harsh in my responses to den...er, I mean, "skeptics." @pireate: You are not being singled out because of your opinion. You are being moderated because your comments are found to violate the site's policy. Take it in stride, just like the rest of us. "I believe for the most part most researchers are honest people and most likely gravitate to schools or institutions that support their beliefs and findings." That's utterly ridiculous. Good schools don't "support the beliefs" of scientists, because science isn't about belief or opinion in the first place. That kind of thinking belies your considerable bias on this subject. "The fact that there are science educated, experienced teachers (college and high school) who do not believe in the AGW theory, should cause you to at least consider their position." Not really, because their position is *always* based on the same faulty science we've been debunking for years. Simply put, contrarians have yet to come with a *single* valid argument against AGW. If you're going to go with Argument from Popularity, you should consider that 97% of publishing climate scientists support AGW theory. I'd argue you're basically saying that only 3% of climate scientists are both onest and competent. That's an extraordinary accusation, and one made without evidence. How is that not smearing the good names of thousands of hard-working scientists? -
Tom Curtis at 10:54 AM on 14 January 2011The Queensland floods
Berenyi Peter @52, if you look at the trend map for precipitation over the same period, you will see that simply taking an Australian average hides a lot of devil in the detail In particular, the increase in average rainfall in the north of Western Australia and the Northern Territory clearly dominates the average, but that does not free Queensland and Victoria from their recent trend towards droughts in most years, nor Perth from its ongoing drought even in this wetest ever of Australian years.
-
Albatross at 10:44 AM on 14 January 2011The Queensland floods
Tom @59, You beat me to it! Thanks. -
hfranzen at 10:42 AM on 14 January 2011The Physical Chemistry of Carbon Dioxide Absorption
Response to #78 in regard to #77. My use of the Planck distribution is spelled out in detail in GWPPT6. If you have read it you will have the answer to you question, which is not phrased in a way that can understand. Of course i think i used the law correctly - if I did not show me my error. -
Tom Curtis at 10:40 AM on 14 January 2011The Queensland floods
Eric, I would find this most recent graph interesting: It clearly shows the average SST around Australia over the last decade to be 0.6 degrees C over the 1950's average, and 2010 to be 0.8 degrees C over the 1950's average. The significance is that the final datum in your second source is circa 1950. Therefore Australia's current SST's are approximately 1.8 degrees greater than the minimum at the LIA.
Given that the data from that site are for individual locations, while the Australian data is an average of all Australian waters, we would expect the Australian data to show significantly less variability (as would the data from the other site if averaged). Therefore it is reasonable to conclude that the Australian SSTs are near or at a maximum for the last 2000 years, not just the last 100 years.
Of course, as you well know, it is voodoo science to simply point to a similar range of variability and assume that therefore no explanation is required. Changes require causes, and no non-anthropogenic causes can plausibly explain the late twentieth century warming. In contrast, it is difficult to device a plausible theory of the greenhouse effect in which anthropogenic emissions do not cause warming of similar magnitude that that which we have seen.
It clearly shows the average SST around Australia over the last decade to be 0.6 degrees C over the 1950's average, and 2010 to be 0.8 degrees C over the 1950's average. The significance is that the final datum in your second source is circa 1950. Therefore Australia's current SST's are approximately 1.8 degrees greater than the minimum at the LIA.
Given that the data from that site are for individual locations, while the Australian data is an average of all Australian waters, we would expect the Australian data to show significantly less variability (as would the data from the other site if averaged). Therefore it is reasonable to conclude that the Australian SSTs are near or at a maximum for the last 2000 years, not just the last 100 years.
Of course, as you well know, it is voodoo science to simply point to a similar range of variability and assume that therefore no explanation is required. Changes require causes, and no non-anthropogenic causes can plausibly explain the late twentieth century warming. In contrast, it is difficult to device a plausible theory of the greenhouse effect in which anthropogenic emissions do not cause warming of similar magnitude that that which we have seen.
-
hfranzen at 10:37 AM on 14 January 2011The Physical Chemistry of Carbon Dioxide Absorption
Response to #80. Two points: 1. What matters to me is that the calculation (for what its worth) shows that there is neglibible decrease in the absorption as a result of adding H2O. 2. On the other hand I doubt the correctness of the calculation ca;cu;ation on which you base your numbers- see my comments above, esp. the numbers in # 77. If you have a response to my query about the numbers cited I will listen. A repeat of the same numbers (as in your #80) convinces me only that you are unable to respond to my question. -
Albatross at 10:33 AM on 14 January 2011Coral: life's a bleach... and then you die
Mike G @34, Many thanks for your informative posts....thanks to you I learned something new today. That said, I am annoyed that some "skeptics" posting here tried to misinform everyone, again. They almost had me convinced....so thanks for setting the record straight. Maybe some of your information could be added to Rob's excellent post? Mike and Rob, a quick question if you don't mind. In 2001 my wife and I were on honeymoon in Mauritius and I got to do some snorkeling. The reefs were not in good shape, but I did see a stack of sea urchins. I recall reading an article recently (was is on BBC or ScienceDaily?) that sea urchins are expected to do very well compared to other species as the pH continues to lower and as the oceans warm. My question is this. In the event that bleaching and/or higher pH disrupt a coral reef, are they then also at threat from other species (such as sea urchins)moving in and out competing them? If so, that would be yet another in a long line of stressors affecting the corals. -
Paul D at 10:14 AM on 14 January 2011Could global warming be caused by natural cycles?
apirate I am not sure what you mean that a teachers position on a subject should be considered?? Is science about democracy?? Your story IMO doesn't add up. -
Tom Curtis at 10:09 AM on 14 January 2011The Queensland floods
kdkd @56, while most La Nina's will bring floods to Queensland somewhere, it is not common for them to bring major flooding to Brisbane without some additional factor (in the two best documented prior cases, a cyclone). Further, there is no data that suggests that warm SST cause La Nina events. If anything, globally warmer SST's tend to make El Nino events more likely. La Nina events certainly do cause higher sea surface temperatures around Australia, which leads to higher rainfall on the east coast generally, and more frequent cyclones in the tropical north and east coasts. On top of that, Global Warming (whatever the cause) has combined with the current very strong La Nina to create record high SSTs around Australia which is almost certainly a major factor in the very wet year that has been experienced by Australia, and also in the various flooding events around Australia at the moment. The fact that a La Nina is involved is why Queensland is coping it more than most. (And will continue to cop it, we can expect at least one or two major cyclones to make landfall in Queensland in the coming months, although the Northern Territory and northern West Australia will probably also cop a couple. And of cause, although a warming world will heighten the effect of La Nina events on precipitation in Australia whatever its cause, the cause is known to be Anthropogenic emmissions of green house gasses by fairly overwhelming evidence. -
Tom Curtis at 09:57 AM on 14 January 2011The Queensland floods
Michael Sweet, the 1893 floods and the 1974 floods where both caused by cyclones following on from weeks of rain. It is uncertain whether 1941 was also caused by a cyclone, and there is no record (that I know of) that it was. This may be because cyclones can cause rain hundreds of kilometers from their center (as was the case in 1893, where the cyclone crossed the coast at Yepoon) and Queensland was effectively unsettled at the time so no record was made of the cyclone. It may also be because a cyclone was not involved. -
Bob Lacatena at 09:56 AM on 14 January 2011Could global warming be caused by natural cycles?
100, apiratelooksat50,...should cause you to at least consider their position.
I don't consider anyone's "position." I look at facts and explanations, I study until I thoroughly understand, and then I either arrive at a conclusion (in agreement or at odds with any particular source), or else I "shelve" it in my head and wait for more information. I spent many years as a "true skeptic," in that I did not know what to believe, and so I researched each and every argument I saw, taking them each at face value. After many years of this, I began to become more and more comfortable with almost all of the information and arguments, from paleoclimate to physical and atmospheric chemistry to statistics to feedbacks and ice ages and so on. It's been enlightening, and fun, and a valuable experience. But at the very end of that long road, I found that 99.999% of the arguments against AGW are in fact smoke and mirrors. I began to be embarrassed at some of my own past doubts, and I began to look very, very carefully at any and every new magic nail that skeptics tried to hammer into the AGW coffin. Now, I barely flinch when I see the latest paper by Lindzen and Choi, or Miskolczi (lol), or the latest proclamation from anywhere. I'll eagerly read it, if I can, just for fun, just as a test to see if I can see the inevitable glaring faults. And if I fail, I just wait for those who are more experienced (and have more time) to do it. But it always, always turns out that way. But at the end of the day, my own "position" is entirely one of understanding, and I have no doubts whatsoever about almost all of the issues. This is what concerns me, because in this thread and others, you seem to present the same long (almost unending) laundry list of ill-founded doubts that float around the Internet that I now smile at (condescendingly). If your own doubts were limited to just a few of these, that would be one thing. That you repeat so many clearly fallacious arguments, and will not alter your position when presented with clear and concise discussions of facts, is concerning. I'm not putting you down. On the contrary, I'm merely trying to point out that you have come across as a closed minded individual, who is easily swayed by close-but-not-quite scientific arguments. If you are a science teacher, that is unacceptable. You must hold yourself to a higher standard. You should become a true skeptic. You should treat everyone and everything with sincere doubt, and learn until you feel you truly understand. Your level of understanding now is not adequate for a science teacher. -
kdkd at 09:49 AM on 14 January 2011The Queensland floods
michael sweet #54 It seems to be fairly that the floods are the result of a strong La Niña phenomenon caused by ... wait for it ... unutually high sea surface temperatures. -
RW1 at 09:43 AM on 14 January 2011The Physical Chemistry of Carbon Dioxide Absorption
hfranzen (RE: 75), "Compare 3 and 4. If water vapor were interfereing seriously with CO2 absrption the removal of water vapor would have a greater effect than 2 parts in 60. I am very happy accepting a 3% error in my transmittance as I know this will translate into a much smaller error in the change in transmittance with increasing ppm and thus to a quite accurate calculation of the increase in flux" What matters is the amount of reduction in total increase of 2xCO2 as a result of H2O overlap. According to the numbers presented above in # 65, 2xCO2 is about 25% less with water vapor overlap (about 3.6 W/m^2 instead of about 4.8 W/m^2). That's pretty significant. -
mfripp at 09:42 AM on 14 January 2011Coral: life's a bleach... and then you die
#37 Thanks. -
Rob Painting at 09:21 AM on 14 January 2011Coral: life's a bleach... and then you die
mfripp @ 36 - I would expect the water equator to be hotter than the waters closer to the poles. Thus, shouldn't the thermal stress be larger closer to the equator? I imagine that's a common misunderstanding, but coral & their photosymbionts have evolved tolerance to local conditions. There is no single fixed heat tolerance threshold for all coral colonies worldwide, it varies according to the local conditions. Some are better adapted to warmer waters, but despite this they all have one feature in common - they bleach when waters warm too much above the normal summer maximum. If, for instance the waters near the equator were warming faster than anywhere else (as your scenario imagines) then yes, I expect we would see bleaching more common near the equator. The background ocean warming isn't large enough (yet) for scenarios like that to occur, instead what we are seeing is more frequent pulses of warm water welling at the sea surface, with no clear pattern of this heat distribution as yet. Modelling studies project bleaching will become more frequent and extensive as ocean temperatures rise. -
The Physical Chemistry of Carbon Dioxide Absorption
co2isnotevil - "Non GHG temperature" is a Gedankenexperiment; sufficient to show that conditions would be different if something changed. Arguing about details of the hypothetical does nothing to invalidate the issue of changing the reality. -
muoncounter at 09:19 AM on 14 January 2011Could global warming be caused by natural cycles?
#105: "temperature appears to be leveling off" So much for the scientific method, which requires data to substantiate any hypothesis. Hypothesis: temperatures leveling off Data: the latest announcement of temperatures for 2010. Analysis: Data conflicts with results predicted by hypothesis Conclusion: Hypothesis invalid "it becomes a matter of choosing timescales to demonstrate any appreciable warming." Again, see the graph here. No choice of timescale necessary. What is your hypothesis for what makes the right-hand end of that graph so different from the rest?
Prev 1987 1988 1989 1990 1991 1992 1993 1994 1995 1996 1997 1998 1999 2000 2001 2002 Next


