


 Arguments


Analysis: Why the new Met Office temperature record shows faster warming since 1970s
Posted on 1 January 2021 by Guest Author
This article, authored by Zeke Hausfather, was originally published on the Carbon Brief website on Dec 17, 2020. It is reposted below in its entirety. Click here to access the original article and comments.

Sunset in Kenya
The first major update of the UK Met Office’s global temperature dataset in eight years moves it from one of the slowest warming records to the fastest.
A number of different research groups around the world provide estimates of global surface temperatures. They differ based on their starting year, the corrections they make to changing measurement techniques, and how they deal with gaps between measurement locations. However, all show similar levels of warming over the past 150 years: between 1C and 1.2C.
One of these records, HadCRUT4 – produced in a collaboration between the Met Office Hadley Centre and the Climatic Research Unit at the University of East Anglia – showed the lowest warming of the bunch, at least 0.1C below most of the others. Its newly published successor – HadCRUT5 – corrects some remaining issues in the old record and brings it more closely in line with other groups.
The step-change is due to two major updates in the Hadley record. First, the new record includes an update in the sea surface temperature (SST) record it uses – from HadSST3 to HadSST4. Among other revisions, this new SST dataset corrected some issues in ship-based measurements by using more reliable data from buoys, increasing warming by around 0.1C in recent years.
Second, the new HadCRUT5 dataset uses statistical analysis to fill in gaps in data collection in the Arctic and other regions that were not covered in HadCRUT4. As the Arctic is the fastest warming region of the world, its more complete inclusion also increases global temperatures by up to an additional 0.1C.
HadCRUT5 is currently only available for the period 1850-2018, but it will be updated to the present day (and on an ongoing monthly basis) at some point in early 2021.
The changes made to HadCRUT5 will increase the likelihood that 2020 will be the warmest year on record in that dataset (HadCRUT4 is exceedingly unlikely to show a new record in 2020), though it is too soon to know for sure until it is updated for the full year.
Faster warming since the 1970s
The Met Office Hadley Centre/UEA HadCRUT dataset combines a land temperature record from UEA called CRUTEM with an ocean temperature record from the Met Office called HadSST. The earlier HadCRUT4 record combined CRUTEM4 land data with HadSST3 ocean data, while the new HadCRUT5 record combines CRUTEM5 land data with HadSST4 ocean data.
Two different variants of HadCRUT5 are provided by the Met Office. The first – called “HadCRUT5 non-infilled” – uses the same methodology as HadCRUT4, just with updated datasets. It still leaves the five-degree-by-five-degree latitude/longitude grid cells without any observations blank. The second variant – called “HadCRUT5 analysis” – fills in these gaps using a statistical approach called a gaussian process regression. This approach is quite similar to the kriging approach used by the Cowtan and Way and Berkeley Earth datasets. The intention is for HadCRUT5 analysis to be the version primarily used by researchers in the future.
The figure below shows how the old HadCRUT4 dataset compares to both HadCRUT5 non-infilled and HadCRUT5 analysis from 1850 to 2018. The top panel shows the temperature data relative to the 1850-99 period (often used as a reference for pre-industrial temperatures), while the bottom panel shows the differences between the two HadCRUT5 variants and HadCRUT4. The shaded area in the top panel represents the uncertainty range in HadCRUT5 analysis.
![]()
Annual global average surface temperature anomalies from HadCRUT4 (dark blue), HadCRUT5 non-infilled (light blue), and HadCRUT5 analysis (red). Top panel shows data relative to 1850-99; bottom panel shows difference from HadCRUT4. Chart by Carbon Brief using Highcharts.
About half the additional warming in HadCRUT5 relative to HadCRUT4 is found in the non-infilled version. This is almost entirely due to changes made in the SST dataset – HadSST4 – involving corrections to biases in ship-based measurements using more reliable data from buoys, among other revisions.
While the new CRUTEM5 land record nearly doubles the number of land stations used – from 4,842 to 7,983 – relative to CRUTEM4, global average land temperatures remain relatively unchanged. Unlike the NOAA, NASA, and Berkeley Earth global temperature datasets, CRUTEM does not do any of its own adjustments to land temperature records to correct for changes in measurement techniques over time. Instead, it relies on corrections made by national meteorological offices who provide the data.
The remaining additional warming in HadCRUT5 emerges as a result of infilling, and shows up in the difference between HadCRUT5 analysis and HadCRUT5 non-infilled. HadCRUT5 analysis is around 0.1C warmer than HadCRUT4 for much of the past 50 years, and up to 0.2C warmer in recent years due in part to exceptionally rapid Arctic warming.
While HadCRUT5 shows notably more warming than HadCRUT4, it ends up being quite similar to the other temperature records that provide full global coverage by filling in gaps – NASA, Berkeley Earth, and Cowtan and Way (which itself was largely an infilled version of HadCRUT4).
The figure below shows temperature records from six major groups, including both the old HadCRUT4 and new HadCRUT5 analysis.
![]()
Annual global mean surface temperatures from NASA GISTEMP (yellow line), NOAA GlobalTemp (light blue), Hadley/UEA HadCRUT4 (dotted line), HadCRUT5 analysis (red), Berkeley Earth (dark blue), Cowtan and Way (purple) and Copernicus/ECMWF (grey). Data plotted with respect to a 1981-2010 baseline. Chart by Carbon Brief using Highcharts.
The new HadCRUT5 dataset shows the most warming of any of the groups – both over the full record in which they overlap (1880-2018) and in more recent years (1979-2018). However, its long-term warming is quite similar to that in Berkeley Earth, while its rate of warming in recent years is quite similar to the NASA, Berkeley Earth, Copernicus, and Cowtan and Way datasets.
The figure below shows the rate of warming across all the different groups for both periods. Note that the Copernicus record currently begins in 1979, and thus cannot be compared to other groups prior to that point.
![]()
Annual global mean surface temperature trends from NASA GISTEMP, NOAA GlobalTemp, Hadley/UEA HadCRUT4, HadCRUT5 analysis, Berkeley Earth, Cowtan and Way and Copernicus/ECMWF ERA5 for both 1880-2018 and 1979-2018 periods. Trend periods end in 2018 as HadCRUT5 data was not available through present at time of publication. Chart by Carbon Brief using Highcharts.
Filling in the gaps
Surface temperature records are produced using a combination of weather station records over the land and SST measurements from ships and buoys over the ocean. However, each measurement reflects just a single point on the planet. As scientists do not have a weather stations or buoys covering every square metre of the Earth’s surface, producing a global temperature record necessarily requires some degree of interpolation – filling in the gaps between measurements.
Thankfully, global temperature changes over the course of decades are highly spatially correlated. That is to say, if a particular land location has warmed by 1C over the past 30 years, it is quite likely that other locations within a few hundred kilometres have also warmed by a similar amount.
This relationship was demonstrated back in 1987, and makes it possible to create a reasonably accurate reconstruction of global temperatures as far back as 1850 when scientists had many fewer measurements than they have today.
Many surface temperature records use an approach known as “gridding” to help convert measurements from individual locations into regional and global temperatures. Gridding divides the world into uniform latitude/longitude cells. The most common is the use of five-degree latitude by five-degree longitude. These grid cells are around 560km wide and 560km tall at the equator.
However, as the Earth is not flat, the size of these grid cells changes closer to the poles; near the north or south pole they become much narrower. At 80 degrees north a five-by-five grid cell is only one fifth the size of one at the equator.
This means that a single station near the equator can represent the temperatures of a region up to 314,000 square kilometres (km2), while the same station at 80 degrees north could only represent up to 63,000km2. Gridding approaches will necessarily exclude more areas of the Arctic and Antarctic even if those regions do not have fewer stations (although harsh conditions and few human settlements mean that scientists do tend to have fewer polar stations, particularly prior to the past few decades).
To get around these limitations, a number of groups have started doing more sophisticated interpolations of their temperature measurements. By using models that account for the spatial correlation of temperature anomalies – and how that correlation changes by latitude – researchers can create more accurate estimates of both regional and global temperatures.
HadCRUT5 employs a method known as a gaussian process regression, Berkeley and Cowtan and Way use kriging, while NASA uses a simpler distance-based weighting. With the release of HadCRUT5, only NOAA now uses a traditional non-interpolated gridding approach for polar regions.
The maps below show the effect of infilling between HadCRUT4 (top) and HadCRUT5 (bottom) for March 2016. The grey cells indicate those that have not been infilled.
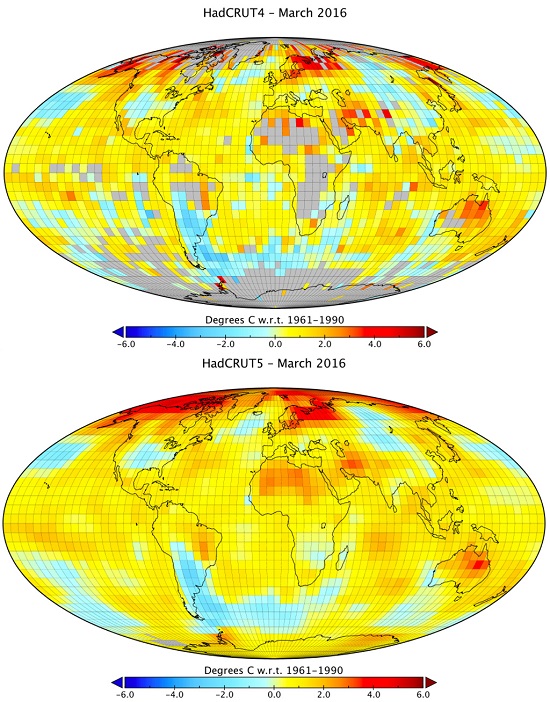
Gridded global surface temperatures in HadCRUT4 (top) and HadCRUT5 analysis (bottom) for March 2016, showing the impact of infilling on the resulting record. Chart by Carbon Brief.
Better agreement with models
During the 2000s and early 2010s there was a lot of focus in the scientific community on the apparent “hiatus” or “slowdown” in warming, with numerous studies pointing out differences between climate model projections and observed warming, particularly for the period between 2000 and 2014.
With the newly released HadCRUT5 correcting for biases in HadCRUT4, it is clear that at least some of the apparent disagreement with models during that period was due to problems in the observational temperature record rather than in the models. (Another major advance – using model SSTs over the ocean and surface air temperatures over the land – also accounts for a sizeable portion of the disagreement.)
The figure below provides a comparison of observations from both the old HadCRUT4 and the new HadCRUT5 analysis datasets to the CMIP5 climate models featured in the most recent assessment report from the Intergovernmental Panel on Climate Change (IPCC), published in 2013-14. While the HadCRUT4 record was notably at the lower end of the range of model projections between 2009 and 2015, the HadCRUT5 record is closer to the multimodal average.
![]()
Twelve-month average global average surface temperatures from CMIP5 models (black line) and HadCRUT4 (blue) and HadCRUT5 (red) observations between 1970 and 2020. Models use RCP4.5 forcings after 2005. They include SSTs over oceans and surface air temperatures over land to match what is measured by observations. Data plotted with respect to a 1981-2010 baseline. Chart by Carbon Brief using Highcharts.
The HadCRUT5 temperature record includes a number of important improvements, correcting for biases in ship-based measurements, filling in gaps over the polar regions, and incorporating a large amount of new land temperature measurements. It brings the Hadley record more in line with temperature records from other groups of researchers around the world.
Morice, C. P., et al. (2020) An updated assessment of near?surface temperature change from 1850: the HadCRUT5 dataset, Journal of Geophysical Research: Atmospheres, doi:10.1029/2019JD032361


Comments