



 Arguments







Six charts show how clean power was world’s largest source of new energy in 2025
Posted on 8 July 2026 by Guest Author
This is a re-post from Carbon Brief
Clean power added more to global energy supplies than any other source in 2025, according to the latest Energy Institute statistical review of world energy.
Outside the Covid pandemic, it was also the first year ever in which wind and solar, when combined, contributed more new energy than any of the individual fossil fuels.
The findings illustrate the “growing prominence” of electricity in the global energy system, according to the Energy Institute, a professional membership body that took over the production of the annual statistical review from oil firm BP in 2023.
It notes that electricity demand is rising much faster, at 3% in 2025, than energy use overall at 1.7% – and that all of the new power supply came from low-carbon sources.
While it includes data on data-centre demand for the first time, the review shows that these only make up 2% of all electricity use and 15% of the increase in 2025.
(The review does not explore other sources of demand, but separate data shows electrification of industry, heat and transport is a far larger driver of growth than data centres.)
At the same time, every source of energy – including coal, oil, gas, nuclear and hydro – also reached global all-time highs in 2025, the statistical review shows.
While the 86% of “primary energy” that came from fossil fuels is a record low, their real contribution to the economy is far lower, because roughly two-thirds of their energy is lost during combustion.
Below, Carbon Brief highlights the key findings of the review in six charts.
- Global energy supplies increase 1.7% in 2025
- Fossil fuels met a record-low 86.2% of global energy supply
- The ‘primary energy fallacy’ ‘inflates fossil fuels’
- Wind and solar were biggest source of new energy in 2025
- Clean energy met all of global electricity growth in 2025
- China generates more power than the US, EU and India combined
Global energy supplies increase 1.7% in 2025
The review shows that global energy supply reached a record high in 2025, climbing 10 exajoules (EJ, 1.7%) to more than 600EJ for the first time ever.
Within this total, there were new all-time highs for every energy source: oil; coal; gas; nuclear; wind and solar; as well as hydro and other renewables. This is shown in the figure below.
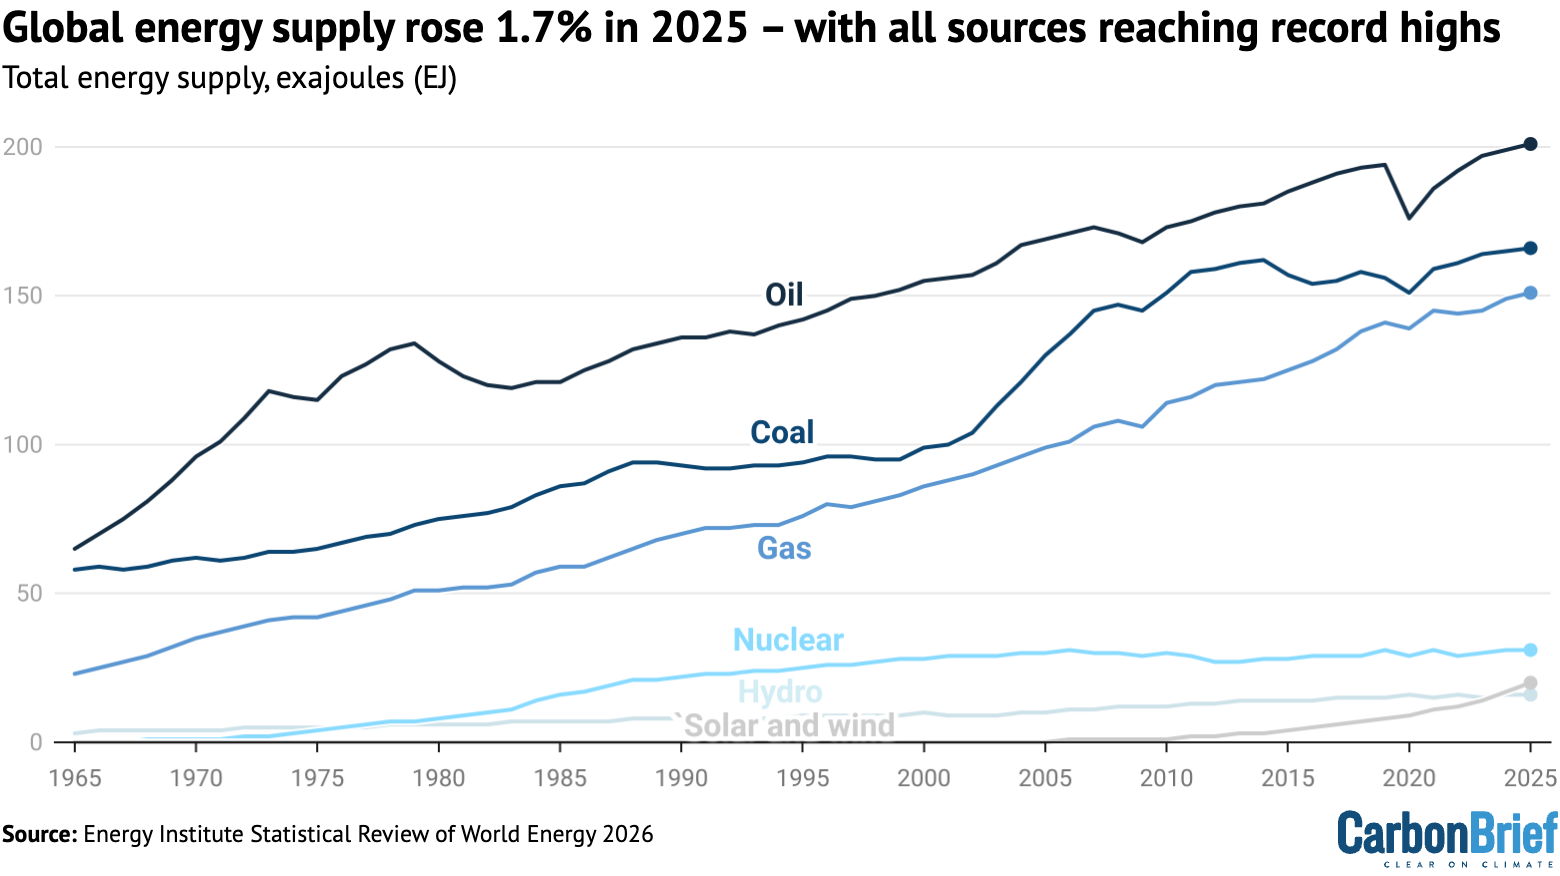 Total global energy supply by fuel, exajoules. Source: Energy Institute (2026).
Notably, coal hit a new record of 166EJ in 2025, up 0.7% from a year earlier and 2.8% above the level reached in 2014, which had been seen as a potential peak for the fuel.
Wind and solar saw the fastest growth, up by 18.3% year-on-year, as well as adding more to global supplies – in combination – than any single fuel source.
Fossil fuels met a record-low 86.2% of global energy supply
Nevertheless, on the basis of these primary energy figures, the contribution of low-carbon sources to the global energy system still looks relatively small.
The latest data shows that fossil fuels made up 86.2% of global primary energy supplies, as shown in the figure below.
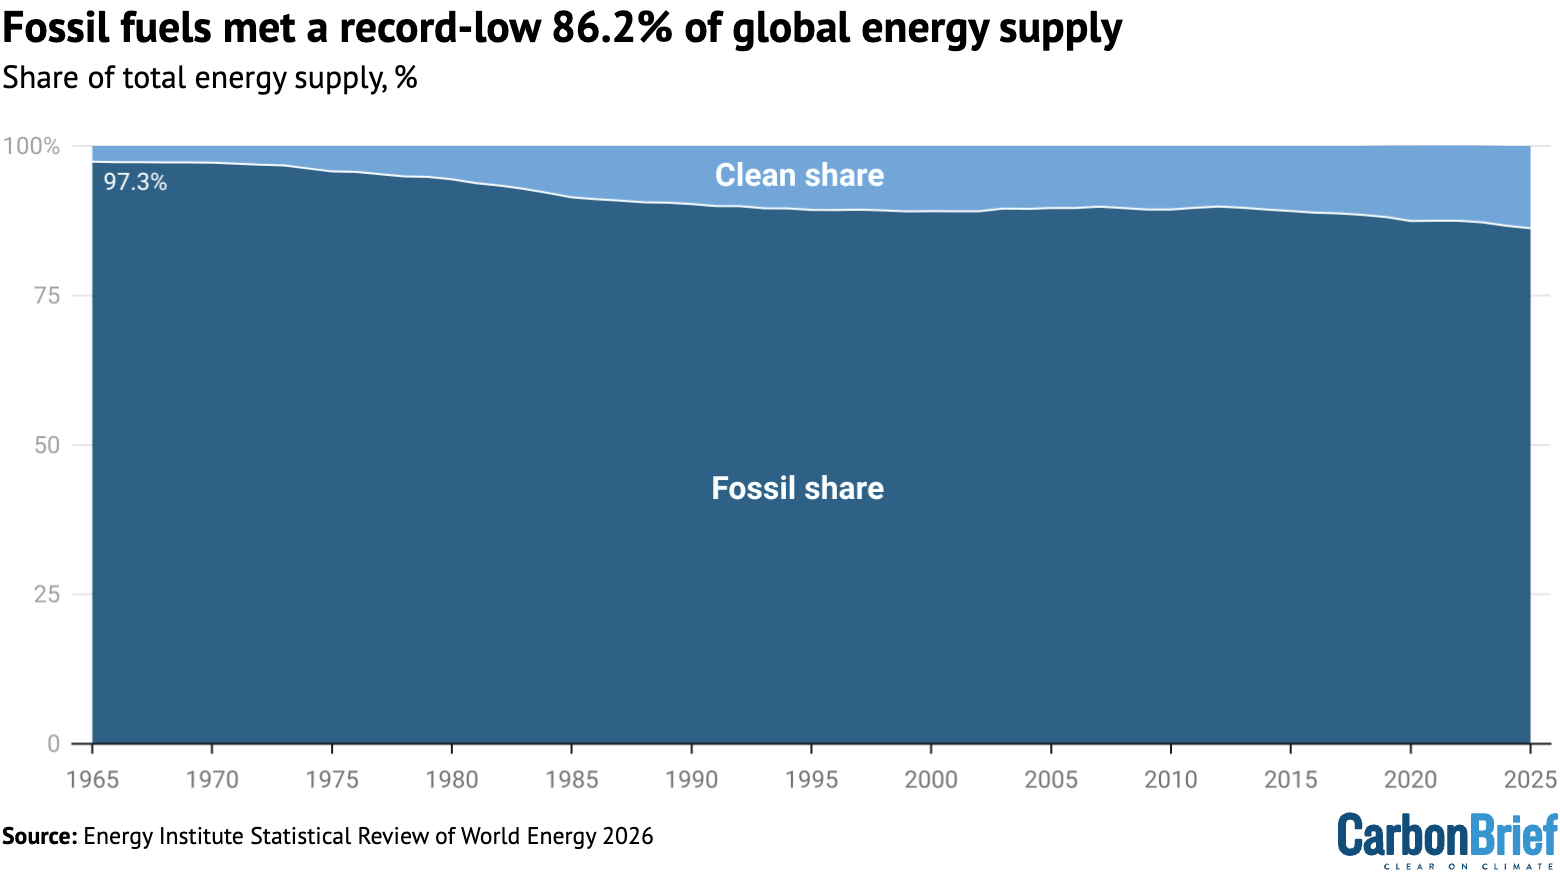 Share of total global energy supply from fossil fuels and clean-energy sources, including nuclear and renewables, %. Source: Energy Institute (2026).
The rise of nuclear power had pushed the fossil-fuel share of global energy down to 91% as long ago as 1986, before the Chernobyl disaster pulled the plug on further growth.
It is only in the past decade that clean-energy sources have started to gain more ground, as a result of the rapid expansion of wind and solar.
The ‘primary energy fallacy’ ‘inflates fossil fuels’
Crucially, however, the statistical review is based on “total energy supply” (TES), a measure of primary energy. This counts the energy stored in coal, oil, gas and nuclear fuel going into the energy system, whereas for renewables it measures the amount of electricity coming out.
Yet, most of the energy in fossil fuels is lost as waste heat during combustion.
In fact, some two-thirds of all primary energy is lost before it can be turned into useful energy that moves a car, warms a home or keeps the lights on.
This gives rise to the “primary energy fallacy”, which tends to “inflate…the perceived contribution of fossil fuels” and the difficulty of replacing them with low-carbon energy sources.
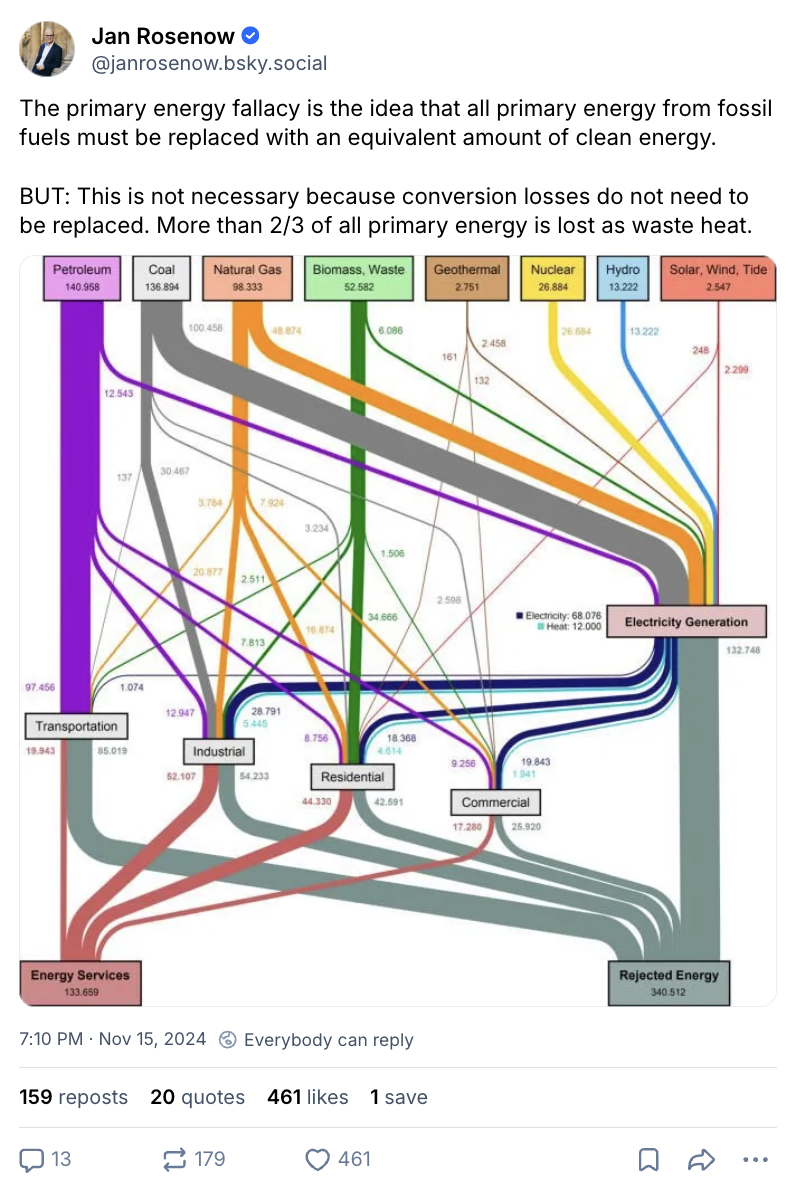
For example, the figure in the post shows that 105 units of energy went into the global transport sector – almost all of it oil – but this only generated 20 units of transport “energy services”.
In other words, less than 20% of the primary energy being used for transport actually ends up moving people or goods, while the remaining 80% was lost as waste heat.
Until 2024, the statistical review sought to address this issue by using the “substitution method” for clean-energy sources. This listed the primary energy supplied by wind and solar, for example, as the amount of fossil fuels that would have been needed to generate the same amount of electricity.
It stopped using this approach in 2025, explaining that this would reveal the higher efficiency of a clean-energy system that loses less energy during fossil-fuel combustion. It explained:
“Put simply, in future we will need to supply less energy in the form of clean electricity to undertake the same amount of work as the equivalent energy supplies from fossil fuels. Primary energy demand will decrease as the energy system increasingly electrifies and renewable electricity continues to increase its share of generation..”
Wind and solar were biggest source of new energy in 2025
With this in mind, it is all the more notable that wind and solar, in combination, were the world’s biggest source of new energy in 2025, as shown in the figure below.
Again, perhaps two-thirds of the new primary energy added by fossil fuels last year will never actually contribute useful work to the economy, because it will be lost as waste heat.
In contrast, the new energy added by wind and solar is in the form of electricity and almost all of it can be used directly to power factories, homes, appliances and electric vehicles.
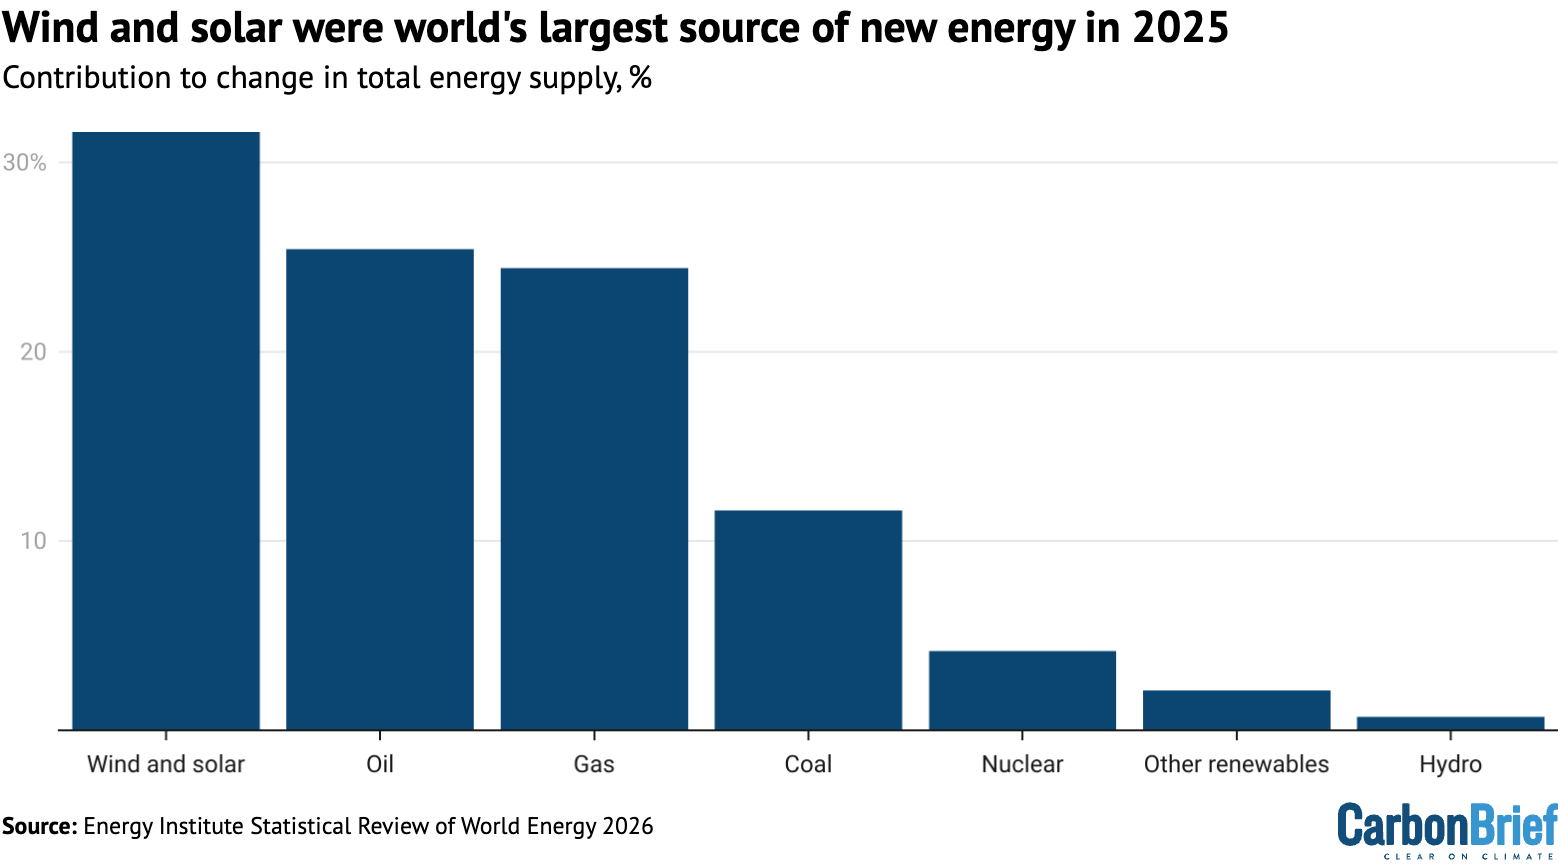 Contribution to the change in total global energy supply by fuel, %. Source: Energy Institute (2026).
Moreover, wind and solar saw the fastest growth by far, up 18% in 2025 alone. Over the past decade, they expanded fivefold, while coal, oil and gas grew by 6%, 9% and 21%, respectively.
Clean energy met all of global electricity growth in 2025
The impact of renewables is clearest in the power sector, where combined with a new record for nuclear power, they met all of the growth in global electricity demand in 2025.
This is shown in the figure below, which illustrates how fossil generation was flat last year and how wind and solar now generate more electricity than hydro or nuclear power.
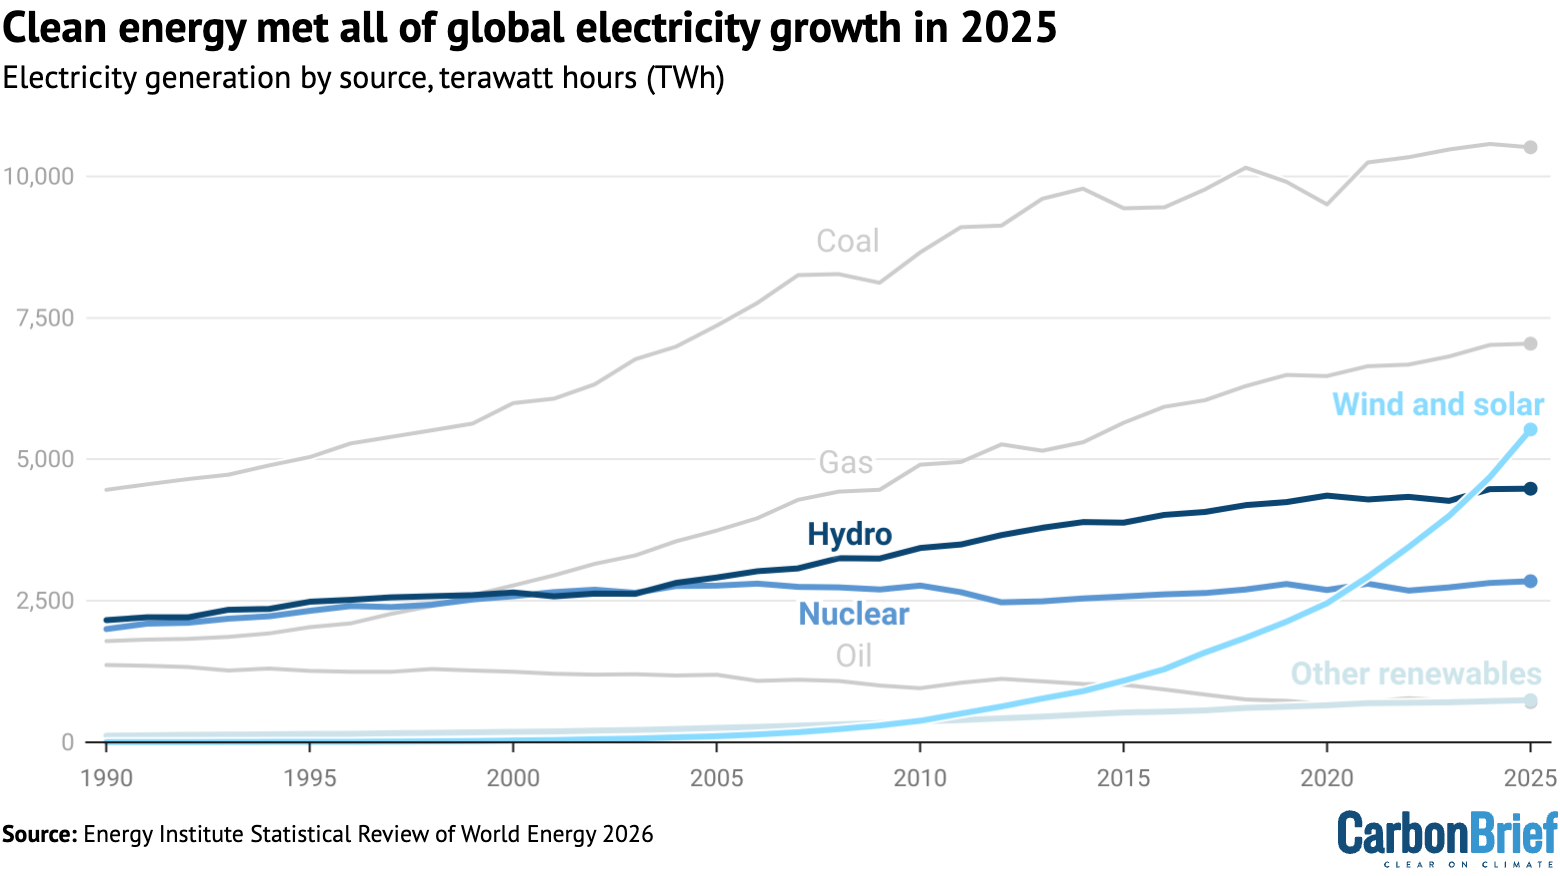 Global electricity generation by fuel, terawatt hours. Source: Energy Institute (2026).
The review says that wind and solar power, when combined, grew by 18% in 2025, whereas there was a small decline in coal generation balanced by a small rise for gas.
Overall, it says that global electricity generation increased by some 940 terawatt hours (TWh, 3%), roughly three times the annual demand of the UK.
Separate figures, included in the review for the first time, show that data centres used 788TWh of electricity in 2025, up 130TWh on a year earlier.
This means that data centres accounted for 2% of global electricity demand.
China generates more power than the US, EU and India combined
The Energy Institute report says that the power sector is set to play an increasingly important role, because it is growing more quickly than other parts of the global energy system.
There is also increasing political attention on the idea of using expanded clean-power supplies to rapidly electrify other parts of the economy, particularly heat and transport.
The COP31 presidency has called for countries to back a global goal for 35% of “final” energy to come from electricity by 2035, against a global average today of around 22%.
China is well ahead of the global average, with electricity making up 30% of its final energy supplies in 2025. It recently adopted a 35% by 2030 target for electrification.
One reason it has been able to do this is the huge scale of its electricity system. Indeed, China now generates more electricity than the US, EU and India combined, as shown in the figure below.
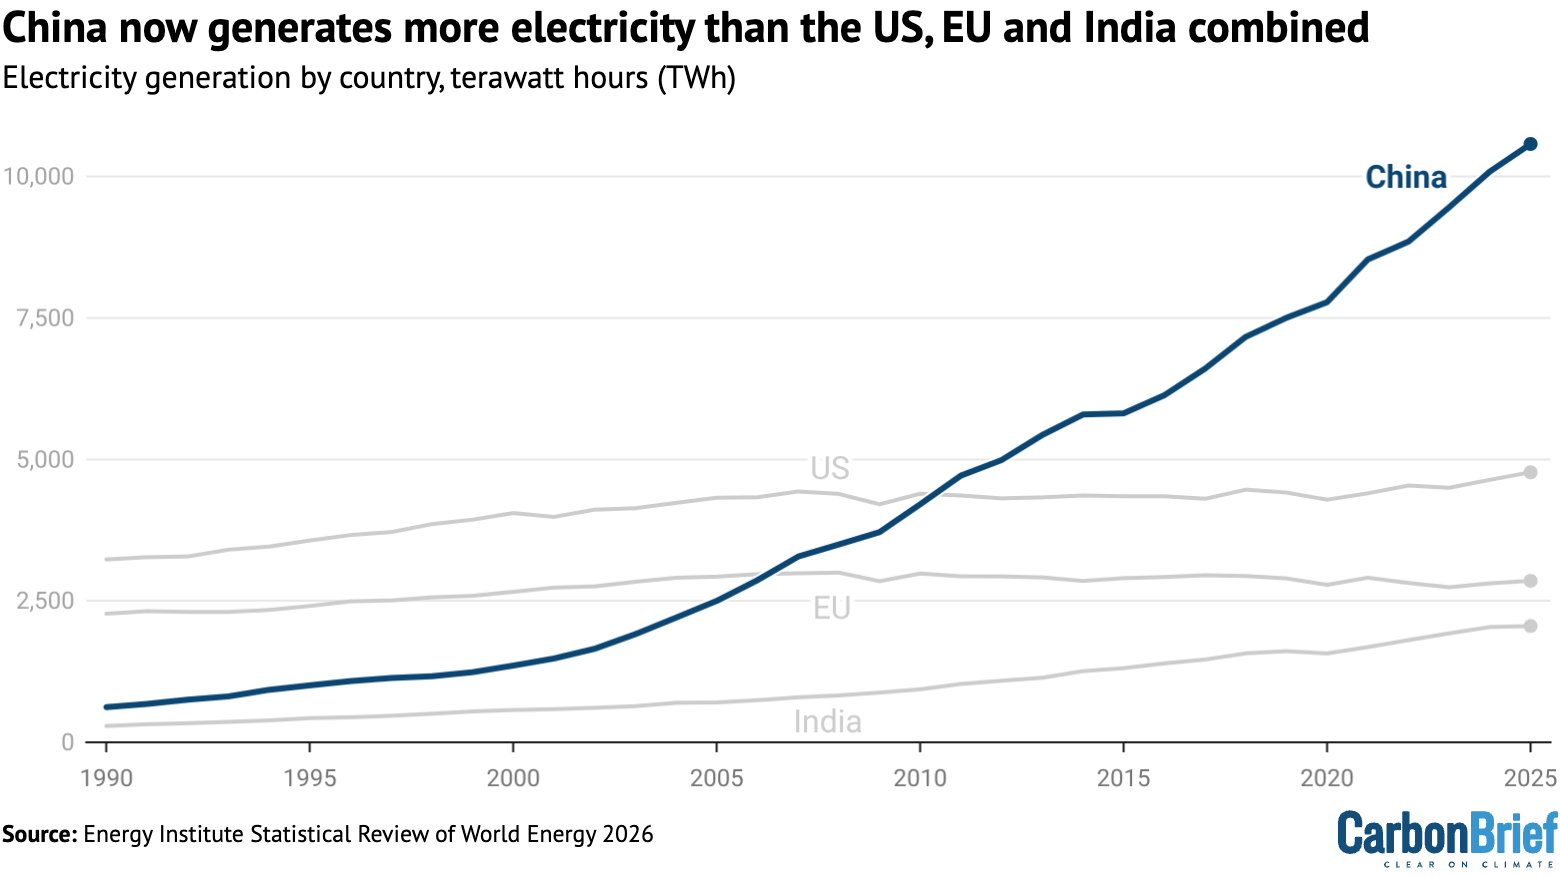 Electricity generation by country, terawatt hours. Source: Energy Institute (2026).
While much of the rise in China’s electricity has historically come from coal-fired generation, there was enough growth of clean-power sources to push coal down last year.








This is of course good new on wind and solar. To compare apples with apples, my question is whether the wind and solar energy contribution is "always on" contribution or whether the energy contribution needs to be discounted to account for variability of solar and wind over 24 hr periods or longer periods).
Frans,
No sources of energy are "always on". Currently five nuclear reactors in France have shut down due to high temperatures (when the electricity is needed most). Not to mention all the units out of service for maintenance. In 2021 the Texas debacle was caused by the failure of gas and nuclear units. The Spainish blackout was caused by the failure of thermal units, including nuclear plants, to provide grid stabilization they were paid to provide.
Batteries in combination with renewables can provide all power 24/7/365. It just takes time to build out a new system.
All generators need backup to provide all power. What do you think peaker plants are for? Baseload plants fail to provide all power every day. Did you account for the cost of peaker plants in your looking at thermal units? Really "apples to apples"??
The case for renewables was very strong 5 years ago. With the plummeting costs now even Trump cannot stop renewables replacing fossil fuels.
www.eia.gov/electricity/gridmonitor/expanded-view/electric_overview/US48/US48/GenerationByEnergySource-4/edit
Michael Sweet - " In 2021 the Texas debacle was caused by the failure of gas and nuclear units."
The loss of electric generation from Gas and Nuclear plants was about 40% loss starting on 2/15/2021 and lasting until early 2/19/2021 (approximately 80 hours) where as the loss of electric generation from wind, solar was approximately 75% starting on 2/9/2021 and lasting until mid to late 2/19/2021 ( approximately 10 days).
Percentage wise, the loss of electric generation from renewables was much greater than the loss from fossil fuels. Further the loss of electric generation from wind was across the north american continent for most of those 10 days. I have attached the link to the source data at EIA for your review
Thanks
[BL] As Michael Sweet points out (correctly), it is not up to others to follow your link, do analysis of the data found there, and hope to discover what it is you expect them to see.
As for your argument that "percentage wise..." (supposedly supported by data at the link you fail to provide any analysis for), you are employing a fallacious argument often used by by people trying to mislead readers on the science of climate change: ignoring the denominator. I suggest that you read this blog post:
With regard to posting link-only comments with no analysis, consider this your final warning. Before you post again, please read the recently-updated Comments Policy. The rational for the recent changes was explained in this blog post. In particular, you need to read, understand, and follow the part about backing up your argument.
Please note that posting comments here at SkS is a privilege, not a right. This privilege can and will be rescinded if the posting individual continues to treat adherence to the Comments Policy as optional, rather than the mandatory condition of participating in this online forum.
Michael Sweet: My point was not to dismiss wind and solar at all and discount issues that other nergy sources may have. My point was to account for capacity factors when energy source is displayed in graphs in TWh or other appropriate units. All energy sources have their particular challenges. Hence the need for complementary/back-up sources for sufficient expected durations and the need to acknowledge these challenges.
Yes, we have had nuclear plants shut-down in France during high temperatures. One may ask whether this was due to a particular set of regulations on water discharge temperature that a more flexible system management may temporarily overrule.
Everyone is familiar with the German term Dunkelflaute, so multiple days of back-up are required for wind plus solar to avoid the repercussions. Spain was lucky that the blackout did not last longer than it did because Spain got help from the Nuclear plants in France and European integration of electricity transmission (and Spain may wish to reconsider whether they really wish to shutdown their very reliable Almaraz nuclear plant).
The whole point is that during the transition to clean energy sources (I prefer "clean" over "renewable" to avoid arguments about what is included in renewable) an "all of the above" approach is needed, including not just sources of energy but also improved grid management.
Fran you make a good point on the German term Dunkelflaute. I happen to be big on a full and comprehensive understanding of the topic, due diligence and use of source data as much as possible. The EIA gov website provides considerable data, especially the real time grid monitor. Using Jacobsen's supplement tables (S7 through S14) , including installed capacity, then using actual demand and actual capacity factors obtained the EIA grid monitor, along with the backup battery power, it evident that the success of the "every 30 second " stress test for the 7/24/365 renewables may not be nearly as robust as advertised. It remains a legitimate concern.
I'm not one to condemn nuclear systematically, but also not one to give a pass to ERCOT. In the Texas outage of 2021, one could legitimately make the argument that the (much) larger share of gas/combined-cycle suddenly reduced, and the expectation that it is supposed to be baseload, i.e. not subject to weather, were factors.
Taking a swipe at wind power like their politicians did was grandstanding nonsense. However, I noticed from the link provided by David acct that even coal dipped when the thing went down, so there is certainly an issue with the larger picture, including grid and exchanges with neighboring states. The integration of the European grid is a strength and France still has one of the lowest CO2/kw of electricity in Europe. However, they are facing problems, as the current very longand intense heat wave shows.
David-acct,
We have previously discussed your citing raw data that doesn't support your claims instead of actual analysis of that data. You have refused to answer my questions about how the raw data from France proved that nuclear reactors were shut down on weekends when you falsely claimed reactors were not shut down.
It is not my job to analyse your data. You must provide the analysis.
Over 90% of the power lost in Texas was from thermal resources. You are simply parroting the fossil fuel industry's lies. If the Texas grid was linked to the rest of the country it would not have failed.
Anecdotes about periods of low wind do not show that peer reviewed papers (cited hundreds of times) are incorrect. If you want to claim Jacobson's paper was incorrect you must cite analysis of data. Since all his code was published it would be easy for fossil companies to replicate his work using the conditions you refer to. Since they have not shown Jacobson was incorrect it is most likely that they tried and found his system worked during the time periods you mention. I note hundreds of other papers, using different models, show a completely renewable system can supply All Energy to the world.
Find some analysis that supports your wild claims. Links to raw data with unsupported claims the data shows something is simply promoting lies.
Moderator: David-acct has previously linked raw data claiming it supports his claims when I have proven the data contradicts his claims. He refuses to answer my questions about his false claims. He should answer my questions or withdraw his false claims before he starts the same BS on another topic. He needs to cite analysis instead of making false claims about huge data sets. He is wasting our time.
I am sorry I didn't link our previous discussion on the nuclear thread, my computer is down.
[BL] Indeed. David-acct has been warned before about providing links without giving much (or any) context or analysis.
Most recently, he was warned about this on this comment and this comment. Just because this was over a year ago does not mean he gets to start his bad habit all over again.
Frans,
Hundreds of papers like Jacobson et al 2022 (sorry no link, my computer is down) show that all Europe, and the entire World, can produce All Energy using renewable sources. Low wind periods can be accommodated with a combination of solar, hydro, storage and other technologies linked with a large grid. The amount of storage needed is measured in hours, not days. You have been misled by fossil fuel supporters.
In several of the graphs in the OP they show total energy, not capacity. As discussed in the OP, showing total energy severely handicaps renewables since thermal resources waste two thirds of their energy as waste heat while renewable electricity is much more efficient. None of the graphs show capacity, only generated energy is graphed.
Comparing the first graph of total energy supply it appears that nuclear supplies more energy than renewables. The next to last graph of electricity (graphing terrawatt hours) shows renewables produce much more usable electricity than nuclear. The additional energy in the first graph is released into the environment as waste heat.
Many people, including me, think it important to prevent killing a river by raising it's temperature. This is a serious concern. Thermal pollution kills environments.
David-acct @3
Michael Sweet: In 2021 the Texas debacle was caused by the failure of gas and nuclear units.
David acct: The loss of electric generation from Gas and Nuclear plants was about 40% loss starting on 2/15/2021 and lasting until early 2/19/2021 (approximately 80 hours) where as the loss of electric generation from wind, solar was approximately 75% starting on 2/9/2021 and lasting until mid to late 2/19/2021 ( approximately 10 days).
Nigel: Davids reply implies the main cause of the power failure was renewables. But this is incorrect. According to official investigative reports the main cause was failure of the gas supply system due to freezing up of supply lines and equipment due in turn to bad design by the grid authority. This took a lot of generation off line just when it was needed.
https://www.ferc.gov/news-events/news/final-report-february-2021-freeze-underscores-winterization-recommendations
The numbers David quotes for wind power output losses exceeding thermal and nuclear output is partly due to wind turbine equipment freezing up like with the gas system. But it also appears to include planned reductions in wind power due to the lack of wind. The system as a whole is designed to cope with this - provided the gas backup is working. So the real culprit was the failure with the gas supply. Nuclear power also had failures due to the freezing conditions.
[BL] Link activated