


 Arguments


Recent Comments
Prev 1389 1390 1391 1392 1393 1394 1395 1396 1397 1398 1399 1400 1401 1402 1403 1404 Next
Comments 69801 to 69850:
-
Bob Lacatena at 15:28 PM on 14 December 2011(Fahrenheit) 451 ppm
71, skept.fr, Apologies. I read "and before all to price carbon externalities" as meaning do R&D before any carbon pricing schemes, when I think you are saying you meant to do the carbon pricing first. It would have been more clear (more common phrasing) if you had said "but before that to price carbon externalities." Still, my apologies for misunderstanding. On everything else... this is really all OT concerning the original post, but you are painting two extremes as the only options, either get off fossil fuels instantly, or stay addicted in an effort to turn the second and third worlds into carbon copies of the first. Both paths are paths to ruin. My position is that 451 ppm is far more dangerous than people admit. We cannot go cold turkey off of fossil fuels, but we don't have to, and we're currently not trying in the slightest to do anything at all. We will never live in a world where 7 billion people live like American citizens do today, and any attempt to do so guarantees that we will massively exceed 451 ppm, with an end result that is to horrible to contemplate. Fast, immediate but moderate and considered action is the only viable course, with the necessary goal being sustainable economies and cultures globally, whatever sacrifices that may ultimately entail. Our current track — ignoring the problem — is destined to end badly. -
TOP at 14:52 PM on 14 December 20112nd law of thermodynamics contradicts greenhouse theory
@1165 Scandenp From Table 8 on page 22.Band Range Portion [nm] [%] ultraviolet 0 − 380 10.0 visible 380 − 760 44,8 infrared 760 − ∞ 45,2 -
TOP at 14:42 PM on 14 December 20112nd law of thermodynamics contradicts greenhouse theory
@DrTsk I didn't say the atmosphere was opaque, Connelly did in a reference pointed to by muoncounter. (-snip-)...the troposphere is largely opaque to infra-red radiation...[http://www.wmconnolley.org.uk/sci/wood_rw.1909.html]
You can argue whether it is opaque or just largely opaque. But the Box experiment proves it is not totally opaque to IR. And G&T went into a lengthy discussion of the various (-snip-). Did you miss the question mark in my sentence? The correct answer was (d). It would certainly make sense that at some altitude H2O doesn't show up. I didn't do any experiments that invalidated anything. I'll leave that to G&T. @1167 Tom Curtis Tom, I have to deal with #4 first. If the term "green house effect" doesn't refer to the process by which green houses, cars and atrium skylights heat their interiors when the sun is shining, but instead refers to the supposed means by which the atmosphere keeps the planet warm, what name do you propose for the means by which green houses are kept warm in sunlight? T&G and the others they quote are absolutely right that this term has no business being used to describe what is going on in the atmosphere. (-snip-) I have seen all those curves before and that discussion on heat seeking missiles. The curves certainly don't support Connelly's largely adjective either. While I didn't include the adjective at some point, I did reference the source so it should have been clear what was being discussed. I'll have to apologize for that. I didn't see a curve for the incoming radiation from the sun or a computed specific intensity over the UV, visible and IR spectra at the ground. You would need to show that to make some headway with G&T. @1166 Chantreau A small point, but in a previous post I had stepped out and pointed my IR thermometer at the bottom of rain clouds which I think I mentioned then. I am aware that certain types of clouds like cirrus are comprised of ice crystals, but I was really referring to the clouds that usually pass over my location in which, yes, the temperature is below the dew point, but no, the temperature is not below the freezing point at whatever altitude they are at. Generally that only happens in summer and spring when hail forms. Clouds form when convection lifts warm air from the surface and the lapse rate then lowers the temperature of the moisture in the air to below the dew point.Response:[DB] Specious, argumentative statements detracting from the dialogue snipped.
-
newairly at 14:38 PM on 14 December 2011Debunking Climate Myths from Politicians
I nominate John Howard for saying during his launch of Ian Plimer's latest book that teachers should offer the view in schools that climate change is not man-made. Also the Archbishop of Sydney, George Pell, who says that climate change “extremism” is the work of “pagans" -
muoncounter at 14:29 PM on 14 December 20112nd law of thermodynamics contradicts greenhouse theory
TOP#1168: Thanks for tech summary on IR thermometry. I refer you to the specs for the Fluke 62, a top-of-the-line handheld: It reads as low as -30 C, a tad above the -48 C (225K) that you report for the temperature of the stratosphere. Also note "this rugged, compact thermometer takes accurate readings from up to six feet away." The D to S ratio is given as 10:1, so at 72 inches, you're reading a circular area 7.2 inches across. Beyond that, who knows what you're seeing? As for frost forming on the ground, surface air temps are standardized about 1.5 m above ground in screened enclosures - so that surface stations aren't contaminated by false readings. Cold air sinks. But you knew that already. You might read the text below the words 'Good Response by John Farley' in the Notes below, which gives specific examples of GT errors.Response:[DB] Please note that the NOTES section described by muoncounter is not viewable to the lay reader, so the relevant section is reproduced below:
Good response by John Farley: Cockburn is impressed by a scientific argument, claiming that the greenhouse effect violates the Second Law of Thermodynamics. He relies on a publication by Gerlich and Tscheuschner (GT), "Falsification of the Atmospheric CO2 Greenhouse Effects within the Frame of Physics."5 However, the greenhouse effect can be easily demonstrated in the laboratory. The BBC broadcast a tabletop demonstration of the greenhouse effect, which can be found at the BBC website (at <news.bbc.co.uk/2/hi/science/nature/8394168.stm>). The video, a little over 2 minutes long, is well worth watching. Physics is an experimental science, and if theory disagrees with experiment, the theory must be flawed.
But beyond noting that the GT theory is refuted by experiment, it is worthwhile examining where GT went wrong. They claim that greenhouse gases in cold upper atmosphere cannot possibly transfer heat to the warmer earth, without violating the Second Law of Thermodynamics.
Let's be clear about what Second Law of Thermodynamics does and does not say. Suppose that you have two objects at two different temperatures, and suppose that light (visible or infrared) from either object can reach the other object. There will be a flow of heat from the hot object to the cold object and a smaller flow of heat from the cold object to the hot object. There are thus heat flows in both directions: from hot to cold and from cold to hot.
The Second Law says that the flow of heat from hot to cold is greater than the flow of heat from cold to hot. Hence the net flow of heat is from the hot object to the cold object. Note that the existence of a smaller flow of heat from the cold object to the hot object does not refute the Second Law.
At this point, we return to Cockburn's argument (from GT). Heat flows from the warm earth to the cold atmosphere and also from the cold atmosphere to the warm earth. (Heat also flows from the cold atmosphere to outer space, which is even colder.) The flow of heat from the earth to the atmosphere is greater than the flow of heat from the atmosphere to the earth, so the net flow of heat is from the earth to the atmosphere.
But there is also a (smaller) flow from the atmosphere to the earth. This smaller flow keeps the earth warmer than it would be if there were no greenhouse gases in the atmosphere. This is what the greenhouse effect is all about. On this point, Cockburn has been misled by GT, who have advanced degrees in physics but have made a serious mistake in thermodynamics.
Readers with a background in physics and calculus can read a comprehensive refutation of the GT paper by Arthur P. Smith, "Proof of the Atmospheric Greenhouse Effect." Smith's article begins: "The results presented here are not new." Indeed, they are over a century old and found in standard textbooks. Smith has presented the subject in great detail in order to answer objections raised by GT to the treatment found in standard textbooks.
The greenhouse effect has been known for over a century. The greenhouse effect is quite a big effect: the Earth's surface is about 59 F warmer than it would be in the absence of greenhouse gases in the atmosphere. The greenhouse effect was entirely natural until the industrial revolution. In the last two centuries, the burning of fossil fuels has added a manmade contribution to the greenhouse effect. It is surprising that the GT paper survived peer review, which is a quality-control policy that makes it harder to publish erroneous papers. Harder, but evidently not impossible.
-
skywatcher at 14:12 PM on 14 December 2011Galactic cosmic rays: Backing the wrong horse
Eric, Mercurio's discussion of cosmic rays and the glacial-interglacial cycle is unsupported speculation on his part. That is is un-peer reviewed, and ignored speaks to the wildly speculative nature of the content. Muoncounter at #41 has other valid criticisms. On your conjecture - you appear to be using a high;y-criticised graph from #38 which has lags/errors of tens of millions of years in order to support a conjecture about oceanic circulation and glacial cycles. Do you think it's plausible for the oceans to work on a timescale as slow as millions of years? Even a few tens of thousands of years is stretching credulity a bit. Nonetheless, a graph covering 500 million years can't hope to support your argument for the glacial-interglacial cycle. So again, what's the mechanism? -
Eric (skeptic) at 14:04 PM on 14 December 2011Galactic cosmic rays: Backing the wrong horse
Muoncounter, yes the two effects are parsimonious and TSI is a clear cut forcing while GCR was not a detectable forcing in the historic and paleo events where it can be singled out. My personal theory of climate is that equilibrium is impossible due to factors like the rotation of the earth. Therefore climate is determined mostly by the balance of forcing and energy flows but partly by the feedbacks. GCR is a potential modulator of the fast feedback. Scaddenp, There is evidence for the weather link (in 35 cases in 41 years as muoncounter pointed out), but not evidence for a climate link other than the top graph in #39 and similar which all coincide with and can be explained by TSI. -
adelady at 13:53 PM on 14 December 20112nd law of thermodynamics contradicts greenhouse theory
TOP. Have you read the notes at the bottom of this page - and followed the links? Could save you a bit of grief.Response:[DB] The NOTES sections are not accessible to the lay reader.
-
scaddenp at 13:51 PM on 14 December 2011Galactic cosmic rays: Backing the wrong horse
Not to mention the unproven link between clouds/weather and GCR... I notice mercurio 2002 has single cite and no followup by mercurio either. Guess we are not the only ones unconvinced. -
muoncounter at 13:42 PM on 14 December 2011Galactic cosmic rays: Backing the wrong horse
Eric, You've given yourself a difficult task. If 'the lack of events causes warming,' you'll need a signal to trace. Unfortunately for that, low GCR flux rates correspond to the highs of the solar cycle (see the graphs here, specifically figs 1 and 4 for the years 2000-2004 - peak of cycle 23). So if solar activity peaks -> TSI in any way, wouldn't any GCR-induced warming be swamped by the coincident uptick in solar forcing? If so, you'll have a hard time pinning any warming directly to the lack of GCRs. I always find it difficult to prove anything by demonstrating a lack of evidence, but I know others in the community who don't hesitate to do so. There certainly isn't any basis for saying that you shouldn't give it a try. -
scaddenp at 12:29 PM on 14 December 2011Galactic cosmic rays: Backing the wrong horse
Be10 is complicated because climate affects deposition rates. With C14, you have a calibrated production curve going back 4000+ years thanks to tree ring data but then issues after that. Be10 is also used to date how long rock exposed (Be10 production from cosmic ray hitting O2 in SiO2). As I understand, you are nowhere near being able to infer flux from this because of timescale issues but this doesnt have deposition rate issue so could be used to supplement ice core data in future. -
Eric (skeptic) at 12:26 PM on 14 December 2011Galactic cosmic rays: Backing the wrong horse
muoncounter, I agree, 35 events is meaningless for modern climate analysis. The other problem is that they are going in the other direction from what I am, they are showing events to cooling. I am postulating that the lack of events causes warming over the very long run (100 to 1000 years or more as shown in the top graphic in #39). -
skept.fr at 12:23 PM on 14 December 2011(Fahrenheit) 451 ppm
#70 Sphaerica : one step back ! Clearly, we disagree. Forgive me if I am misinterpreting your attitude, but "the very first priority is ... to reinforce the R&D..." is exactly my problem. I also write just after : and before all to price carbon externalities so as to give the good signal and improve RE competitiveness. So, unless my English is still more incorrect than I imagine, you retain what you mostly disagree with, but you do not correctly represent what I wrote. (As a citizen of UE, I’ve no problem with high tax on gasoline, Kyoto, etc. we have an energy-climate plan for 2050 with a first step in 2020 and the ultimate target of 1 tCO2/c/y. Your concerns for inaction in my case are strawman, and I would add that I personally and already produce less than 1tCO2 each year). For R&D, it is a urgent necessity because RE have quite poor energy and power densities, storage, etc. They are not sufficient in their current technologies for providing enough energy to the world in 2050 (best estimate of RE in the mix in 2050 : 250 EJ/y according to median value of IPCC SRREX 2011 scenarios, current production approx. 500 EJ/y). Facts are stubborn things, that’s true for climate, that’s true for energy too. Specifically, I do not "accept the fact that a part of the climate change is tolerable". De facto, you accept this situation if not you would simply require the global prohibition of fossil extraction. It is by far the simplest solution of you want to stop carbon emissions and climate change induced by the emissions. If you tell me that fossil prohibition would have too many adverse effects, it means that you implicitly prefer a fossil-fuelled world with a changing climate than a non fossil-fuelled world with a stabilizing climate. So do I, but I’m coherent and I explain my position, or at least I try. For the rest, I’m all but at ease with your discourse. Peters et al 2011 graph is crystal clear : 7 billion people need fossil energy, and mainly the poorest 5 billion that engaged recently in development and that are responsible of nearly all the 49% increase of emissions from 1990 to 2010 (the poorest among the poorest haven’t been involved in these emissions, and for this reason among others, their quality of life is generally tragic). A discourse that doesn’t address precisely this reality and doesn’t explain how to deal with these energy needs is a dangerous discourse, the fact that it pretends to avoid another danger doesn’t make it less dangerous. Indian citizens are basically unconcerned by US wastes, they have a mean 25 GJ per capita per year and a decent quality of life would imply rather 75 GJ (US citizens have 330 GJ, you observe that my target is far from imitating Western wasteful way of life). So, unless you explain precisely (not with effortless rhetoric on ‘magnats’) how to produce this energy without the abundant coal in India ground, you cannot have the lesser hope for a drastic change in carbon emissions. And secondarily (forgive me if I misinterpret you attitude), you cannot convince me that you’re really interested in the development of the second and the third world. -
Eric (skeptic) at 12:22 PM on 14 December 2011Galactic cosmic rays: Backing the wrong horse
skywatcher (#78), I agree with your assessment of the Shaviv graphic (lower graphic in #38) and I answered in #40. The pacemaker question is important and GCR coincides somewhat with Milankovitch as explained by Mercurio. CO2's control knob works best in cold conditions like the present or colder. My source is simply the logarithmic curve that we all have seen. There is no ceiling like you say but a gradual switch from CO2 causation to temperature causation in the amplification effect. I will elaborate more on a CO2 control knob thread if you want me to. Back on topic, my conjecture about the cosmic ray mechanism is that it shows up in the long term (e.g. upper graphic in #38) so therefore must act through the oceans which are really the only plausible long term actor. I would expect that given a particular rate of overturning, a very subtle warming of SST's would be possible (on average) in a low GCR (lowered cloudiness) regime which over time would warm all ocean layers and aid a flip out of glacial into interglacial. Of course the coincidental increase in TSI is important and may well be the only necessary factor or the main factor. It's not easy to determine. -
DrTsk at 12:21 PM on 14 December 20112nd law of thermodynamics contradicts greenhouse theory
My hat off to you Sphaerica for your patience!!! TOP, if your experiments are so great that invalidates more than a hundred years of knowledge go ahead publish and become famous. Atmosphere is NOT opaque no matter how you look at it. The spectrum emission might look continuous but it is not. Atmosphere is NOT densely packed with water vapor. It is densely packed with N2 and O2. At 20oC the saturation at sea level is around 20,000 ppm of water, and we are now around ~400 ppm of CO2. I would say HARDLY densely packed. Actually above a certain height there is ONLY CO2 in the atmosphere (from the GHG ensemble). CO2 is much better well distributed compared to H2O. -
skywatcher at 12:12 PM on 14 December 2011Galactic cosmic rays: Backing the wrong horse
#80, I agree that other aspects of the carbon cycle would change too. I'd hang my hat on the primary trigger being a disruption of circulation in the Atlantic, but this would surely then drive changes in other parts of the carbon cycle as unglaciated parts of Europe and America cooled. Presumably Be10 is a better indicator as there is less exchange between ocean and atmosphere? Not sure on chemistry for Be, but clearly C14 record is complicated by the 2-way exchange of CO2 between ocean and atmosphere, hence its use in seeing ocean circulation change. -
muoncounter at 12:02 PM on 14 December 2011Galactic cosmic rays: Backing the wrong horse
Eric: My main criticism of Dragic's result was the fact that in a 41 year database, they can show only 35 events producing an identifiable change in temperatures. At less than 1 per year, that's not much to hang a hat, let alone a theory, on. -
scaddenp at 11:58 AM on 14 December 2011Galactic cosmic rays: Backing the wrong horse
Thanks skywatcher. I guess I am in the mixed camp. When temp goes down it seem to me that many other aspects of carbon cycle are also changed (eg vegetation uptake, swamp venting). Be10 looks to be a better indicator of GCR in the long run. -
skywatcher at 11:55 AM on 14 December 2011Galactic cosmic rays: Backing the wrong horse
{#78 is in response to #71 BTW} -
skywatcher at 11:55 AM on 14 December 2011Galactic cosmic rays: Backing the wrong horse
Eric, did you read sphaerica's response to your #38 in #39? I'm not going to be in a hurry to trust that graph in #38 at all. The necessary conditions for an interglacial are suitable orbital forcing - or do you think Milankovitch was wrong and the pacemaker pattern of 100k, 41k and 26kyr cycles is entirely coincidental? CO2 only a 'control knob in cold conditions'? That's a new one - source please. The saturation effect only means that there is a reduction in forcing per tonne of atmospheric CO2 as you increase, not that there is a ceiling above which there is no forcing. For the same reason, methane is much more powerful a GHG - the spectral line is less saturated. The rest of your post is conjecture - can you provide sources (e.g. Lockwood and demonstrated effects). The biggest unresolved question is what is the mechanism by which GCRs can affect climate, don't you think? -
TOP at 11:51 AM on 14 December 20112nd law of thermodynamics contradicts greenhouse theory
@1160 Sphaerica The atmosphere is densely packed with water vapor and CO2? Just what is the volume percentage of CO2 in the atmosphere? a) 40% b) 4% c) .4% d) .04% e) None of the above Hint: You will find the answer in G&T, Table 4, p.8. And I am glad you agree with G&T that the box experiment is not a good representation of the atmosphere. It is good to know G&T got something right. Now if you had said the box experiment did not agree with how greenhouses operate that would be a great flaw in G&T.2.6 Glass house summary
The purpose of the Wood experiment is singular, to determine whether radiation or convection controls the temperature of the air inside the box. The simple conclusion is that radiation has nothing to do with it. Glass completely blocks the escape of radiation. Rock salt allows all radiation to pass freely. With rock salt the box actually heats faster because the IR from the sun is allowed in as another forcing. @1157 muoncounter Sure I know how IR thermometers work. Can you explain to me how not to point an IR thermometer at something? Is the stratosphere a vacuum? Can you explain why pointing the IR thermometer at the sun does not register 5,800K? The IR thermometer integrates thermal energy within it's view cone by focusing it onto an IR sensitive transistor after filtering visible light. It uses the Stefan-Boltzmann law to back out the temperature (T&G eq.28, p.20). It doesn't care where the thermal energy comes from. Thermal energy doesn't carry little tags on it with it's origin stamped on it. Since pointing it at zenith allows it's view cone to take in the whole sky the area/radiant energy being integrated compensates for the low emissivity of the gases in the atmosphere above it. After all the reciprocal of the area of a 15deg included angle cone 29,000 ft away is about 2.2E-8 which is on the order of magnitude or smaller than the emissivity of the stratosphere. The farther away, the greater the area seen, and the more the low emissivity is compensated. The sun's emissivity is extremely low and it's apparent area is extremely small so it just doesn't register. So it is no coincidence that taking a reading of clear sky registers -55F or so on the IR thermometer which is experimental evidence that my hypothesis is right. Similarly when cloud if fully covering the view cone the thermometer measures something around freezing which is what I would expect cloud temperature to be (rain clouds anyway). And this line of reasoning is further backed up by the frequent formation of frost on my cars even when the air temperature is above freezing. The surface of the car and windshield radiates heat to a colder object, that being the stratosphere and space. If the car is under a tree, the frost won't form. In fact wikipedia mentions that IR thermometry is used to detect the presence of clouds. Same thing that I am doing.
It is not the “trapped” infrared radiation, which explains the warming phenomenon in a real greenhouse, but it is the suppression of air cooling."Falsification Of The Atmospheric CO2 Greenhouse Effects Within The Frame Of Physics", Gerlich and Tscheuschner, 2009, p34 -
Tom Curtis at 11:43 AM on 14 December 20112nd law of thermodynamics contradicts greenhouse theory
TOP @1152: 1) You misquote Connolly as saying the troposphere is opaque to IR radiation. What he actually said is that it is "largely opaque to IR radiation". (My emphasis). That is easily verified by examining the downward IR radiation at the surface, as for example in these two spectra: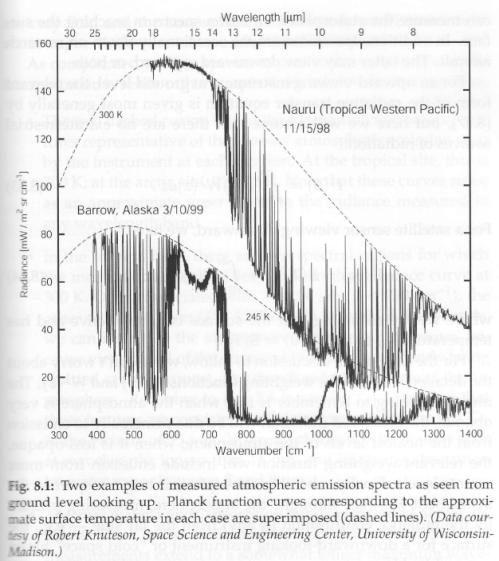 You will notice that even with low humidity (Barrow Island), the atmosphere is essentially opaque to IR radiation outside the bands between wavenumber 800 and 1000, and between 1100 and 1200. With high humidity (Nauru) there are significant local emissions even in those bands.
These facts were first discovered by the US Air Force, which conducted experiments in the IR transmission properties of the atmosphere so that they could effectively deploy heat seeking missiles. Consequently heat seeking missiles, and IR cameras, and IR thermometers are all tuned to the bands of low IR emission by the lower atmosphere. This model, for example, is tuned to the entire band of low atmospheric emissions, 8 µm to 14 µm (see spectral response under specifications).
Arguing the atmosphere is not largely opaque to IR radiation because you can use an instrument tuned to the wavelengths in which the atmosphere least opaque is bizarre, although certainly not unique to you among fake skeptics. Neither is misquoting a source to strengthen your case. I hope both were accidental, and that you will now recognize that Connolly's claim was correct.
2) If known temperatures and humidities (from observations are fed into a Line By Line (LBL) radiation model, the result looks something like this:
You will notice that even with low humidity (Barrow Island), the atmosphere is essentially opaque to IR radiation outside the bands between wavenumber 800 and 1000, and between 1100 and 1200. With high humidity (Nauru) there are significant local emissions even in those bands.
These facts were first discovered by the US Air Force, which conducted experiments in the IR transmission properties of the atmosphere so that they could effectively deploy heat seeking missiles. Consequently heat seeking missiles, and IR cameras, and IR thermometers are all tuned to the bands of low IR emission by the lower atmosphere. This model, for example, is tuned to the entire band of low atmospheric emissions, 8 µm to 14 µm (see spectral response under specifications).
Arguing the atmosphere is not largely opaque to IR radiation because you can use an instrument tuned to the wavelengths in which the atmosphere least opaque is bizarre, although certainly not unique to you among fake skeptics. Neither is misquoting a source to strengthen your case. I hope both were accidental, and that you will now recognize that Connolly's claim was correct.
2) If known temperatures and humidities (from observations are fed into a Line By Line (LBL) radiation model, the result looks something like this:
 This is the result of an actual comparison between a LBL model and observations over the Gulf of Mexico.
This is the same comparison with theoretical and observed spectra offset for clarity:
This is the result of an actual comparison between a LBL model and observations over the Gulf of Mexico.
This is the same comparison with theoretical and observed spectra offset for clarity:
 Here is a detail of the first image with black body curves shown for clarity:
You will notice that the absorption band of CO2 emits radiation consistent with a black body curve of 220 degrees Kelvin. As the Earth must on average emit energy equivalent to a black body curve of 255 degrees K to not continuously gain heat, it follows that that low emission must be compensated for by a higher emission somewhere else. Because of the absorption by water, the band in which that higher emission can come from is largely restricted to the area of IR transparency, ie, in which the radiation is coming from the surface. In order to emit IR radiation with a black body equivalence greater than 255 degrees K, the surface of the Earth has to be at at temperature greater than 255 degrees K. Ergo, the absorption of IR by CO2 forces the temperature of the surface to have a temperature greater than that which it would have had in the absence of the CO2.
That was all simple physics, and follows immediately from the observed emissions, and the conservation of energy. No amount of experimentation with a toy box can prove these observations false, and therefore not amount of experimentation with a toy box can show that the greenhouse effect does not exist.
In case you think that that observation/model comparison was cherry-picked because it was an unusually good fit, here is the scatterplot of 134,862 comparisons between measured, and modeled Outgoing Longwave Radiation (OLR) measurements:
Here is a detail of the first image with black body curves shown for clarity:
You will notice that the absorption band of CO2 emits radiation consistent with a black body curve of 220 degrees Kelvin. As the Earth must on average emit energy equivalent to a black body curve of 255 degrees K to not continuously gain heat, it follows that that low emission must be compensated for by a higher emission somewhere else. Because of the absorption by water, the band in which that higher emission can come from is largely restricted to the area of IR transparency, ie, in which the radiation is coming from the surface. In order to emit IR radiation with a black body equivalence greater than 255 degrees K, the surface of the Earth has to be at at temperature greater than 255 degrees K. Ergo, the absorption of IR by CO2 forces the temperature of the surface to have a temperature greater than that which it would have had in the absence of the CO2.
That was all simple physics, and follows immediately from the observed emissions, and the conservation of energy. No amount of experimentation with a toy box can prove these observations false, and therefore not amount of experimentation with a toy box can show that the greenhouse effect does not exist.
In case you think that that observation/model comparison was cherry-picked because it was an unusually good fit, here is the scatterplot of 134,862 comparisons between measured, and modeled Outgoing Longwave Radiation (OLR) measurements:
 3) A very minor point, but Wood's experiment was designed to show whether or not greenhouses warmed because of increase IR back radiation from the glass panels. His experiment successfully showed that they do not. It does not show, and is incapable from its design of showing, that the greenhouse effect does not exist. People who think it does do not understand the physics of the greenhouse effect.
In order to successfully test whether a slab model of the IR effect is physically sound, you need to isolate the radiated surface (floor of the box) and the window (top of the box) by means of a vacuum. I do not believe it is possible to model the actual greenhouse effect as seen in Earth's atmosphere in so small a physical model.
4) Names are acquired through history and retained from convenience. Yes, the "greenhouse effect" is not in fact the effect that warms greenhouses. But neither are tin cans made from tin, nor are rubber ducks either rubber, or ducks. Get over it. If such trivia are all you have to criticize the theory, then that theory is very well grounded indeed.
3) A very minor point, but Wood's experiment was designed to show whether or not greenhouses warmed because of increase IR back radiation from the glass panels. His experiment successfully showed that they do not. It does not show, and is incapable from its design of showing, that the greenhouse effect does not exist. People who think it does do not understand the physics of the greenhouse effect.
In order to successfully test whether a slab model of the IR effect is physically sound, you need to isolate the radiated surface (floor of the box) and the window (top of the box) by means of a vacuum. I do not believe it is possible to model the actual greenhouse effect as seen in Earth's atmosphere in so small a physical model.
4) Names are acquired through history and retained from convenience. Yes, the "greenhouse effect" is not in fact the effect that warms greenhouses. But neither are tin cans made from tin, nor are rubber ducks either rubber, or ducks. Get over it. If such trivia are all you have to criticize the theory, then that theory is very well grounded indeed.
-
Eric (skeptic) at 11:43 AM on 14 December 2011Galactic cosmic rays: Backing the wrong horse
muoncounter, that's reasonable but it is difficult to discern effects in noisy measurements. My engineering approach would be to describe one or more models of potential physics (e.g. some aspect of clouds), what input measurements are made and how they map to the model (e.g. proxy measurements), and what the model outputs are (e.g. types of cloud cover over various areas) and how those can be mapped to real world measurements (e.g. satellite measurements). I don't think it is possible to map a model output to GAT in a short or medium term, there is too much short term variation from other factors. My cloud cover example should be the easiest one and even that is hard in step 3 (obtaining suitable measurements and determining the mapping). I think that in the Dragic et al paper the diurnal temperature range link is rather diffuse. But your critique of the delay seem unwarranted since the cosmic ray created particles take time to grow (days seems reasonable). As Pierce points how, the higher the initial nucleation rate, the slower the growth rate. So a higher event (7% vs 5%) may be more detectable because there is more lag. Love (above) may be in the worst measurement regime namely decade timescales containing numerous natural cycles. -
skywatcher at 11:40 AM on 14 December 2011Galactic cosmic rays: Backing the wrong horse
scaddenp - The plausible mechanism is that of disruption of North Atlantic ocean circulation by a freshwater pulse, leading to a reduction in the exchange between ocean and atmosphere of C14, causing the plateau. The bipolar seesaw (Broecker 1998) of Antarctic warming at the time is strong evidence for ocean circulation changes, rather than an overarching global cause (solar/GCR/impact (impact discussed by RC here and in internal links). For ocean ventilation, references might be the Hughen ones linked in my #51, or Keigwin and Schlegel 2002, but there are dissenting voices, suggesting a much more mixed ventilation/other cause (e.g. Marchal et al 2000. A few references on the YD in this NOAA perspective article too. Wally Broecker on his flood hypothesis provides a very balanced discussion of the distinctiveness and of possible problems with a flood hypothesis. It may even be the last Heinrich event (see the refs via this Wiki page). What is clear about the YD: It's abrupt, and apparently a very unusual event during deglaciation. It is most pronounced around the Atlantic. It's not global, and abundant evidence exists for a 'seesaw' between NH and SH, suggesting changes in global oceanic heat transport via the Atlantic. Whether the trigger is massive flood, other freshwater discharge, ice sheet dynamics, or some other cause, the ocean circulation is altered, and there seems reasonable evidence that this drives the delta C14 changes. It's not a closed book, however, but there is no evidence that GCRs triggered it! -
Philippe Chantreau at 11:21 AM on 14 December 20112nd law of thermodynamics contradicts greenhouse theory
"the clouds have to be at a temperature above freezing to exist." That is incorrect. Temperature has to be at or below the dew point for any visible moisture to exist. Clouds can and do exist at temeratures at or below freezing. Liquid water can exist at air temperatures as low as -40 deg Celsius. -
scaddenp at 11:09 AM on 14 December 20112nd law of thermodynamics contradicts greenhouse theory
Gee, where to start? Did you look at SoD? How about (from SoD) "In any case, a larger portion of the incoming sunlight lies in the infrared range than in the visible range. In most papers discussing the supposed greenhouse effect this important fact is completely ignored." Talk about a completely unsupportable (and wrong assertion). However, the core would be about validity the RTE and (to quote SoD) their "imaginary 2nd law". Again, conventional text book physics has no problem producing predictions that match observation. If G&T were right, then this would be impossible. I'll stick with the text book thanks. -
Bob Lacatena at 10:20 AM on 14 December 2011(Fahrenheit) 451 ppm
69, skept.fr, I want to find some common ground, but you're putting words into my mouth, or at best over-interpreting what I am saying. Specifically, I do not "accept the fact that a part of the climate change is tolerable". I simply accept the reality that too an abrupt a transition from fossil fuel use would be just as intolerable as climate change. What I do not agree with at all, however, is your seemingly blasé and sluggish attitude towards getting started. Forgive me if I am misinterpreting your attitude, but "the very first priority is ... to reinforce the R&D..." is exactly my problem. This is an excuse for doing nothing else, for waiting while fossil-fuel magnates make trillions of dollars and the clock ticks ominously. R&D, yes. Application of available clean technologies on a much broader scale, right now, yes. Quick and meaningful changes in societal and individual behavior against grotesque and unnecessary waste, yes. And none of these solutions would in any way damage economies. They would help economies. They would mostly create jobs. But the profits would shift away from national and global conglomerates and into the hands of the people that actually do most of the work, because you'd be eliminating that international middleman that packages and transports the goods thousands of miles across continents for little reason other than the fact that it seems to be cheap... but it appears cheap because the externalities of the expenses are not applied now, to the transaction at hand. That is left to you and I to pay ten, twenty or fifty years down the road. But it's not that the expense isn't there. It just isn't obvious yet. It's rather like one of those deals with the devil where the poor guy is all shocked and upset when the devil shows up at the end to collect. The USA is abysmally behind in every possible tangible approach to the problem. In the USA, it is very rare to see a car more than 10 years old. If people had been serious about the problem, 80% of the personal vehicles in the USA could already be hybrids, just as a matter of people having purchased them as they retired their old vehicles, and this could have come with accompanying advances in the transportation of goods and a reduction in costs due to mass production and volume. But people aren't serious about doing things. They want to do what you propose, which is to pretend to invest in R&D. What they'd like is for scientists and engineers to work for decades on finding easy, painless, and virtually expense-free solutions so that they can keep living their lives in oblivious — but expensive — bliss. That may not be what you intend, but it is the ultimate outcome of your position and your attitude. You can say that you want action — but do nothing of meaning for far too long. And if you wait, you will find that both climate change and the economic catastrophe that you so fear will both fall upon you at the same time. -
TOP at 10:16 AM on 14 December 20112nd law of thermodynamics contradicts greenhouse theory
@1162 scaddenp Maybe you can tell me in what section of their paper they propound a misconception? The paper has 115 pages. I'd like to know one misconception and the page and section it occurs in. Then we can have a meaningful discussion. -
Zen69 at 09:53 AM on 14 December 2011Arctic sea ice has recovered
CBDunkerson Thanks. I have checked the references you gave me and I certainly took note of the passage on page 12 of the Schweige study which states "These results demonstrate that the model captures ice thickness variability beyond the annual cycle, suggesting that long term spatial and temporal variability may be well represented." The problem I am having is that I am not very scientifically literate, so when it comes to descriptions of models and stats I am liable to just glaze over. This is certainly the case with the above study. Is there any possibility that you could give me a brief summary of the process that is being described in the study and its overall findings, but in laymans terms and as simply as possible. I would be very grateful. Thanks. -
scaddenp at 09:26 AM on 14 December 2011Galactic cosmic rays: Backing the wrong horse
Skywatcher - you say "We have a very plausible mechanism in place for the observed changes of C14 and of regional cooling, in the form of changes in oceanic ventilation driving changes in delta C14". Do you have reference for this please? I'm interested in isotope variation by swamp methane (eg Petrenko) cf ocean ventilation. -
muoncounter at 08:44 AM on 14 December 2011Galactic cosmic rays: Backing the wrong horse
Wouldn't it be more correct to say that the necessary condition for Eric's necessary condition is that GCRs have a demonstrable impact on climate? or even on just the weather? Neither of those have been substantiated as of yet - and there is considerable evidence to the contrary: Dragic's disappointingly scant results, Pierce on aerosol nucleation (at RC) and Love et al's lack of statistical significance. -
Rob Painting at 08:33 AM on 14 December 2011Ocean Acidification: Corrosive waters arrive in the Bering Sea
Steve L @ 3 - Points 1 & 2 fixed. Thanks. 3. Higher water temperatures ramp up metabolic processes in the 'sea butterfly', which means they chew through their energy reserves (lipids) much quicker. In this particular experiment (Lischka [2011]) the sea butterflies were not fed. It's a bit of a no-brainer, but it is relevant because this species overwinters and relies on stored body reserves to last through winter when there is no food available. This animal has a 1 year life cycle, and exists in a larval form prior to overwintering. Warming of the sub-surface ocean suggests they'll be less likely to survive the winter, and continue to develop into mature adults (that process requiring the considerable expenditure of energy). But this all depends, of course, on how the pattern of ice cover (among other things) responds to warming in the future. Anomalously warm patches in the sub-surface ocean over autumn/fall are already being observed though, as detailed in Lischka (2011), and at a time when the sea butterfly was in a pre-wintering phase, and likely to have ceased feeding. -
Composer99 at 08:19 AM on 14 December 20112nd law of thermodynamics contradicts greenhouse theory
So, on the one hand, we have: - empirical findings of IR backradiation from the atmosphere measured from the surface; - empirical findings of IR wavelengths being blocked by IR-trapping (aka greenhouse) gases measured from satellites - empirical findings showing an energy imbalance at top-of-atmosphere, measured from satellites - empirical findings showing extra energy is rapidly building up in the Earth climate system (e.g. measurements of ocean heat content, ice melt, temperatures climbing) - other empirical markers of a rapid warming from meteorology and from ecology - experiment and known physics backing up all of the above And on the other hand we have TOP trying to tell us all that is wrong, wrong, wrong based on a few handheld IR thermometer measurements. -
scaddenp at 06:48 AM on 14 December 20112nd law of thermodynamics contradicts greenhouse theory
TOP, G&T spend about 18 pages telling us what is already well known and understood as if they had some shocking new insight before getting into their own misconceptions. Science has known for a long time that the "Greenhouse Effect" is poorly named. The article is only about what is new that G&T assert. -
scaddenp at 06:41 AM on 14 December 2011Galactic cosmic rays: Backing the wrong horse
"The necessary conditions for an interglacial appear to be consistently low GCRs for some period of time." Am I to understand that you think the driver for interglacial/glacial is GCR flux instead of the existing milankovich theory? ie we are in a glacial until GCR values drop? -
muoncounter at 06:39 AM on 14 December 20112nd law of thermodynamics contradicts greenhouse theory
TOP#1157 IR handhelds don't work that way. If you're not pointing at an object, it's not measuring anything. To claim a handheld can take the temp of the stratosphere is preposterous. -
Bob Lacatena at 06:32 AM on 14 December 20112nd law of thermodynamics contradicts greenhouse theory
TOP, You put words in my mouth. I never said the term "greenhouse" was a misnomer. I'm not saying I agree or disagree, because as Riccardo says, who the h-e-double--climate-hockey-sticks cares? It's a pointless debate. But you seem to have missed the point. Yes, you understand the purpose of the Wood experiment, but you have failed to understand why the design of the experiment was flawed. Please go back and read what I wrote. You are completely missing everything. As far as an IR-opaque atmosphere leading to global cooling... how the h-e-double-climate-hockey-sticks do you get that? -
Tom Dayton at 05:59 AM on 14 December 20112nd law of thermodynamics contradicts greenhouse theory
TOP, the term "greenhouse effect" is perfectly legitimate and useful for its intended use as a teaching and communication analogy for the high level mechanism: More energy comes in than goes out. You are obsessing about something of absolutely no consequence. -
Riccardo at 05:39 AM on 14 December 20112nd law of thermodynamics contradicts greenhouse theory
I can't belive that the meme "greenhoue effect is a minomer" keeps poppping up. It really tells nothing about the science and is a distraction that no one nedd, not even the sceptics/deniers. If Arrhenius (who probably was the first to use this analogy) knew, I'm sure he would not use it. And who's going to tell Tyndall of the new findings that "That is hardly a troposphere opaque to IR"? Luckly, we have comforting breking news: "Greenhouses warm because convection is prevented and not because IR radiation is blocked." Who could immagine that! Sorry for the sarcasm, TOP. But really the knowledge of the physics of the atmosphere and of radiation is way beyond that. Maybe you're right that it's not denialism but sure enough it's not "experiment" either. -
TOP at 05:32 AM on 14 December 20112nd law of thermodynamics contradicts greenhouse theory
@1154 Composer99 My experiment with the IR thermometer showed that the troposphere is not opaque to IR. Someone mentioned that I was measuring the temperature of the air around me with the IR thermometer. That is incorrect, I get essentially the same readings on a clear day whether the outside temperature is 90F or 20F. When clouds intervene the sky temperature goes up because the bottom of the clouds is lower and the clouds have to be at a temperature above freezing to exist. So, Connelly was wrong to say the troposphere is opaque to IR. G&T also talk about this in their discussion about how there can be frost on the ground when the air temperature is above freezing. -
Yvan Dutil at 05:30 AM on 14 December 2011Ocean Acidification: Corrosive waters arrive in the Bering Sea
"Trying to look on the bright side, perhaps these regions provide a window to the future to see how higher oceanic CO2 concentrations can be expected to affect these productive ecosystems." Yes, but this is not the kind of experiment I think we should do! -
TOP at 05:23 AM on 14 December 20112nd law of thermodynamics contradicts greenhouse theory
@1153 Sphaerica I'm glad you agree with G&T. The term "greenhouse" is a misnomer when talking about the atmosphere. G&T propose using the term "atmosphere effect".Fleagle and Businger (1963) [125] devoted a section of their text to the point, and suggested that radiation trapping by the Earth’s atmosphere should be called ‘atmosphere effect’ to discourage use of the misnomer. Munn (1966) [126] reiterated that the analogy between ‘atmosphere’ and ‘greenhouse’ effect ‘is not correct because a major factor in greenhouse climate is the protection the glass gives against turbulent heat losses’.[G&T quoting Lee, 1973]"Falsification Of The Atmospheric CO2 Greenhouse Effects Within The Frame Of Physics", Gerlich and Tscheuschner, 2009, p37
Further, the purpose of the Wood experiment was to determine whether it was radiation or convection that caused a greenhouse to warm. The results of the experiment were that a)it was convection, or the lack thereof that caused the greenhouse to warm and b)the heating of the greenhouse was influenced by IR from the sun causing the rock salt greenhouse to be warmer since rock salt allowed more IR radiation into the greenhouse.When exposed to sunlight the temperature rose gradually to 65◦C, the enclosure covered with the salt plate keeping a little ahead of the other, owing to the fact that it transmitted the longer waves from the Sun, which were stopped by the glass. In order to eliminate this action the sunlight was first passed through a glass plate.[bolding mine][G&T quoting Wood, 1909]"Falsification Of The Atmospheric CO2 Greenhouse Effects Within The Frame Of Physics", Gerlich and Tscheuschner, 2009, p33
Indeed, if the atmosphere were opaque to IR (longer wavelengths) we would expect global cooling based on this experiment.Moderator Response: [JH] There is no need for you to use a small font size for citations. If text is so tiny to be unreadable, it has no value. -
Steve L at 04:59 AM on 14 December 2011Ocean Acidification: Corrosive waters arrive in the Bering Sea
Yvan, I wonder how much of the methane is converted to CO2 before it bubbles to the surface? Trying to look on the bright side, perhaps these regions provide a window to the future to see how higher oceanic CO2 concentrations can be expected to affect these productive ecosystems. -
skept.fr at 04:54 AM on 14 December 2011(Fahrenheit) 451 ppm
Sphaerica : Absolutely, yes. But that basis can no longer be fossil fuels. Unfortunately, the investment and infrastructure for fossil fuels is so entrenched in our civilization that it will take many decades to replace it all... unless we try to do so in a too-rapidly painful way that will be as disruptive as climate change itself. Oh nice, we perfectly agree on that and so was my main point ! When you speak of a ‘painful’ and ‘disruptive’ decarbonization, that is exactly what I mean by ‘human evaluation of climate change’. You accept the fact that a part of the climate change is tolerable because a too abrupt energy change would be comparatively less tolerable. By doing so, you evaluate what is (more or less) good or bad for human society exactly as I suggest we should do. This does’nt mean you consider climate change as good in itself, but better (or not worse if you prefer) than an abrupt energy shortage. About climate, you’re projecting death and suffering in a possible and future world, but when it comes to human welfare, I’m personally speaking of death and suffering in our present and real world, for which certainty is 100% from observations, not X% from models. I confess that I‘m suspicious (and often irritated) toward climate-centered views that seem to ignore or relativize the other problems of humanity, the orders of magnitude of human needs in our world, the potentially damaging conflict between climate goals and energy supply, as I gave a concrete example with Indian dilemmas after Durban. But if your position is a realistic one, as it seems to be with this quote, there’s no problem : we agree. When it comes to solution, you must note that even if OECD divides by two its carbon emissions, what I hope we’ll do as fast at possible but what will already be a great challenge, this leave us with a 2 PgC decrease each year : but this quantity is what is henceforth added to annual emissions from developing countries in less than 10 years (see Peters et al 2011 in the carbon discussion) and this development is just the beginning of the great leap forward modernization of their societies. So let’s be clear : if we don’t want a ‘disruptive’ and ‘painful’ carbon plan, it will be very difficult to prevent a CO2 doubling. That’s why the very first priority is to ease the access to non-carbon energy everywhere it is possible, to reinforce the R&D in that domain and before all to price carbon externalities so as to give the good signal and improve RE competitiveness. At least I prefer this kind of clear way that to lose precious years with discussions around an unrealistic world 450 ppm target, not even mentioning the 350 ppm Hansenian ideal. PS : You point out the risk of fossil ‘near exhaustion’ : I suggest this could be another very good argument for a huge effort in decarbonization – and perhaps the future deus ex machina for a rapid (but if so difficult) energy transition. Tom Curtis seems to be very optimistic about fossil reserves, when suggesting in #44 we’ve enough for CO2 4600 ppmv, and CO2 1000 ppmv in this century. These ‘geologic’ quantities from USGS Survey (or ‘cornucopian’ estimates of Lomborg’s style) are IMO far from the real quantities we can extract and use at a sustainable cost for our economy. But we'll check that point well before 2050, or even 2030. -
Steve L at 04:52 AM on 14 December 2011Ocean Acidification: Corrosive waters arrive in the Bering Sea
Thanks for the update on ocean acidification. I look forward to the next post on oysters in the Pacific Northwest. A couple of editorial comments on this post: 1. "colder water being able to absorb more CO2" -- the water isn't getting colder, so "cold water" may be less confusing. 2. "further melt-induced warming feeds more nutrients" -- not sure what is meant here ... perhaps warming-induced melt increases run-off? 3. "warm seawater both contribute to higher mortality" -- could you expand on this? By what mechanism does warmer water influence mortality? Is it just quicker life cycle turnover or is it higher metabolism interacting with carbonate undersaturation? Thanks! -
Jim Powell at 04:44 AM on 14 December 2011Infrared Iris Never Bloomed
Excellent job, Dana. -
CBDunkerson at 04:32 AM on 14 December 2011Arctic sea ice has recovered
peacetracker, some information on Arctic volume uncertainty and validation can be found here and here. The point your 'sceptic' is making about 'estimates vs actual measurements' is belied by the fact that the estimates closely match the actual measurements where those are available. Basically, it is like claiming that if we have a +/- 0.01 C uncertainty on the precise global temperature anomaly at any given time then we should ignore the +0.8 C total change in the anomaly. The 'uncertainty' around Arctic ice volume is mis-used in exactly the same way... we might be slightly off the exact value at any given point, but there is absolutely no question that the volume has dropped precipitously. -
Yvan Dutil at 04:26 AM on 14 December 2011Ocean Acidification: Corrosive waters arrive in the Bering Sea
To the list of arctic environmental pressure you can add massive outgasing. Warning! Dont read the following if you are depressive! http://www.independent.co.uk/environment/climate-change/shock-as-retreat-of-arctic-sea-ice-releases-deadly-greenhouse-gas-6276134.html -
MasterLionel at 04:19 AM on 14 December 2011Antarctica is gaining ice
DSL, wow that IS a bit odd. Antarctic sea ice is expected to eventually start declining, but this seems more likely to be some sort of short-term fluctuation. The 'growth' in Antarctic sea ice has been small enough that the current year amount still drops below the long term average semi-regularly. This contrasts with the situation in the Arctic where skeptics got excited earlier this year about the extent coming CLOSE to the long term average for the first time in years. Make sure to read this: get far cry 3. Thus, the current dip is unusual, but not unprecedented. Looks like the Southern melt season started about two weeks early for some reason. -
TOP at 04:17 AM on 14 December 20112nd law of thermodynamics contradicts greenhouse theory
@1150,355 muoncounter I'm talking about those responding to the original post. In fact I wonder if the OP actually read G&T. As for comment #2, that post says G&T is completely wrong. That is a pretty broad statement. It means that the experiment that they did to show what the greenhouse effect is was wrong. And it means that in your quote of Connelly, he was wrong. The posts seem to wander away from dealing with G&T ad nauseum.
Prev 1389 1390 1391 1392 1393 1394 1395 1396 1397 1398 1399 1400 1401 1402 1403 1404 Next


