


 Arguments


Recent Comments
Prev 132 133 134 135 136 137 138 139 140 141 142 143 144 145 146 147 Next
Comments 6951 to 7000:
-
michael sweet at 22:45 PM on 16 June 2021The New Climate War by Michael E. Mann - our reviews
Nick Palmer:
So no examples of successful carbon sequestration at an industrial scale.
Perhaps you need to reconsider your criticism of environmentalists who are skeptical of an unproven technology.
-
nigelj at 08:10 AM on 16 June 2021The New Climate War by Michael E. Mann - our reviews
Nick Palmer @54 says "I think you lot are trying to hard to prop up a very long standing meme,....I think the true culpability of Big Fossil Fuel is not for resembling the activist meme of them being shadowy psychopaths intent on destroying the world for profit but rather for being like the punk in Dirty Harry who, when neither of them knew for certain whether there were any bullets left in the Magnum, recklessly took a chance and paid the price."
I don't see where I've supported that activist meme that "corporations are shadowy psychopaths intent on destroying the world for profit". Their motives are more complex than that. They seek profit because thats how the system works and the law requires they build shareholder value and I don't see that as evil, although it would be useful to see if the law could expand corporate goals to also include environmental objectives.
Corporations pollute because of the tragedy of the commons problem. There is not mush point blaming them for that too much, rather that the answer is government environmental laws or we change the entire economic system.
However corporations do misbehave and break laws at times and Exonn Mobils behaviour was underhanded. And I dont buy into this crazy notion that the oil companies behaviour was because of Greenpeace. The oil companies could see the writing on the wall that governments would put pressure on them one way or the other, and perhaps the general public will so they got worried about impacts on their incomes and job security etc,etc, and defensive and it lead to a campaign to spread doubt. I've seen polling studies of oil companies where almost their entire staff are climate change sceptics, liberals and conservatives alike.
But I agree with your Dirty Harry analogy.
"I came to my ideas from a lot of experience over several decades debunking 'ordinary' denialism, but I also found it quite often necessary to debunk alarmists too, who went much further than the peer reviewed science actually said."
Same with me. It's tough going because you get labelled a luke warmer and traitor. There's exaggeration, group think , bias and tribalism on both sides of the debate, but I think our side is far more objective overall and correct environmentally and thats the bottom line.
-
One Planet Only Forever at 06:45 AM on 16 June 2021The New Climate War by Michael E. Mann - our reviews
In spite of Nick’s comments, Mann’s interview does not support the position Nick takes regarding things like CCS. At the end of the interview Mann states that every tonne of emissions generated makes the future worse. Building CCS could excuse continuing to add tonnes making the future worse. It may be beneficial if it is imposed on already built fossil fuel operations. But it could be used to excuse building new fossil fuel operations or running existing operations longer.
I share the understanding that CCS is questionable. CCS does not, and will not, capture close to 100% of the produced emissions. And the captured stuff has not been “locked away with certainty”. The understood need to limit harm done to future generations leads to understanding the need to rapidly end the addition of carbon to the already massive problem. Given the already existing alternatives, especially the alternative of reduction of energy consumption, CCS does not justify building any new fossil fuel energy generation operation. CCS application would be limited to reducing the harm done by already built operations. And even that has questionable economics compared to rapidly building renewable generation and shutting down the fossil fuel burner. Being “already built” does not justify its continued operation, no matter what the people wanting to benefit that way claim. People benefiting from harmful unsustainable over-development do not deserve accommodation and compensation for their reduced potential for “Personal Happiness from harmful activity”.
Nick may pursue being “science correct”. But he does not appear to apply that science in an engineering sense to limit harm done. He appears to have a business-political biased perspective excusing harm done which is exposed by his statement in the comment @31.
“BTW, when I refer to left wing I am not referring to centre'ish politics like that of the US Democrats but more towards the sort of Utopian student revolutionary type beliefs.”
A brief political comment is required to begin the response to that:
A political perspective like Social Democracy pursuing increased awareness and improve understanding of what is harmful and applying that knowledge to keep harmful activity from being able to compete for popularity and profit is “Centrist” in the Left-Right or Socialist-Capitalist spectrum. The average of the diversity of views currently in the Democratic Party is pretty far Right of Center. The Democrats of the USA are only centre'ish in the significantly skewed realm of USA politics.
It is not Utopian to be aware of the need to correct the harmful over-development that has been produced by selfish people being able to get away with harmful actions and related beliefs that excuse those actions, especially the extremes that have over-developed in places like the USA. Harmfully unsustainable pursuers of maximum personal benefit “pursuing Their maximum Happiness in understandably harmful ways” have no sustainable future. But they are OK with that as long as things are good for them in their lifetime. And many of them will make-up beliefs that Their future generations will be just fine because things only ever get better for their type of people.
Awareness of that extreme bias towards making up excuses for understandably harmful beliefs and actions provides a robust explanation for the attempted arguments presented by the likes of Nick.
The following may not change minds like Nick’s, but it is likely a more Common Sense understanding of the situation.
Exxon appeared to be pursuing a science (increased awareness and improved understanding) and engineering (application of knowledge) pursuit of understanding applied to limit harm done. Then they appeared to shift to a business and political approach with misleading marketing, perhaps to protect their vested interests. And now they may be shifting to legal efforts to delay and minimize penalty consequences to allow current beneficiaries to keep each additional month of increased benefits before effective restrictions and penalties, if there are any, get imposed.
The tobacco case is similar. But so is the history regarding Ozone damaging compounds, sulphur emissions, and the recent “VW diesel deception” (harmful engineering for business motives) which discovered that parts of the VW organization did something harmful and deceptive that could not have been an oversight. And among the many claims made were claims that VW executives were unaware it had been done, that it was the actions of rogue technologists, not something that corporate leadership was aware had been done.
Nick does not present a “new” perspective. Making up excuses for harmful actions has a long harmful history. It is true that unless there is physical documentation as proof the motives of people are unknowable, even if they declare their motives. And even if there appears to be irrefutable evidence of motive it can still be denied or refuted.
So we are left with interpreting all of the available information, even information that contradicts beliefs about the glory of things like Freedom, Democracy or Capitalism. All those things are potentially good. But history is full of evidence showing that if the potential for harm is not effectively Governed and Limited harm will develop in any of those potentially helpful systems. And history is full of misleading marketing efforts to defend the systems and the resulting Winners, including misleading claims that those systems are better than any alternatives, and are better with less Governing or Limiting of what is allowed. That is misleading because a diversity of systems are helpful as long as harmful attitudes and actions are effectively and constantly limited from being popular or profitable.
Review my comment @29, in addition to revisiting my earlier comments.
I agree with others who have made it clear that it is incorrect to claim that misleading marketing is being equally applied by both extremes of this faux debate.The understood need to protect the future of humanity from harmful consequences leads to understanding that extreme potential harmful results are the appropriate considerations to be presented. Attempting to compromise that awareness by claiming that a "most likely" or average degree of harm is the “proper centrist or moderate” consideration is fatally flawed.
A failure to care about protecting the future of humanity leads to many Popular beliefs and claims, including claims motivated by the belief that already developed popular and profitable activity must not be demonized and penalized.
-
Nick Palmer at 06:31 AM on 16 June 2021The New Climate War by Michael E. Mann - our reviews
I think you lot are trying to hard to prop up a very long standing meme, originated by Greenpeace and subsequently promoted by, IMHO, political forces not related to pure climate science. I've never said that Big Oil should have done what they did, just that their motivation to do it may not have been that which was attributed to them by that meme. FWIW, I think the true culpability of Big Fossil Fuel is not for resembling the activist meme of them being shadowy psychopaths intent on destroying the world for profit but rather for being like the punk in Dirty Harry who, when neither of them knew for certain whether there were any bullets left in the Magnum, recklessly took a chance and paid the price.
If you've ever seen that analogy used in the climate wars, I originated it. My argument to denialists back then was that, by analogy, 'denier punks' had a right to risk their own lives by believing that there were no climate change bullets left, or that possible low climate sensitivity meant that any bullet would be nearly a blank, but that they had a much greater responsibility to not take any view which would put everyobdy else in the world at risk if they were wrong. I had long discussions about this general concept with Greg 'What's the worst that could happen' Craven whose approach of risk analysis I still think is far superior at getting through to the majority of the public rather than the 'This is what the science says', 'Oh no it isn't', 'Yes it is', shouting match that the public arena is.
I came to my ideas from a lot of experience over several decades debunking 'ordinary' denialism, but I also found it quite often necessary to debunk alarmists too, who went much further than the peer reviewed science actually said. Alarmism gives deniers a lot of amunition to smear the actual science, in the minds of the public, by proxy. A lot of current denialism consists of holding up the silliest statements of extremists to ridicule, rather than attacking the science directly, but unfortunately that rebounds badly on the actual science in the public's view who have little way of knowing which of the very confident sounding sides are accurate or legit.Long before John Cook started off the whole Denial 101 F.L.I.C.C initiative, I had been made well aware of the multiple deceptive rhetorical 'tricks' used by ordinary denialists to deny the peer reviewed science. I also became aware that the vast majority actually completely believed their position, whether it was the 'almost mainstream' luke-warmer position or the weirder 'against the second law of thermodynamics' pseudoscience types. What I did notice was that, say, in the comments of WUWT, virtually none of the former ever criticised the latter. It was only a very, very few, such as Mosher, who took on the real loonies. I also came to see that the reverse was also the case in environmentalist literature. Apart from a few such as myself, who has always tried to root out any mistakes, delusion or deceptions wherever they may be found, activist alarmism in publicly available media seemed to get a 'free pass' from those who normally argued the science, such as skepsci types. For what it's worth, I find it much harder to deal with activists, rather than with the more moderate 'denialists' as activist ideology isn't really based on a rational bullet-proof knowledge of the science, but rather on persuasive memes and Hans Eysenck's 'hobgoblins' to scare the public. I couldn't help noticing that BOTH sides used the same techniques of misdirection, cherry picking etc although, back then, it tended to be the more extreme - the incorrigibles of the denialist side - who did the lion's share of it. In the last few years, as the political aspects of the climate arena have suddenly popped out of the closet far more than ever before, and the sides have become ever more partisan, I'd say 'what lies beneath' the surface of people on all sides debating climate policy is surfacing.
I used to sit on my former Government's Energy panel, which was set up to deal with energy policy relating to climate science and the energy transitions required and I became pretty well connected with some significant movers and shakers in the climate science arena, both scientists, civil servants and media folk. For what it's worth, the panel also had representatives on it from gas and oil 'fossil fuel' corporations, plus the area electricity supplier. That's another reason why I'm virtually certain that the Greenpeace/Oreskes meme, that even some smart people seem to have swallowed hook, line and sinker, is a fair distance from the truth. The meme has a lot of the smell of simplified 'hobgoblins to sway the public' about it, rather than it being a completely accurate piece of historical reportage...
Anyway, it's been interesting to see the, in my view somewhat biased, kick-back from long term Skepsci followers. I think what I might do in due course is approach John Cook to see if we can arrange a Zoom meeting. He and Stephan Lewandowsky are right at the forefront of the 'psychological' approach to deconstructing denialist attitudes and methods. Maybe they'll be more welcoming of a new hypothesis than others... -
Nick Palmer at 04:05 AM on 16 June 2021The New Climate War by Michael E. Mann - our reviews
Just to reassure the audience that I was only criticising a part of Michael Mann's new book, the bit where he dismisses alternative solutions and rather over-eggs the 'Big Fossil Fuel is evil' meme, let me post this recent interview of him which very well encapsulates what I believe is true and I support almost every word he says in it
Interview of Michael Mann -
Eclectic at 21:03 PM on 15 June 2021If growth of CO2 concentration causes only logarithmic temperature increase - why worry?
Jimmww @5 , the global warming effect of CO2 is not a plain logarithmic effect (also note Scaddenp's comment @ #3 above). And thus your assertion is well off-target.
Why do you say climate change "is a given" ? Taken by itself, that comment doesn't actually make sense. To make some sense of it, you really need to explain yourself, in considerable detail. Your own slogans are not sufficient.
-
MA Rodger at 19:58 PM on 15 June 2021The New Climate War by Michael E. Mann - our reviews
Nick Palmer @47,
Youe "Meanwhile..." rather misses the point that Emily Atkin's May 26 blog is making. (And that even with all the words employed.) What explanation does Atkins give for good-news climate stories being framed as bad-news big-oil stories?
Describing May 26 as “A good day for life on Earth” means admitting to that fact [that "stabilizing the climate requires an end to oil and gas extraction"], and becoming vulnerable to cries of bias from the oil industry and its allies. News outlets don’t want to deal with that, so they simply call it “a bad day for Big Oil,” and let the industry attack those pesky oil-hating climate activists instead.
Your objection to that fact [that "stabilizing the climate requires an end to oil and gas extraction"] is that it ignores is that it " turns a blind eye to the use of carbon ca[pture and sequestration technologies which are far more advanced than types like her will admit."
If that is the idea you want to establish, make it and see if it floats. All this 'He said, she said, they said, type like her said' stuff remains boring nonsense and quite irrelevant if you cannot make the case for the survival of Big Oil as a big extractor of FF from the geology - this assuming your "Meanwhile..." is not just more wordy frippery.
-
jimmww at 18:04 PM on 15 June 2021If growth of CO2 concentration causes only logarithmic temperature increase - why worry?
Since the first 20ppm of CO2 produces 50% of its GHG effect, the next doubling to 800 ppm will in crease its GHG effect by less than 2%, overwhelmed, most likely, by the other eight forcings.
There are reasons to look for alternative sources of energy. There are good reasons to clean up our environment (and our bedrooms). Plastics in the oceans and rivers should now be our main concern. And it isn't! CO2 is not a pollutant.
Climate change is a given, not a problem. CO2 mitigation is a problem, not a solution.
-
nigelj at 16:55 PM on 15 June 2021The New Climate War by Michael E. Mann - our reviews
Nick Palmers theory appears to be the fossil fuel companies were defensive and spread denialism because they were under attack by extremist environmentalists and never offered the option of carbon capture because environmentalists allegedly hate it. The real reason for the fossil fuel companies defensive response and spreading denialism and doubt is far more likely to be vested interests, fear of job losses, dislike of government regulation / taxes, all the usual things. Just apply Occams Razor. This is far more likely than the complicated, fantastical movie like drama that is rather lacking in hard evidence, painted by Nick Palmer. This Greenpeace stuff would be a bit player in the whole affair.
-
michael sweet at 14:11 PM on 15 June 2021The New Climate War by Michael E. Mann - our reviews
Nick Palmer:
Suggesting that Greenpeace and Exxon Mobile are equivalent is really not valid at all. For decades the oil companies have received hundreds of billions of dollars subsidies to pollute our air. It is very rare for Greenpeace to be invited to teh table. Politicians are only moving now because renewable energy is cheaper than oil and climate change is causing catastrophies worldwide. Your suggestion that oil companies were responding to a few environmentalists is beyond reason.
Please provide a reference for a single power plant anywhere in the world that captures its CO2 and sequesters it permanently. There are a few operations that separate CO2 from natural gas and then pump the CO2 back into the ground to get out more oil and gas. Provide a reference for three full size industrial sites that pump CO2 into the ground permanently. Carbon capture and storage is completely uneconomic, there is no product to sell. Putting CCS on a power plant immediately makes it lose money.
You are simply spouting fossil propaganda.
-
Eclectic at 12:09 PM on 15 June 2021The New Climate War by Michael E. Mann - our reviews
Perhaps a little "light relief" is needed amidst the current navel-gazing.
The connection? That deepest abyss of denialistic blogginess ~ WattsUpWithThat (where I often monitor things). At WUWT , there is no name which causes spittle froth to rise to the lips of WattsUpites . . . faster than the name Michael Mann.
The SkS connection? In recent weeks and a number of threads (but only the science-discussing threads, not the multiple lunatic-political ones) one can see frequent comments by an old friend of SkS : Dikran Marsupial . (NB he hasn't posted at SkS in latter years.)
Along with the usual Nick Stokes, one sees Dikran Marsupial smiting the heathen , quite superbly. ( If one wishes some light relief!! )
-
Nick Palmer at 10:20 AM on 15 June 2021The New Climate War by Michael E. Mann - our reviews
I'll try and get back to the latest comments. You lot are STILL not understanding my main point and are jumping to fundamentally fallacious conclusions about my position. Some are indulging in exactly the same type of mental gymnastics that denialists do to avoid an inconvenient truth and maintain their biases. Clearly the battalions of strawmen above show I have shaken up the dogma...
In the meantime here, from todays 'Heated' report by Emily Atkins, which is apparently well respected, which is all about the 'three big wins' for the climate reported recently comes a snippet which shows that the idea that the left is cheering the result against the oil corporations and 'the right' is bemoaning it is common currency, which rather confirms the extreme political polarisation in climate news.
"But this analysis illustrates a fairly common phenomenon. News outlets routinely favor a political framing over an existential framing when it comes to climate stories. In general, the push-and-pull between industry and activists is given greater attention than the fight over everyone’s health and economic well-being.This framing is preferred in part because it sells. The Left sees a “bad day for Big Oil” and celebrates. The fossil fuel-backed Right sees the same and freaks out. Both result in great click-and-share rates—way better than the rates for “A good day for life on Earth.” (Believe me, I know.)
But this framing is also preferred in part because it’s safe. Though the news industry has made great strides in climate truth-telling, there is still one basic fact many outlets remain unwilling to state plainly: that stabilizing the climate requires an end to oil and gas extraction."
Note that the left wing Atkins repeats the activist mantra that all oil and gas extraction use must stop, which I have aleady pointed out would cause colossal damage almost overnight. She turns a blind eye to the use of carbon ca[pture and sequestration technologies which are far more advanced than types like her will admit
It's only a small jump from that to understanding how it was the political opportunism of the left which created the situation that led to Big Oil using lobbyists and think tanks etc to counter that opportunism in the minds of the public by using public relations techniques. It seems that people need to open their minds a little to maybe consider that the oil corporations were not really against solving climate change all along, as they have been relentlessly libelled, just the brain-dead and destructive 'solutions' that the anti-capitalist left wing embraced and wished to impose on them.
Heated June 14th -
nigelj at 09:55 AM on 15 June 2021The New Climate War by Michael E. Mann - our reviews
Bob Loblow @45
"I did not get the impression that NIck denies this (my note: oil companies knowingly engaged in climate denialism from the early days onwards) - I was more under the impression that he thought it was a reasonable reaction to what he considers an "unwarranted attack"."
I got the impression Nick thought the oil companies didn't knowingly and deliberately spread denialism because he was so critical of Orekses book (at comment 3) which apparently linked oil companies to denialism. Maybe I interpreted it all wrong. Apologies to Nick if I did. Its really easy for Nick to clarify the issue.
And if he was just saying the oil companies were reacting to unfair attacks on them at that time, the science has firmed up in recent years yet at least some of the fossil fuel companies still seem to be linked to denialism. So whats their excuse now?
I tend to actually agree with quite a few of Nicks views which I hope I've made clear. So this is a tricky thing for me to comment on. There seems to be an element of truth that some peolpe scapegoat oil companies to shift responsibility away from their own lifestyles, just as oil companies blame individuals to shift responsibility away from themselves. But the idea that denialists are denialists because Greenpeace's occasional bouts of craziness seems untenable. It might be a factor hardening some peoples attitudes but the denialism has other more fundamental roots.
-
Bob Loblaw at 08:11 AM on 15 June 2021The New Climate War by Michael E. Mann - our reviews
Nigelj @44:
I did not get the impression that NIck denies this - I was more under the impression that he thought it was a reasonable reaction to what he considers an "unwarranted attack".
-
nigelj at 07:02 AM on 15 June 2021The New Climate War by Michael E. Mann - our reviews
I have to agree with MAR that Nick Palmers evidence regarding Greenpeace and fossil fuel companies is rather anecdotal and unreliable looking ( I think thats what MAR is saying). Same thought occured to me but I had given up on this discussion. However out of curiosity I just did a five minute google seach "fossil fuel companies promoting climate scepticism, doubt and denial" , and literally about the first four hits showed that people have researched this in depth, and come up with utterly compelling hard evidence, company documents etc,etc that shows fossil fuel companies have promoted climate denial, doubts etc. I dont know how Nick can deny this. The examples:
-
MA Rodger at 22:45 PM on 14 June 2021The New Climate War by Michael E. Mann - our reviews
I am always of the view that long passages of argument are a sign of a poor understanding. This big long comment interchange, now 18,000 words long, provides a good example of the phenomenon.
Nick Palmer @37,
You write "Perhaps it might help if you and the other two knew three things which might help you to realise that I'm not just making this up." [**My emphasis]
You then set out these "three things." First there is some anonymous late-night conversation overheard back in the 1980s discussing "Greenpeace ... going down a slippery slope." Second, a couple of your school chums now work for big oil and they aren't evil people. (I'm not sure where your G7 comments and GreenPeace=AntiNuclear comments fit in with this.) Third GreenPeace were not enthusiastic about supporting Cold Fusion.
** The "this" you insist you are "not just making up" concerns what you term "the insinuative narrative that just about everyone seems to have accepted." I would have thought the existence of such an "insinuative narrative that just about everyone seems to have accepted" could be demonstrated easily enough without all this massive wordage. And apart from your "three things" setting out the notion that GreenPeace is evil or something, and that you tell us this "insinuative narrative" was "originated largely by GreenPeace," I fail to see any reason for sharing these "three things."
-
Bob Loblaw at 06:30 AM on 14 June 2021The New Climate War by Michael E. Mann - our reviews
Oh, I"m addicted. Phillippe asks Nick:
"At what point in time did the science become strong enough to demand action?"
I'd like to ask Nick a slightly different question:
At what point in time did the science become strong enough that arguing that "it is all wrong and global warming is not going to happen" became an unwarranted attack?
-
Philippe Chantreau at 05:16 AM on 14 June 2021The New Climate War by Michael E. Mann - our reviews
OK, I understand what you're saying. You're still not addressing some of Bob's and my points. There is a big disconnect in your discourse. Clarify a few things for me:
At what point in time did the science become strong enough to demand action?
For one principled as you are on communicating the science, at what point does denial rethoric become unacceptable?
As of now, only baby steps have been made, in large part because vested interests have been successful at delaying significant action over the past 20 years, way beyond the 80s or 90s. Was this justified?
As much as activist organizations can ask for ending fossil fuel use now, it has a zero probability of happening and even a zero probability of being attempted. You contradict yourself by stating on one hand that corporations are worried that the public would buy into that extreme activist threat, and on the other that their view is "non-starter" for at least half the population.
Your argument appears to boil down to this: it's ok to support false/misleading denial rethoric because, if it's not out there, these activist groups will convince the world of ending all fossil fuel use from one day to the next. That's a stretch reaching the breaking point. In fact, it is not believable at all.
Was it ever desirable for denial rethoric to be so successful as to prevent any effort at a transition, even one that did not present the existential threat you mentioned?
Since you have spent so much effort combating misinformation, would you say it was ever desirable to have such a large proportion of the public buying into all the myths this site debunks?
Is BAU and a never ending status-quo desirable?
Can we honestly say that nothing between the extremes of status-quo and end-it-all now could possibly be worked out?
Is it realistic to consider that, if fossil fuel companies accepted the conclusions of the science, they would instantly disappear, in view of how ingrained fossil fuel use is to our economies and all aspects of our lives?
As for nuclear, as I have said earlier, I am not opposed, at least in principle. They just need to get their sh*t together and stop being over budget and behind schedule.
Fusion sounds great, but is unrealistic as short or even mid-term solution. Cold fusion has not been beyond the pipe dream level. The best hot fusion to date is the recent 101 seconds at 120million deg at EAST. Nowhere close to breaking even, let alone produce anything. ITER is supposed to be complete in 2025, I doubt they'll see plasma before 2026.
Meantime, the multiple wedges approach that we could have adopted 20 years ago (a very reasonable approach completely removed from extreme views) has not happened on any significant scale and we sailed passed 400ppm.
-
Nick Palmer at 04:39 AM on 14 June 2021The New Climate War by Michael E. Mann - our reviews
Incidentally, I'm going to re-link to the video of greenman3610 - Pete Sinclair - interviewing Marc Morano because I spotted many contributions by me to the comments below it.
https://www.youtube.com/watch?v=JFnhTo6Wd80
My screen name back then (8 years ago) was aylesmerep. Most of the denier/sceptics myself and my tag team partner yubedude (who I never knew the real name of - anyone know who they were?) took on deleted their comments because we 'whupped their arses', so it's very difficult to follow the threads nowadays but I remember their content. Realoldone2 was a cracker! I think Robert '1000frollyphd' Holmes was there too.
I find it fascinating to see how arguments in the climate science wars have changed so much in such a short period. Back then many denier comments to such videos were really smart and they always argued the science and nothing but the science. It's only really the last few years that the 'reds under the bed' hypothesis to explain why climate science was, they assert, faked up has taken off like wildfire in the general and conservative media. It doesn't help that some well known climate science media 'go to' figures, such as Professor Kevin Anderson, who is one of Greta Thunberg's support team, is nakedly left in his politics and his choices of solutions he thinks appropriate.
I think what has happened is that the 'debate' has become rapidly polarised recently on political ideology grounds and the various political stances of major figures are now being increasingly blatantly paraded. I wish the political biases of the various protagonists could be stripped out of the public arena, as this development is wholly counter-productive in my view -
Bob Loblaw at 04:37 AM on 14 June 2021The New Climate War by Michael E. Mann - our reviews
All this is getting way off topic as far as Michael Mann's book is concerned.
Nick: you are sounding here like a fossil fuel apologist, Lefties, Greenpeace, socialism, accusing others of following a "gospel", etc.
You seem to feel that it was OK for Big OIl to fund B.S. I do not. Let's leave it at that.
-
Nick Palmer at 04:07 AM on 14 June 2021The New Climate War by Michael E. Mann - our reviews
Bob wrote "I really hope that you do not consider sound science (even with uncertainties) to be "an unwarranted attack".
and "If you are referring to non-scientific organizations such as Greenpeace, then I hope that you are not saying that unwarranted attacks justify B.S., simply because it is "effective"."
I am stating that the science was not strong enough back then for the world to have any real confidence that the balance of negative and positive outcomes projected for various amounts of global temperature rise from the rudimentary knowledge of the various sensitivities would be bad, good or neutral.
Bob wrote "Using phrases such as "top climate scientist" represent an argument from authority. I was already teaching undergraduate and graduate climatology courses when Andrew Dessler was still a grad student."
You sound like a denialist! They don't like anyone quoting the statements of top climate scientists either and often accuse one of using the argument from authority 'logical fallacy'. The thing is, quoting an actual 'go to' authority in the field of climate science is not really invalidated by dismissing it as a logical fallacy. I'll take Dessler's viewd over yours any day, particulary as I have interacted with him a little in the past. Sorry... -
Nick Palmer at 03:45 AM on 14 June 2021The New Climate War by Michael E. Mann - our reviews
Phillippe wrote: "That is why I find it kind of puzzling that you would make excuses for the promoters of such disinformation"
It's not excuses, it's an alternative explanation to the insinuative narrative that just about everyone seems to have accepted. I think that narrative is fundamentally flawed and was constructed by people with a strong ideological bias as a way to socially engineer the public towards a position that public otherwise might reject. This was originated largely by Greenpeace and is now aided and abetted by Oreskes/Supran and similar who get quoted in articles/programmes in major media where the mass of the voting public can be influenced by them.
Perhaps it might help if you and the other two knew three things which might help you to realise that I'm not just making this up. First, I was at a conference of the environmental organisation I was a part of at the time in the 80s. It was late night in the corridors and the top directors were 'relaxedly' discussing the way Greenpeace were going down a slippery slope precisely because they were abandoning a focus on reasonably presented peer-reviewed science in favour of 'scare stories' to gee up their followers and recruit more by 'empowering people' - in short they were going political to get more power and the direction was not to the right or centre.
Like it or not, even those of the public who don't support the tactics of Greenpeace mostly trust them to be 'telling truth to power' and so industry and commerce have respect for what the public believes if it might impact on their bottom lines. Greenpeace's rhetoric on climate change has swung sharply towards the draconian 'stop all fossil fuel use now' extremity and has been taken up by street activists and social media influencers and warriors. Their top guys have got brains so, considering that if the world actually did this it would almost overnight be immediately thrown into the mother of all global economic crashes which would cause far more devastation, hunger, death and destruction than anything climate change is projected to do for many decades, one has to speculate on hidden motivations for an explanation.
Second, a couple of childhood friends of mine, who came from a long time 'oil industry' family, ended up pretty high in the executive hierarchies of the major international oil corporations, so I have had quite an insight into their company's corporate attitudes over the years, so that's why I think the waay exagerrated (or wrong) insinuations of corporate 'evil' by those trying to push a political ideology which, in their case, appears to outrank whatever environmental ideology they may still have, stink. That's why I said that "they have kids and grandkids they worry about too". There are obviously some psychopaths in top board rooms who actually are in denial but despite anti-corporate propaganda, they really are not anywhere near being in the majority.
The G7 meeting, which is just down the road from me, has just finished. The White House has just issued this, to my mind, very good document.
FACT SHEET: G7 to Announce Joint Actions to End Public Support for Overseas Unabated Coal Generation by End of 2021
Just watch the 'usual suspects' jump on the word 'unabated' and loudly denounce it as 'weasel words', because the development and use of carbon capture and sequestration technology is a direct threat to what they appear to want to happen, which is the destruction of Big Fossil Fuel as some sort of 'punishment' for what they believe, or choose to pretend to believe, the corporations did and as a means of bringing in their almost certainly unworkable pie in the sky vision, that the majority would reject voting for, as to how the world should live.
Much though I regretted it, about 50% of the US voted for Trump both at the start and the finish of his term. Greenpeace's headline socialism-heavy hippy-dippy harmony - Nature! - vision is a non-starter for huge numbers of people and not just in the US. I'm pretty sure that explains why most of the major environmental organisations are still virulently against nuclear power even though the majority of studies show that it will be an essential part of the future energy portfolio of the world. One has to wonder why they are still so against it, even though their arguments against it have become increasingly thin, outdated or invalid. I submit this is because their underlying plans are making them reject anything which promises to rescue the world's use of so much energy and this bias is based on their ideological drive to have a low energy use world.
Third. One incident which cemented my views as to the naked political undercurrents beneath the superficially 'green' stance of some top environmental organisations, was round about 1989. This was when two electrochemists in the U.S thought they had discovered a brand new form of nuclear energy - cold fusion - which created no nuclear waste or ionising radiation and offered no potential for 'nuclear proliferation' or misuse by terrorists. In short, it promised a world where everyone could have a pollution free megawatt unit in their garage. I was associated with some of the people who checked out and ran experiments to validate (or not) the findings and I took it upon myself to contact Greenpeace U.S. (by phone! wasn't cheap!) to suggest they should throw their weight behind getting public acceptance and investment for this new miracle 'save the world, not just the whales' technology. They went very quiet and the temperature metaphorically dropped below freezing. You'll just have to believe my assessment of what was happening as I can't prove it, but it seemed very clear that they were very hostile to the possibility that this new energy source could keep our current society going, decarbonise cement, steel and industry, enable 'indefinite range' electric cars, give abundant cheap energy to the Third World etc and many other 'good' things that, on the face of it, they should have been for. -
Philippe Chantreau at 01:51 AM on 14 June 2021The New Climate War by Michael E. Mann - our reviews
Nick,
I have been at this for a number of years, so I am well aware of your contribution in fighting misinformation. That is why I find it kind of puzzling that you would make excuses for the promoters of such disinformation.
What constitue an unwarranted attack? If you want to argue that accusations of nefarious intent back in the days of high uncertainty were unwarranted, I can't disagree with that. If you want to argue that calling for efforts toward a real energy transition in the more recent times of much more limited uncertainty constitute unwarranted attacks, I can not agree.
So the activist you mentioned take liberties with the scientific information, they exaggerate and distort. Nonetheless, the direction in which they are pushing is indeed the one called for in view of what the science actually shows, whereas the inaction promoted by the fossil fuel supported outlets, that exaggerate and distort in other ways, can not be justified.
Is it warranted to work our way to doubling of pre-industrial concentration just to see what happens? If it really goes to hell, will the very rich individuals who profited from the extended status-quo pitch in to help? In view of the threat, and the magnitude of the task, what is truly unwarranted?
-
MA Rodger at 20:54 PM on 13 June 2021Antarctica is gaining ice
wideEyedPupil @506,
There is a 'Global Maps' page on the GISTEMP website HERE that you may find useful. It maps the warming across the globe between any time periods as well as providing a graph of warming by latitude.
If you set the 'Time Interval' to something a decade-long (so perhaps 2010 to 2020 from the ) and for the full year, the warming of the Arctic since the 'Base Period' is obvious, as is "the slowest warming around Antartica." Surrounded by a doughnut of slow-warming oceans, the warming over the continent of Antarctica is less obviously exceptional.
-
Jim Hunt at 17:23 PM on 13 June 2021Antarctica is gaining ice
Hello again WEP,
That is certainly the case for the Arctic. Here are some brief instructions on how to answer that sort of question for yourself:
https://GreatWhiteCon.info/2021/05/steve-koonins-unsettled-arctic-science/#WRIT
Here's just one example, which hopefully answers your question?
I leave producing the Antarctic version as an exercise for the interested reader. -
wideEyedPupil at 13:58 PM on 13 June 2021Antarctica is gaining ice
Thanks Bob, guess the bit I'm trying to clear up is the question i asked:
My understanding has been that while Land masses do warm faster than oceans (for more than one reason) but that warming at the polar regions had been more like 2-3 °C compared to the global average of 1.0-1.1 °C.
is true of either the North or South poles that they're warmed more than the global mean?
-
nigelj at 13:50 PM on 13 June 2021The New Climate War by Michael E. Mann - our reviews
Nick Palmer @31, I do understand where you are coming from but I have a couple of disagreements.
"I thought I'd already addressed that. The short answer is that Big Oil continued to support the "B.S. factories" because they were effective at trying to protect those corporations against unwarranted attack."
That doesn't mean the corporations don't also use lobby groups to help spread denial. You seem a little bit stuck in an either / or mindset.
"Anyone who regularly takes on the really incorrigible denialists, as I do - I don't mean the brainwashed rank and file Hicksville idiots, but the much smarter ones - soon discovers that beneath all the high sounding 'alternative science' of the 1000frollyphds, the B.S. factories, Heartland's James Taylor, Quora's James Matkin etc are people who are almost always actually motivated by just a couple of things, of which by far the most common is extreme ideological antipathy to the 'big government' solutions promoted by extremist activists - the deep green environmentalists, the 'Smash Capitalism' closet reds and the 'System Change, not Climate Change' demonstrators."
This extreme ideological antipathy to big government is indeed common thing with the denialists, a libertarian and conservative leaning thing, but you need to understand many of these people define big government as anything beyond military and policing! They are opposed to anything that isn't very small government. So to say climate denlialism is the fault of a few extreme political activists proposing very big government is flawed logic.
"The 'Greenpeace knew' report and the recent Oreskes/Supran paper really are not evidence showing which way the truth lies being, as I've suggested before, chock full of cherry picking and insinuation and, in my view, the leading-the-reader attribution of malignant motives to innocent(ish) behaviour because of the underlying ideology of the authors. Oreskes is known to be significantly left wing and long ago Greenpeace's leaders adopted similar, or stronger, politics and I find their campaigning and assertions have got increasingly slanted and deceptive too."
I thought Orekses book was actually quite good if a bit too general, but there is plenty of hard evidence tying oil companies to spreading denialism of you look around. Read the book Dark Money for a start.
"What is noticeable is that no matter how convincingly one may have demolished their case, give them several weeks, or a couple of months, and one will often find them using exactly the same flawed logic, cherry picked facts and deceptive framing as before. This could mean either they have some sort of mental condition where their mind edits out their defeat so, like psychics who forget all their wrong predictions and only remember any correct ones, they maintain a spurious sense of their own abilities or they don't care much if you demolish their case in public because their only goal is to sway the public mind to their desired end and they know that the public has a very short memory and that the short denialist memes 'it's the Sun, it's cooling, it's cold now in Hicksville, it's cosmic rays etc have a very powerful ability to fool, or at least induce doubt and uncertainty in, the public's minds."
Yes its some sort of mental condition of a sort. Some people have difficulty admitting to themselves they are wrong or have been sucked in, so they hang onto beliefs. They become stubborn and entrenched. We probably all do a bit at times. With others the stubborness and arrogance is more extreme. Google narcissistic personality disorder. Combine this with small government leanings and a smart mind and a reasonable knowledge of science and you have a nuclear powered denialist, and the internet gives them the whole world to preach to. It's really frustrating to say the least.
-
Bob Loblaw at 06:10 AM on 13 June 2021The New Climate War by Michael E. Mann - our reviews
One additional point, related to timing.
The Heartland institute, a major player in the climate science denial industry, was founded in 1984. According to the Wikipedia entry linked above, it moved into tobacco industry work in the 1990s, and into climate change lobbying in the 2000s.
To say this was justified by uncertainties in climate science as known in the 1970s seems a stretch.
-
Bob Loblaw at 05:42 AM on 13 June 2021The New Climate War by Michael E. Mann - our reviews
Oh, Nick. You're repeating yourself, and it does not stand you in good stead.
"The short answer is that Big Oil continued to support the "B.S. factories" because they were effective at trying to protect those corporations against unwarranted attack."
I really hope that you do not consider sound science (even with uncertainties) to be "an unwarranted attack".
If you are referring to non-scientific organizations such as Greenpeace, then I hope that you are not saying that unwarranted attacks justify B.S., simply because it is "effective".
"...most seem to have been happy to accept Greenpeace et al's interpretation of events as gospel..."
A strawman position...
"I refer you again (3rd time) to my quote of Carbonbrief's article and the words of top climate scientist Andrew Dessler of Texas A&M Uni."
Repeating the quote is certainly not necessary. Using phrases such as "top climate scientist" represent an argument from authority. I was already teaching undergraduate and graduate climatology courses when Andrew Dessler was still a grad student. I had and have direct knowledge of the primary peer-reviewed scientific literature from that time.
I hope that you do not think that the 1.5C to 4.5 C sensitivity range is a complete summary of climate science.
I hope that you do not think that there was a huge amount of uncertainty regarding the lower limit back in the 1980s. There was lots of uncertainty of regional effects. Lots of uncertainty about cloud feedback effects (but unlikely to be strongly negative).
From the 1990 IPCC sumamry for policy makers:
There are many uncertainties in our predictions particularly with regard to the timing, magnitude and regional patterns of climate change, due to our incomplete understanding of:
• sources and sinks of greenhouse gases, which affect predictions of future concentrations
• clouds, which strongly influence the magnitude of climate change
• oceans, which influence the timing and patterns of climate change
• polar ice sheets which affect predictions of sea level rise
These processes are already partially understood, and we
are confident that the uncertainties can be reduced by
further research However, the complexity of the system
means that we cannot rule out surprisesTHe 1990 IPCC report includes quite a bit of discussion about these uncertainties, and what needs to be done to sort them out.
One of the very few sources of a realistic argument for low sensitivity was Lindzen's "Iris effect". As Lindzhen had a good reputation as a meteorologist, this hypothesis was taken seriously. It did not pan out.
Most of the rest of the "sensitivity is low" arguments were B.S. Many were clearly B.S. in the 1980s - and are still B.S. now, even though they keep getting repeated..
Dessler may feel that the uncertainty was underestimated. Do you have any evidence of an actual number that he would put on it?
Did Exxon choose to push the known uncertainties and realistic scientifically-supportable possibitiies? No. As you admit, they chose the Baffle Them With B.S. option.
You seem to feel that was justified on their part. I do not.
"...the views of sensitivity at the time were just not solid enough to mandate massive corporation change..."
...but they were solid enough to start to invest considerable money (albeit probably peanuts for Big Oil) in the B.S. factories, in an attempt to preserve and maximize corporate profits for as long as possible.
If Big OIl's approach was so honorable, then why did they try to hide the path of the money and keep their name off it?
If you were to argue that Big Oil's corporate responsibility is to maximize shareholder value regardless of ethics, then I would concede the point.
-
Nick Palmer at 02:48 AM on 13 June 2021The New Climate War by Michael E. Mann - our reviews
I realise I've got an uphill struggle with you lot because you are unlikely to have heard anyone arguing this position before - most seem to have been happy to accept Greenpeace et al's interpretation of events as gospel without deconstructing it enough. When one has been deconstructing the deceit, delusion and/or dumbness from the various denialist factions for decades, as I have, one can't help it if one sometimes notices the very same methods being used by our 'side'. I personally think that demonising Big Oil's past activities and misrepresenting them as if they were real denialism is very counter-productive. Apart from anything else, one of the most powerful arguments I use against tricksy denialist rhetoric is that these days even Big Fossil Fuel fully accepts mainstream climate science and they acknowledge that something serious needs to be done to avoid the very unacceptable risks. I point that if there was a trace of reality in the arguments that have sucked them in, Big Oil's scientists would have noticed and their corporate execs would have then beaten a wide path to the doors of the sceptic/contrarian/denialists with wheelbarrows full of cash to learn about their magic get-out-of-jail-free cards. When I challenge denialists to explain, if they are so sure of their beliefs, why this is not happening, and never did happen, they either shut up or go off into the lala land of conspiracies I list later on. In either case, the wider audience sees they have nothing real...
Bob Loblaw@25 wrote:
"Give me a break. I was studying climatology for 10 years before Hansen's speech, and a dozen years before the 1990 IPCC report"
I refer you again (3rd time) to my quote of Carbonbrief's article and the words of top climate scientist Andrew Dessler of Texas A&M Uni.
C.B.: "In 1979, the Charney Report from the US National Academy of Sciences suggested that ECS was likely somewhere between 1.5C and 4.5C per doubling of CO2. Nearly 40 years later, the best estimate of sensitivity is largely the same.
However, Prof Andrew Dessler at Texas A&M University pushes back on this suggestion. He tells Carbon Brief:I think that the idea that ‘uncertainty has remained the same since the late 1970s’ is wrong. If you look at the Charney report, it’s clear that there were a lot of things they didn’t know about the climate. So their estimate of uncertainty was, in my opinion, way, way too small"
"Back in 1979, climate science was much less well understood than today. There were far fewer lines of evidence to use in assessing climate sensitivity. The Charney report range was based on physical intuition and results from only two early climate models.
In contrast, modern sensitivity estimates are based on evidence from many different sources, including models, observations and palaeoclimate estimates. As Dessler suggests, one of the main advances in understanding of climate sensitivity over the past few decades is scientists’ ability to more confidently rule out very high or very low climate sensitivities."
I'm not disputing that the basic science of radiative physics and the simple climate modelling of ECS of 'how many degrees per doubling' has been around a long time. As a matter of fact, as a science geek, I knew about some of the scientific views in my later teens (early 70s) - about the time I stopped buying aerosols (apart from WD40...) to protect the ozone layer. The uncertainty of outcome referred to by Dessler is to the 'known unknowns' and 'unknown unknowns' at the time and these were very significant. The (some of) CMIP6 model problems were mentioned just to show that even today some crucial feedback mechanisms affecting ECS are still being nailed down 40 years later.
It is the solidarity or otherwise of the climate sensitivity figures AT THE TIME of the memos and documents cherry picked in 'Exxon Knew' which is at the very nub of whether, as the populist environmentalist narrative goes, Exxon were evil or, as I am convinced, just cautious because the views of sensitivity at the time were just not solid enough to mandate massive corporation change without a lot more scientific work to more reliably figure out what ECS was (not to mention the Transient and Earth system sensitivities too). If Exxon's scientists told their bosses that, as Dessler wrote, Charney's figures were waay more uncertain than Charney thought they were, that is not evidence of psychopathic evil, it's just evidence of good scientists offering a very valid criticism of another scientist's work.
Sure, at the time, Exxon's own scientists acknowledged the basic 'settled' science but of course they would also acknowledge the great uncertainties which the 'anti's turned a blind eye to. There was nothing sinister about that and it is the attribution of malignant motives to Big Oil by Greenpeace et al that I have a serious issue with. There is so much deceit, deception, propaganda, selective and misleading information from all sides out there that I think our 'side' should clean up its act and disavow all that stuff and just stick to the best peer reviewed science, the best risk analysis and not indulge in dubiously demonising (probably) innocent'ish corporate behaviour that has been, in my view, massively misrepresented or rule out many solutions, as Mann has done, which have great potential thus making 'the answers' much harder to achieve.
-
Nick Palmer at 01:20 AM on 13 June 2021The New Climate War by Michael E. Mann - our reviews
Well, there's too much to address there! Just a couple of points.
Phillipe@28 wrote: " However, that would leave one wondering why they continued to support the bullshit factories churning out propaganda favorable to their short-term financial interests in the following 30 years, as uncertainty dwindled away."
I thought I'd already addressed that. The short answer is that Big Oil continued to support the "B.S. factories" because they were effective at trying to protect those corporations against unwarranted attack. Pharmacological/vaccine corporations are currently coming under similar COVID19 propaganda type attacks to their detriment - they have less of a need to use 'B.S. factories' because most of the population have been familiar with vaccination most of their lives, so they know that the attacks are mostly baseless. The general voting public have no such familiarity with climate change, and the effectivess or otherwise of the many and various solutions put forward out there, so they are vulnerable to political manipulation by ideologically motivated types who think 'the answer' to the whole (not just climate change but biodiversity loss, inequality, 'white supremacy', LBTQ+ gender inequality etc etc) situation is to change 'the system' to end up with a world where we all live in some sort of vaguely defined harmony with nature and everybody is equal and all the wealth is redistributed to achieve their faith-based dreams of a socialist paradise. Part of that playbook is undermining established big industry and 'decentralisng'.
Anyone who regularly takes on the really incorrigible denialists, as I do - I don't mean the brainwashed rank and file Hicksville idiots, but the much smarter ones - soon discovers that beneath all the high sounding 'alternative science' of the 1000frollyphds, the B.S. factories, Heartland's James Taylor, Quora's James Matkin etc are people who are almost always actually motivated by just a couple of things, of which by far the most common is extreme ideological antipathy to the 'big government' solutions promoted by extremist activists - the deep green environmentalists, the 'Smash Capitalism' closet reds and the 'System Change, not Climate Change' demonstrators.
I really don't know if these 'denialist/lobbyist' people truly believe all the propaganda they put out, in which case they would have been driven to delusion to protect their favoured clients and industries to sabotage the 'stop all fossil fuel use today and indict the corporations types' or if they cynically know that they are deliberately spreading deceit and misdirection to achieve the same end.
The 'Greenpeace knew' report and the recent Oreskes/Supran paper really are not evidence showing which way the truth lies being, as I've suggested before, chock full of cherry picking and insinuation and, in my view, the leading-the-reader attribution of malignant motives to innocent(ish) behaviour because of the underlying ideology of the authors. Oreskes is known to be significantly left wing and long ago Greenpeace's leaders adopted similar, or stronger, politics and I find their campaigning and assertions have got increasingly slanted and deceptive too.
BTW, when I refer to left wing I am not referring to centre'ish politics like that of the US Democrats but more towards the sort of Utopian student revolutionary type beliefs.
Blowing my own trumpet, I am one of the very few climate science denier fighters who can actually beat them to the point where they shut up (the smarter ones) or else (the dumber/madder ones) they resort to increasingly irrational conspiracy theory ideology to respond (not 'the scientists are all faking it for grant money' conspiracy but full-on Rothschilds, Bilderbergers, Illuminati, New World Order - even the shape shifting lizards!) which lets the reading/listening audiences see 'what lies beneath'. What is noticeable is that no matter how convincingly one may have demolished their case, give them several weeks, or a couple of months, and one will often find them using exactly the same flawed logic, cherry picked facts and deceptive framing as before. This could mean either they have some sort of mental condition where their mind edits out their defeat so, like psychics who forget all their wrong predictions and only remember any correct ones, they maintain a spurious sense of their own abilities or they don't care much if you demolish their case in public because their only goal is to sway the public mind to their desired end and they know that the public has a very short memory and that the short denialist memes 'it's the Sun, it's cooling, it's cold now in Hicksville, it's cosmic rays etc have a very powerful ability to fool, or at least induce doubt and uncertainty in, the public's minds.
A clear example of the second type is Marc 'Climate Depot' Morano who is so confident of the validity of his position that he even proudly described it on camera to greenman3610 (Pete Sinclair).
https://www.youtube.com/watch?v=JFnhTo6Wd80
He still appears to believe in his 'in denial of mainstream climate science' position but he does admit here to using misleading rhetoric etc to achieve his ends, which are to sway the views of the public. He more or less admits to using 'the game' to propagandise. Even this is not necessarily smoking gun evidence of 'evil' if he truly believes his own rhetoric is accurate, it's just yet another example of what I call 'non-clinically diagnosable insanity' of which the online world is now suffering a tsunami!
My main point is still this. I'm just about certain that the underlying motivations and beliefs of all major figures in the climate change wars are far more nuanced, and often hidden, than the simplistic 'they knew', 'they're evil', 'they're stupid' etc epithets flung at them by their opponents, whose motivations are similarly complex. -
nigelj at 08:07 AM on 12 June 2021The New Climate War by Michael E. Mann - our reviews
OPOF @29 yes the engineering design philosophy and its approach to harm minimsation and being generally cautious is very useful. I used to work in achitectural design and we had much the same things. Unfortunately the related building codes were relaxed in the mid 1990s by a neoliberal leaning Ronald Reagon loving government to "minimise costs and regulation" . The end result was a leaky homes nightmare of massive proportions that has cost the country billions of dollars, and a lot of hidden psychological stress.
-
Bob Loblaw at 06:44 AM on 12 June 2021California, ‘America’s garden,’ is drying out
sfkeppler:
Virtually every land surface receives a portion of the water that falls on it as precipitation from the oceans. How do I know this? Virtually every land surface has streams and rivers that eventually return water to the oceans, and the only way for it to get back from the oceans to the land is for it to evaporate from the oceans and get transported through the atmosphere back over the land.
The processes that control this are the weather and hydrological cycle.
For the specifics in your question: California gets much of its water from the Pacific Ocean. A lot less Pacific Ocean moisture reaches far inland, though, due to the west coast mountains. For much of the U.S. east of the mountains, the Gulf of Mexico and the Atlantic Ocean are major sources. Further north, into Canada (especialy the mid-west), you start to see some moisture that finds its way from the Pacific, across Alaska, and then back down into the continental areas.
For the Amazon (and any oher forests), as long as there are streams and rivers draining to the ocean, they will be getting more in preciptation than they are losing by evaporation.
In Europe, much comes from the Atlantic Ocean. Asia? Look to the Indian Ocean for central areas, and the Pacific for eastern areas.
Exact pattern vary with daily and seasonal weather patterns, but there are some dominant consistent patterns. There is an interesting animation on this page:
https://gpm.nasa.gov/education/videos/water-vapor-animation
and that same resource has good information on the hydrological cycle in general.
A nice image of the dominant patterns is in this Wikipedia image:
https://en.wikipedia.org/wiki/Hadley_cell#/media/File:Earth_Global_Circulation_-_en.svg
Here is a smaller version of the image:

-
One Planet Only Forever at 03:25 AM on 12 June 2021The New Climate War by Michael E. Mann - our reviews
nigelj,
I agree that it is irrational to claim that the extreme presentations from the climate-action side of this faux-debate cause climate science denial or the many other efforts to delay the undeniable required rapid ending of the many harms produced by attempts to benefit from fossil fuel use and the related loss of status by people whose perceptions of status are tied to benefiting from fossil fuel use.
As an engineer, to limit harm done any potentially harmful uncertainty is addressed by designing a solution that will deal with very extreme requirements for the uncertainties (see my comment @11). That means:
- conservatively limiting the potential for harmful results. People wanting to benefit from the harm done would call that extremely over-doing the avoidance of harm. They would want to compromise those understandings and actions.
- conservatively identifying the harm and risk impact levels of concern. People wanting to benefit from the harm done would call that extremely over-stating the identified potential harm.
- conservatively implement the means to address the conservatively established concerns of harmful outcomes. People wanting to benefit from the harm done would call that extremely over-reacting to limit the potential for harm.
It is important, not harmful, for very severe harmful climate impact outcomes based on uncertainty to be presented.
Leadership should be striving to limit harm done by human activity. It is faulty logic, actually unethical, to try to argue that it is harmful to restrict economic activity that is potentially or actually harmful. It does not matter how popular or profitable an activity has become, or how much poorer and less powerful some supposedly superior people would become.
Harmful activity needs to be kept out of economic and political competition for popularity and profit or potentially helpful things like Capitalism and Democracy (which are being proven to be potentially very harmful due to the competitive advantage of selfishness and misleading marketing) will suffer failures that unjustly discredit their potential for being sustainably helpful.
-
MA Rodger at 03:22 AM on 12 June 2021CO2 lags temperature
Ducked @632,
There is indeed a wobble in the MLO CO2 record that matches a preceding wobble in the global temperature record of a few months earlier, both of these wobbles matching an even earlier wobble in ENSO. The actual thing wobbling CO2 is rainfall which promotes/reduces CO2 absorption by the likes of the Amazon rain forest. (See map from this NOAA webpage below.) There is quite a literature covering this phenomenon (eg the likes of HERE or HERE) but be warned - there are a few papers by swivel-eyed denialists lurking within the proper work.

-
sfkeppler at 03:07 AM on 12 June 2021California, ‘America’s garden,’ is drying out
Does someone think about the origin of the humidity which forms the rains in California and all America, up to Greenland, Scandinavia and hole Europe? This is no Joke! - Look at the stratospheric and climate occurance over the carribian see. There is always coming some humidity from the pacific, mixing up with the humidity of two mighty vapor producers, the Amazon and the Orinoco basins. I have no doupt, that if we want to bring rain to America's gardens, we should inhance Amazonia's evapotranspiration.
Actually lots of the floodable forests, Várzea and Igapó are severely desturbed. Especially during the dry season in the Amazon, this leeds to a severe vapor-deficit in the upper layers of the atmosfere. As a consequence, there is savannization of the nonflooded forests and drought in the northern and southern hemispheres, which depend on that moisture.
-
Philippe Chantreau at 02:58 AM on 12 June 2021The New Climate War by Michael E. Mann - our reviews
Nick Palmer,
I can not agree that your characterization of CMIP6 as running "too hot" accurately reflects the performance of the models involved in the exercise. Some of the models have a higher ECS than any found in CMIP5 and thus pulled up the average ECS for the ensemble. They may be wrong, and the Zelinka paper suggests a possible reason, but that is no reason to discount the rest of them, and not even a reason to consider their high ECS as impossible. Everyone would love to see a low ECS materialize, especially so-called skeptics, but AFAIK nobody has shown that any ECS significantly lower than the most common 3degC estimate has a higher probability of being real than one that is much higher. The high ECS models tend to perform lower at hindcast, but that also says only so much.
I did not find at Real Climate anything that would remotely confirm the blunt language you used, which is awefully similar to the types you condemn. When inputting CMIP6 in the RC search box, I found these posts:
https://www.realclimate.org/index.php/archives/2019/11/sensitive-but-unclassified/
https://www.realclimate.org/index.php/archives/2020/06/sensitive-but-unclassified-part-ii/
Both are good reads for anyone truly interested in understanding what goes on in the CMIP6 exercise. Zeke Hausfather has a great take on the CMIP6 issue, which I suspect was posted before publication of the Zelinka paper:
https://thebreakthrough.org/issues/energy/cold-water-hot-models
Forgive me if I misinterpreted, but the overall tone of your remarks on models seem to suggest that their performance has been poor, in general, and that they can't be trusted. This couldn't be further from the truth, as shown by Gavin Schmidt in the latest update at RC on the subject:
https://www.realclimate.org/index.php/archives/2021/01/update-day-2021/
I don't really know what the Oreskes and others' message is, as I don't read much from advocacy groups. It seems you have a beef with the idea that accusing Exxon, among others, of wrongdoing back in the pre-1990 times is misleading. That may be so. However, that would leave one wondering why they continued to support the bullshit factories churning out propaganda favorable to their short-term financial interests in the following 30 years, as uncertainty dwindled away.
-
Bob Loblaw at 01:10 AM on 12 June 2021CO2 lags temperature
Ducked:
The quote/question about time lags is actually on the page following the one you linked to in your first link (reached by clicking "next"). The two pages do not appear to have different URLs, though, so readers will have to navigate to the next page after following the initial link.
The quote about 5 months time lag (from the second link, which only gets me to the abstract) appears to come from a study that looks at the past 30 years of data. The article is paywalled (I might be able to get to it via work), but my guess is that if they are looking at only 30 years of data, then they are looking at monthly or more frequent readings.
Atmospheric CO2 measurements from locations such as Mauna Loa show strong seasonal variation. This short-term variation is driven by different fluxes and reservoirs from long-term changes. This will affect any calculations of time lag, when compared to long-term patterns on the century scale (fossil fuel combustion) or millenial and longer scales (geologic processes). Geological records of temperature and CO2 will not be capable of resolving monthly values, so a 5-month lag in seasonal patterns is not visible.
-
Ducked at 00:13 AM on 12 June 2021CO2 lags temperature
I don't have much of a problem with CO2 lagging behind temperature at the end of a glacial period. It isn't all that surprising and the explanations are convincing.
That CO2 still lags behind temperature (though apparently by only a matter of months rather than hundreds of years,"Changes in carbon dioxide content lag those in temperature by five months."[1} is more of a puzzle to me and I havn't seen an explanation for it yet.
I'm sure there is one that wont require denial of recent anthropogenic climate change, but I don't know what it is.
This enquiry arose because I'm teaching using an online resource that includes the following question for students
https://authoring.concord.org/sequences/47/activities/282/pages/1753/3a7c351a-50c0-4646-8824-e2eef8f53762
5. Using Models To Make Predictions"Why is there a lag between changes in CO2 levels and temperature?
(Hint: Remember that there are many reservoirs for carbon dioxide. Where can carbon dioxide be stored when the temperature is low?)"I find this question unclear (Do they mean changes in atmospheric CO2, in which case the "hint" doesn't appear to make any sense?) and it implies that CO2 leads temperature change, which wasn't the case in 1990
{1} Kuo, C., Lindberg, C. & Thomson, D. Coherence established between atmospheric carbon dioxide and global temperature. Nature 343, 709–714 (1990). https://doi.org/10.1038/343709a0
Moderator Response:[BL] Links activated.
The web software here does not automatically create links. You can do this when posting a comment by selecting the "insert" tab, selecting the text you want to use for the link, and clicking on the icon that looks like a chain link. Add the URL in the dialog box. -
nigelj at 12:35 PM on 11 June 2021The New Climate War by Michael E. Mann - our reviews
Clarification to my comment at 26: However its not tenable to claim these far left environmentalist somehow triggered any of the climate denialism.
-
nigelj at 08:31 AM on 11 June 2021The New Climate War by Michael E. Mann - our reviews
Nick Palmer @23
I didn't say Exon had clear and certain knowledge of the dangers of climate change way back then. I think the oil companies knew there was a problem, but not the full extent, like anyone else at the time. Remember I said this "Exon knew there was a climate problem but told the public a different story. Theres no way of excusing this. Even if Exonn didnt really understand the true extent of the problem it doesn't change the utterly mixed messaging."
While you're right that companies use lobbying organisations to fend off government regulation, its very hard to believe that big oil funded these lobby groups but didnt realise they were promoting denialism, or didn't fund them to assist in promoting denialism . The most I would concede is that not all fossil fuel companies would be the same.
Yes many of the very active environmentalists lean very left politically and want to smash capitalism. Michael Moore's film Planet of the Humans perhaps falls into that category. It was a very frustrating film full of inaccurate information and anti renewables rhetroic. I fall into the camp that thinks capitalism needs some reforms, but I don't think anyone has come up with a completely new alternative thats workable or ever will. I find the far left almost as annoying as the far right. But environmental activists will do what they do and believe what they beleive just as libertarians do the same.
However its not tenable to claim these far left environmentalist somehow triggered right wing climate denialism. If you look at the history of denialism of science in general its driven by a variety of things from vested interests, political views, religion, human psychology and some of these are politically neutral things. The far left environmentalists might have added a bit to the polarisation of the climate issue. But so have the far right denialists! Hugely so.
Of course big oil won't have its own internal documents talking about denialist myths like solar forcing and cosmic rays. They are not stupid. They outsource this to the lobby groups. But like I said in my previous comment, demonising the oil industry on and on seems ultimately a bit pointless.
Ok maybe I was too dismissive of Stephen Schneider. However the point I'm trying to make is the number of climate scientists that come across as serious, over the top alarmists is in a minority. In my admittedly anecdotal experience most seem pretty measured in their comments. The IPCC reports are very measured. So its unfair to accuse the scientific community of over stating the nature of this climate problem. One or two scientists go crazy, claiming climate change will kill billions of people in a decade, etc,etc. I find this rather frustrating because it feeds the denialists, but they are in a small minority.
-
Bob Loblaw at 07:57 AM on 11 June 2021Antarctica is gaining ice
WEP. Yes, the two key early papers that Manabe was involved in were:
Figure 16 from the second paper illustrates the stratospheric cooling associated with surface warming:
 Figure 16")
-
Bob Loblaw at 07:36 AM on 11 June 2021The New Climate War by Michael E. Mann - our reviews
Nick Palmer:
I agree with what Phillip and NigelJ have said to a much larger extent than I agree with what you have said. I will focus on a few points in your latest comment.
"I was referring to the definite and real uncertainty in the science BEFORE Hansen's 1988 speech"
Give me a break. I was studying climatology for 10 years before Hansen's speech, and a dozen years before the 1990 IPCC report. I did not need Greenpeace or any other media reports to know what was going on - I was reading the primary literature. I found about papers like Manabe and Wetherald (1967) by reading them when they were still <20 years old.
"It is less than honest of people to assert that our modern established science in any way is comparable to the nascent science back then,"
It is less than honest for people to assert that there was not a lot that we knew back then, either. We knew in the mid 1980s that Sherwood Idso's arguments for negligible warming were wrong. That did not stop special interests from funding him for decades afterwards. That funding was not intended to pursue a legitimate sicentific goal - it was to sow doubt.
Climatology was not "nascent" in the 1980s. It was "nascent" in the 1880s.
"I submit that these tactics of Big Oil were just ordinary political manoeuvring to resist irrationally draconian 'green/red' calls until the science got strong enough. "
I submit that if this were the case, then Big Oil would have tried to argue the real science and legitimate uncertainty, instead of funding positions that were already known to be bunk.
"...government pandering to the views of misinformed activists ..."
You mean like the denial industry that was created specifically to maximize the extent to which politicians and the public were provided with misinformation? As you point out, right-wing politicians like Margaret Thatcher had a reasonably realistic view of the science several decades ago. Something - someone - managed to convince them otherwise.
"It is a matter of record that the fossil fuel industry increasingly deserted the early 'denialist' fossil fuel organisation - which was formed in 1989 - the 'Global Climate Coalition' - until by the early 2000s it was disbanded, and this was because the science had got strong enough."
Alternate explanation: as early denial organizations lost credibility, it was easier to let them die and fund new organizations that could spout the same misinformation under a new name. Until that organization loses it credibility. Or don't even wait - just create a whole bunch of them and make it look as if there is widespread doubt.
Much of the rest of your comment dives into "the mean lefties made them do it". I heard the same kind of arguments being made about general environmental issues when I worked in the oil patch in the early 1980s. It was not a reaction to climate isuses - it was a standard rhetorical tactic long before then.
"BTW, are there are any links to Big Oil documents which actually deny the science in the way that deniers do - it's the Sun - it's cooling - it's cosmic rays - the temperature record was tampered with - it's all fraud etc? I've never seen any actual full-on denialism in them. "
Because they learned from the problems the tobacco industry ran into over their internal documents? And funneled the money through shell corporations or institutes to hide the source, letting the denial groups do this for them? People that don't want to get cuaght doing what they are doing usually figure out eventually to not keep records.
It doesn't matter if Big Oil believed the denialism or not - they sure funded it. Out of the goodness of their hearts, or because they thought it made good business sense?
-
One Planet Only Forever at 04:01 AM on 11 June 2021The New Climate War by Michael E. Mann - our reviews
Nick Palmer @18 and 23,
I have the following perspective to add to the responses provided by Philippe and Nigel.Be careful. You may be presenting a defence similar to claims that atrocious things, like slavery and racism, unjustly prolonged by previous generations were done "at a time when people did not know better".
Reading evidence based presentations like "A People's History of the United States", by Howard Zinn, exposes that what people today often fail to understand is that better understanding did exist but failed to be "Beneficial to the wealthy and powerful" and as a result it failed to be "Popular".
Also, claims of the Boon to humanity from fossil fuel use is misleading. There is very little lasting benefit for humanity from this burst of harmful unsustainable human activity. Many technological developments did not occur because of the use of fossil fuels. In fact, a focus on benefiting from fossil fuel use significantly distracted effort from other potentially less harmful and more sustainable developments. And the easy access to power has allowed far more harm to be done by humans than the harmful climate change impacts. Any perceptions of advancement that depends on cheaper higher artificial energy use is destined to fail to continue in the future. The perception so ending poverty are a particularly galling case. Any part of that perception that relies on fossil fuel use or comparably cheap energy use has no future. Sustainable development limits the need for artificial energy and requires all the artificially generated energy to be obtained sustainably, which include not using up non-renewable resources and requires no lasting accumulating harm to be done by the energy production, distribution or use.
In spite of global wealth rising far faster than global population there continues to be horrid inequity and injustice. Getting richer and more powerful clearly does not mean getting better. Note that at the time of slavery there was a very long period of time where the unacceptability of slavery was understood, but popularity of profit and other benefits traumatically prolonged the activity. And the worst part of the end of slavery in Europe was that in the end the rich people decided that their peers who were wealthier because of slavery would be financially compensated when the forced end of slavery happened, with no compensation give to those who had been enslaved and were now disadvantaged by the socioeconomic-political system and on their own.
I strongly urge everyone to be better informed about what is harmful and what is sustainably helpful.
- Read "The Age of Sustainable Development", by Jeffrey D. Sacks, or take the MOOC of the same name. It is not new. It is the result of continued pursuit of increased awareness of the harm being done by human development.
- Read the first global recognition of the harmful unsustainability of human actions that was recognized globally as early as 1972 at the Stockholm Conference.
Claiming "Exxon didn't know better" fails to admit that they were not "responsibly thoughtfully doing what the most responsible and thoughtful people were aware of and doing at the time".
The “Fog of misleading marketing compromised democracy, consumerism and capitalism” is like the Fog of War, a lousy excuse for horrible things being done.
Exxon had been on a more helpful leadership track in the 1970s. But something changed in the 1980s (Reagan/Thatcherism was a significant result of that change). And Exxon's approach to climate science appears to have changed at that time as well. The timing of Reagan/Thatcherism looks like a reaction to the growing awareness and understanding of harmful human developments that needed to be corrected, a fearful aggressive misleading marketing response to the increasing awareness and improving understanding that things needed to change and government action was required to make it happen. It was a reaction to the realization that the Free Competition for superiority in systems like Capitalism causes problems it resists correcting (popular and profitable things are hard to correct). And that realization meant that some wealthy powerful people would not maintain their developed sense of status. And the required corrections and potential for wealthy people to be losers would be in many industries like chemical and food companies, not just fossil fuels.
More than a decade ago, the understanding developed that a rapidly increasing Price on Carbon along with other Government actions to curtail fossil fuel use, including actions to encourage renewable energy system implementation and development of improved renewable energy systems.
The questions become things like:
- Was Exxon's messaging leading the promotion of that helpful understanding?
- Or was Exxon pushing misleading marketing like claiming that corrective action to limit harm should not happen until there was "More certainty" regarding the need for the corrections? That is the way the current system has developed so harmfully and so harmfully resists correction.
- Did Exxon promote a significant and rapidly increasing Price on Carbon along with other Government actions to more rapidly end the use of fossil fuels? Or did they promote the idea that a fixed certain "Price on Carbon" could be determined by an economic evaluation comparing benefits that would have to be given up today to reduce the harm done to future generations, with the future harm discounted (see my comment @17)?
- Did Exxon executives do what the law of the USA regarding Publicly Traded corporations requires them to do - “whatever they can get away with to maximize shareholder wealth”? Exxon could have been sued by shareholders if they acted to educate about the need to reduce fossil fuel use. That is an example of the harmful flaws that have developed in the Freer competition for superiority that so many wealthy people, and people who want to be like that, will excuse and defend.
Raising awareness and improving understanding regarding harmful activity and how to limit harm done should not be done by misleading marketing. But misleading marketing that achieves that objective is helpful in spite of perceptions of harm done. Without “Dramatic attention getting” the issue would be something people are less aware of and less understanding of. As for “getting more people to support the actions” ... Leadership compromising awareness and understanding and delaying required corrections in order to appeal to more people is Harmful Unsustainable Leadership. The sooner that type of Leadership fails to be influential the better the future for humanity will be.
Perceptions of success and progress based on unsustainable activity, especially harmful activity, are delusions no matter how popular or profitable they are at the time. And undeserving wealthy powerful people have been masters of harmful delusion, misleading marketing, throughout history. That is what needs to change. And that means a deserved loss of status for many high status people rather than “excuses, appeasement and delays trying to maintain undeserved perceptions of superiority” that compromise what is understood to be required to limit harm done so that humanity can have a sustainable improving future on this one amazing planet that may be the only planet that humans can be certain of being able to sustainably live on for many millions of years into the future.
The unjustified lack of leadership through the past few decades by the wealthiest and most powerful on the transition to rapidly ending the accumulating harm done by fossil fuel use is a travesty. The wealthy and powerful cannot claim they were “unaware”. They also have little ability to claim uncertainty about the magnitude of impact. The fact that fossil fuel use was unsustainable needed no research. Burning up non-renewable resource has no potential in the future of humanity. It was only ever a temporary ability for some to benefit in ways others never would be able to. Even now people try to argue that the less developed portion of the human population should not be allowed to use fossil fuel energy at the level that the Supposedly more Advanced, higher status, portion of the population still do (30 years after clear indications of the need to end fossil fuel use). And using Bob Loblaw’s concern “what if I am wrong?”, the 1.0C of warming already experienced is producing harmful climate changes impacting many people, especially the poorest. And that warming is less than the low end of the 1.5C to 4.5C warming due to a doubling of CO2.
-
Nick Palmer at 02:05 AM on 11 June 2021The New Climate War by Michael E. Mann - our reviews
Phillipe and NigelJ. I think you two have somewhat missed that I was referring to the definite and real uncertainty in the science BEFORE Hansen's 1988 speech and the formation of the IPCC. That is when the documents in 'Exxon Knew', which are now held up as evidnec of 'certain' knowledge and associated deceit, were created. It is less than honest of people to assert that our modern established science in any way is comparable to the nascent science back then, upon which it would have been simply wrong to base far-reaching, global economy affecting/dismantling policies. It is verging on deceit to cast aspersions at targets who are not guilty or, at least, very much less guilty than they are being accused of being, using sophisticated rhetoric, cherry picking, misattribution of motivation etc and all the liguistic techniques that such as John Cook has clarified the denialist 'side' as using.
The uncertainty I was referring to (ordinary man-in-the-street definition, not the scientific one), at the relevant time, and what was not well understood then, was of such a magnitude (look again at the Dessler quote I gave) that it was entirely justified that Big Oil did not turn on a sixpence and shut down when the environmental organisations seized on this new way to attack Big Industry by using activist's frequent tendency to make unwarranted speculations on fragmentary evidence, then deciding that whatever unlikely speculative doomy result they came up with is almost certain to happen and then using that to justify calling for bans and authoritarian restrictions to avoid that end.
There can be no doubt that Big Oil sponsored think tanks, Institutes and lobbying organisations that used actual denialist rhetoric as part of their portfolio of techniques to try to influence politicians and policy formulations but, and I think this is where a lot of people go wrong, this should not have caused people to jump to the conclusion that Big Oil was deliberately spreading denialism because they were actually in denial of climate science - pause for a lot of screaming and gnashing of teeth by the extremists! I submit that these tactics of Big Oil were just ordinary political manoeuvring to resist irrationally draconian 'green/red' calls until the science got strong enough. The primary function of such lobbying organisations is to help their clients fight back against what they see as heavy handed legislation or inappropriate policy making by government pandering to the views of misinformed activists and those members of the voting public whose views have been changed by them to the point where they would vote in such draconian and misconceived action.
It is a matter of record that the fossil fuel industry increasingly deserted the early 'denialist' fossil fuel organisation - which was formed in 1989 - the 'Global Climate Coalition' - until by the early 2000s it was disbanded, and this was because the science had got strong enough.
"The GCC dissolved in 2001 after membership declined in the face of improved understanding of the role of greenhouse gases in climate change and of public criticism" https://en.wikipedia.org/wiki/Global_Climate_Coalition
Anyone who engages with denialists, the right wing or who defends the basic priciples behind environmentalism (which are, of course, still very valid) will pretty soon be accused of being a 'watermelon' - green on the outside, red on the inside, by which they mean that environmentalists have a superficial layer of concern for the environment masking a far left 'smash capitalism' ideology underneath. This is not a conspiracy theory! It is clear that many recent significant spokespersons indeed do have a very deep seated antipathy towards the capitalism system, upon which they lay the blame for all sorts of mankind's woes and they have an ideological zeal that only their pet version of international socialism will save us all - which goal, to them, justifies the deceit and propaganda they use as they try to 'socially engineer' the masses.
It is these 'fifth columnists' who created the Patrick Moore's, the Patrick Michael's, the Bjorn Lomborg's and who gave such as the Heartland Institute such large amounts of ammunition to doubt the integrity of the genuine, reasonable scientifically based policies. Bear in mind that one of the very earliest politicians to warn about the dangers of potential climate change in public and political circles was the rather far right Margaret Thatcher
https://www.youtube.com/watch?v=VnAzoDtwCBg&t=30s
and it was the far left who more or less started denialism off by insinuating that it was all fake science to justify shutting coal mines down, to handicap the development of the Third World and to accelerate the expansion of nuclear power. It was only afterwards that the left realised that if they became anti-global warming they could have a powerful stick to hit Big Industry, the international monetary system etc and slip their desired political outcomes in by the back door. That change in outlook in turn created the right wing/libertarian opposition - first to the 'solutions' the left claimed were mandatory and then their political 'chess moves' generated out and out deceitful-but-plausible-sounding denialism to undermine the legitimate science by appealing to the U.S.'s conservative blue collar population that it was actually a reds-under-the-bed attempt to undermine their freedoms.Here is the very rational Zion Lights explaining why she disavowed her earlier extreme, ideology based, environmental beliefs and how she sees those beliefs as counter-productive these days.
https://quillette.com/2021/05/31/the-sad-truth-about-traditional-environmentalism/
Whether activists like it or not, I believe it was the environmental organisations excessive and unwarranted views, and the political engineering of (some) of their leaders, which led them to make simplistic and ill thought out (or craftily planned) demands for policy changes which would have been disastrous. A far more likely explanation of Big Fossil Fuel's stance and acts is not that their execs were real denialists possessed of a psychopathic disregard for humanity but that their adverts and public facing statements were their attempt to resist politicians moving against them and implementing the type of draconian policies called for by those with fallacious, or at least well over-the-top, views in some cases motivated by an underlying 'closet' political ideology - Smash Capitalism! - that the public would never actually vote for if it was expressed out loud.
BTW, are there are any links to Big Oil documents which actually deny the science in the way that deniers do - it's the Sun - it's cooling - it's cosmic rays - the temperature record was tampered with - it's all fraud etc? I've never seen any actual full-on denialism in them. That's why I made my point that the words in the documents have likely been mischaracterised by Oreskes and Supran et al to insinuate and attribute motives which really weren't there.
I think you really shouldn't characterise Stephen Schneider's views as "the opinion of one person". He was a very well regarded early climate scientist, who was also acknowledged as a brilliant communicator of that science to the public. His (unedited by denialists) quote which I gave is still a very accurate statement on the science and its communication and comprehension by the public. Unfortunately, in this area, he is almost peerless these days. Richard Alley, Katharine Hayhoe, Gavin Schmidt and Michael Mann are really good but, in my opinion, they are not quite at the same level. Schneider could take on a hostile audience of denialists and either defeat them or make their apparently plausible views look as irrational as they really are.
BTW, Phillipe, I actually referred to the CMIP6 models (not the CMP5 ones, as you incorrectly stated I did) running (considerably) too hot. This is not contentious. Ask Gavin Schmidt or any other similarly credentialled scientist...
-
Jim Hunt at 16:35 PM on 10 June 2021DMI show cooling Arctic
Hi WEP,
The "freezing point" of salty sea water is below 0C. As luck would have it DMI "Arctic" temperature has just surpassed that temperature for the first time in 2021, and earlier than the climatology:
https://GreatWhiteCon.info/2021/06/facts-about-the-arctic-in-june-2021/#Jun-09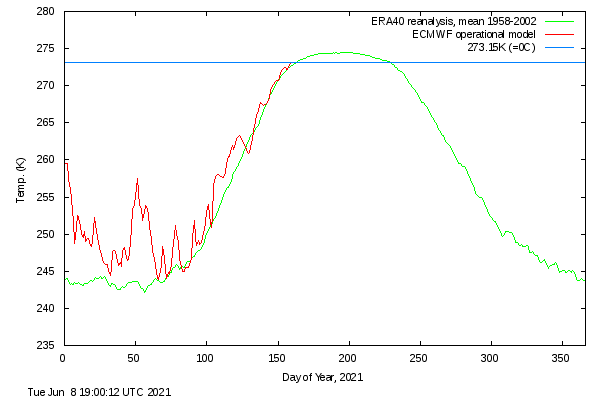
Note that the blue line at 0C is therefore actually above the "melting point" of ice floating in said salty Arctic sea water. Note also that air temperature above the ice won't rise very far above that line for the rest of the brief Arctic summer. -
wideEyedPupil at 14:28 PM on 10 June 2021DMI show cooling Arctic
"car" → "case"
-
wideEyedPupil at 14:27 PM on 10 June 2021DMI show cooling Arctic
"e plate" → "polar"
-
wideEyedPupil at 14:26 PM on 10 June 2021DMI show cooling Arctic
Is the mean ocean temperature and/or mean air temperature at the e plat regions greater than the global mean (1.0-1.1 °C in the car of air temperature) or less than. I take it from this thread that it's the ice mass which determines the air temperature, rather than the other way around, acknowledging there must be a conservation of energy.
-
wideEyedPupil at 14:07 PM on 10 June 2021Antarctica is gaining ice
Edit> "predicted in 1967 that the lower atmosphere and the stratosphere would act in opposite ways: that warming in the former would be accompanied by cooling in the later"
Prev 132 133 134 135 136 137 138 139 140 141 142 143 144 145 146 147 Next


