


 Arguments


Recent Comments
Prev 175 176 177 178 179 180 181 182 183 184 185 186 187 188 189 190 Next
Comments 9101 to 9150:
-
KingInYellow at 19:47 PM on 4 November 2019Ynyslas, western Wales – a place made by climate change
Lookds like I'll be buying this book. Spent many field trips for my degree, forced to go to the beach at Ynyslas (and one surveying Borth bog). :-)
Fascinating location with many rare features.
-
MA Rodger at 17:45 PM on 4 November 2019CO2 was higher in the past
Nyood @89,
You ask that we roll back to your initial comment here, up-thread @83 where you begin by quoting from a talk by Schwark & Bauersachs [slides] quoting from its summary:-
"Massive perturbations of the atmospheric and hydrospheric carbon cycle occurred with CO2 concentration varying between 8-16 x PAL and near PAL over short periods of time." (PAL = Present Atmospheric Level.)
From this you conclude the following:-
"This is quite remarkable, it tells us that a glaciation is capable to absorb even CO2 ammounts of 6000ppm. It does not matter how high CO2 Levels are, a glaciation will happen when the following event occurs:"
Your conclusion is incorrect on a number of levels.
(1) The total climate forcing from 6000ppm CO2 is very roughly 40Wm^-2. There is no evidence to suggest that climate was impacted by such forcings (from any source) during the Ordovician.
(2) According to your cited reference (slides 11 & 14), the period with elevated CO2 significantly above 4000ppm coincides with the Katian, a period of warming.
(3) The period following the Katian sees falling CO2 and falling temperature. The period of high glaciation during the Himantian sees CO2 estimates dropping to perhaps 1500ppm. Relative to our recent ice ages with 180ppm CO2, the Himantian CO2 forcing would thus be perhaps +11Wm^-2 while the relative solar forcing would be -8Wm^-2.
(4) Your assertion @89 is that the major forcing of climate is the tectonic positioning of land over polar regions. Yet there was such land over polar regions throughout the Ordovician when these great swings of climate appear suggesting the climate was being forced by entirely different mechnisms.
I would therefore suggest you have failed to provide any support for your assertion "CO2 is no driver at all."
-
nigelj at 17:05 PM on 4 November 2019CSLDF: Here’s How Science Has Suffered During the First 1,000 Days of Trump
And the administrations attacks on science have implications that cause even more trouble for example here: NOAA’s chief scientist will investigate why agency backed Trump over its experts on Dorian, email shows
-
Eclectic at 05:40 AM on 4 November 2019CO2 was higher in the past
Nyood, the importance of CO2 as a driver of climate, is supported by (A) theoretical calculations [Arrhenius and later scientists]; is supported by (B) experimental evidence; is supported by (C) observational evidence; and is supported by (D) geological evidence. In other words, the mainstream science developed during the past 200 years.
The principle of Occam's Razor is a often a helpful guide to thinking : it is not in itself evidence and it is not in itself a method of proof.
Ockham (or Occam) did not support the cutting off or ignoring of evidence. Newton and Einstein did not ignore evidence. Nyood, why do you choose to ignore evidence?
-
nyood at 02:43 AM on 4 November 2019CO2 was higher in the past
Moderator Response:
"[DB] Please re-read the entire post before commenting. As the post notes, CO2 is not the only driver of climate.
No climate scientist makes any such assertion. So you tilt at windmills of your own building."There seems to be a missunderstanding here, apologies for my bad writing in my initial post if this is the reason for the confusion.
I do not contest that or if CO2 is a sole climate driver. I state that CO2 is no driver at all.
So let me try to give a summary here again:
The theory is radical. The two equilibriums glacial period (high landmass ratio within polar circles,high LPC) vs Hot House Effect (HHE),
are that dominat, they neglect all other drivers. low LPC will result in a HHE no matter what.
General backround HHE forcing is so effective, all other factors do not matter, the warming rate is always rapid, the transition is always within 100 mio years.
The second largest factors that still have significant forcing are all factors that relate to albedo foremost ice albedo (dust, ashes, sea level).Following Orckham we have several situations where neglecting CO2 makes way more sense than assuming any significant forcing.
Ordovician high disparity of CO2 and T. Carboniferus CO2 drop way before temperature (T) drop. Jurassic CO2-T meeting. Cretaceous all time highest discrepancy.
The situations where an explanation for CO2 is needed to justify its assumed forcings, is simply and higly objected by Orckham`s razorblade principle.
So politely i have to say dito: Please re-read my initial post.
Moderator Response:[PS] This is heading way into sloganeering territory. You are selecting only observations that support your ideas and ignoring completely all others. Science does not operate that like. You cannot ignore measured increase in downwelling radiation, conservation of energy, nor explain past climate change with hand-wavy statements that violate physics. If you have a theory that can match all observations, simpler and with better precision than current theory and concordant with laws of physics then by all means publish. Meanwhile, current climate theory is the one that matches Occams razor. No more half-baked sophistry please.
-
One Planet Only Forever at 02:28 AM on 4 November 2019It's methane
Estoma@47,
As a pursuer of improved awareness and understanding, and the application of that constant learning to help develop lasting improvements for all of humanity far far into the future (this planet should be habitable for about 1 billion years), my understanding is that what matters regarding food is:
- the way that food is produced
- the amount of a type of food that is consumed
- the amount of consumption of non-nutritious stuff
- the ability of everyone to get adequate nutrition (and healthy water and healthy air)
The Sustainable Development Goals provide a robustly developed comprehensive basis for evaluating the acceptability of: what has developed, the required types of new developments, and corrections that are required.
And pursuing improved awareness and understanding makes it clear that competition for impressions of superiority measured by popularity and profit have driven the development, and resistance to correction of, the following harmful unsustainable food production and consumption results:
- Desires for unhealthy harmful unsustainable Diets. Many people in supposedly more advanced nations develop a liking for eating in ways that produce many understandably harmful results.
- Desires to over-consume, particularly the over-consumption of meat. The body can only process the protein from about 4 oz of meat in a meal. And a healthy diet does not require that 4 oz helping of meat in every meal.
- The preponderance of over-consumption of non-nutritious stuff.
- The starvation and malnutrition of portions of the population which is a result of competitions for popularity and profit, including the way people are driven to not be as aware and understanding as they should and could be.
A major driver of harmful unsustainable developments is successful disinformation and misinformation marketing (Misleading storytelling). That success is due to people developing an 'interest in trying to Win in harmful ultimately unsustainable ways', combined with developing an easily impressed population that resists improving understanding when that awareness and understanding would require changing developed popular and profitable activity and related perceptions of prosperity or opportunity for personal benefit.
The supposedly more advanced nations have not succeeded at developing populations that pursue improved awareness and understanding. What they have developed is populations easily tempted to be passionately triggered by misleading marketing developed and delivered by pursuers of harmful and unsustainable popularity or profit.
And Social Media and News Media pursuing popularity and profit can be seen to be publishing a lot of misleading stories that do not help improve the awareness and understanding of what is really going on regarding food.
The need to correct many things regarding food production and consumption does not mean 'eliminating those things'. However, the fossil fuel burning related to food does indeed need to be ended, not just be reduced.
With that understanding in mind your concerns are warranted. Reread the article. It will likely become obvious how much of it is sensationalist extremist correction resistant storytelling trying to defend the 'harmful unsustainable creations developed by competition for impressions of superiority measured by popularity and profit' rather than 'helpfulness to developing a sustainable improving future for all of humanity'.
Many popular and profitable developments of competition for status do indeed need to be corrected to develop a sustainable improving future for all of humanity. Reducing climate change impacts is a major, but not exclusive, part of the required corrections. Human activities that create accumulating negative impacts, like the use of fossil fuels need to be ended. Other changes of human activity that would reduce GHG levels in the atmosphere are also helpful, but do not need to be taken to the extreme correction (the elimination of them) that is required regarding fossil fuel use.
-
Estoma at 22:43 PM on 3 November 2019It's methane
Just read the USA today opinion article entitled, "Let them eat steak: Hold the shame, red meat is not bad for you or climate change."
https://www.yahoo.com/news/let-them-eat-steak-hold-090012002.html
My concern was not over whether eating meat was unhealthy or not. It was the claim that it didn't effect AGW because livestock only account for a 2,6% increase in CHG's. I checked a 2017 study in PNAS which verified the 2.6% reduction in greenhouse gases due to other factors ivolved in increasing the amount of plant production.
https://www.pnas.org/content/114/48/E10301
The thing for me is; are we bound to keep producing plant based food under the methods were producing it today? Do we have to keep producing plant based food with the same CHG intensity that were presently producing it at? My family grows 16 acres of organically grown vegetables in field and high tunnels but I'm skeptical that it can be the solution for feeding the world at this point in time.
The study also concludes, "the removal of animals resulted in diets that are nonviable in the long or short term to support the nutritional needs of the US population without nutrient supplementation." My wife and son eat absolutley no meat and I'm what I like to term a "social caravore." If your serving meat I'll partake but that's the extent of my fleash eating activity. I'm 72 and my wife is 69 and my son is 38. Last year when I told my doctor that unlike my friends and I've never had a stress test or an EKG. She ordered up an EKG. The tech came in and did the test. About 15 minutes he popped her head in the door and said, "Your an athlete, arn't you?" to which I replied, I'm a farmer. I'm not sure why our diets would need suplamention. I'm concerned about what I'm reading.
-
Eclectic at 14:36 PM on 3 November 2019CO2 was higher in the past
Nyood @87 , my apologies to you, for my speaking overly-briefly about LIP eruptions.
My example of the Siberian Traps event demonstrated the vast release of CO2 and consequent high temperature rise on Earth. The Deccan Traps event was smaller in effect, and also was complicated by the cooling effect of the Chicxulub asteroid impact.
You are quite right to say LIP events can have a transient cooling effect from the venting of sulphate & other aerosols . . . and also in the much longer term, the exposed silicate rock does gradually draw down the atmospheric CO2 (and hence the lower CO2 will lead to a global cooling, relative to what had gone before).
My essential point with respect to Antarctica, was that a future LIP eruption could be of enough size to produce a major boost in atmospheric CO2 and consequently a major temperature rise for a lengthy period ~ sufficient to melt away the huge Antarctic ice sheet.
We must hope that a major LIP eruption will not occur, for its result could be catastrophic.
The question of Ordovician temperatures and glaciation is a difficult one, for the timing of events & CO2 changes rests presently on low-resolution data. For the relevance to the climate of the modern age, we must rely heavily on the lessons from basic physics.
Moderator Response:[JH] Links activated.
For future reference, when you include a link in a post, please activate it by using the "Insert/Edit Link" feature of the Edit Box.
-
nyood at 06:31 AM on 3 November 2019CO2 was higher in the past
"There are two scenarios where Antarctic ice will disappear:
- (A) the very long term (many millions of years)
as the solar output continues its gradual increase, and
(B) an unexpected Large Igneous Province eruption of CO2,
such as the Siberian or Deccan events. In either of these
circumstances, the South Polar ice would disappear, even if
Antarctica did not move from its present polar position."(A) This is true the sun will warm for a billion years. If and
when this will melt the poles i do not want to discuss
here,interesting question towards the HHE Hot House Equilibrium though.(B) The Deccan Traps caused cooling. wikiDeccan
The polar ice would not disappear, you just make an assumption here. The ordovician
tells us the opposite: Even with levels of 6000ppm a glaciation occurs.
You miss the start of my original post: "This is quite remarkable, it tells us
that a glaciation is capable to ABSORB even CO2 ammounts of 6000ppm"
and you ignore the core of my LPC theory, basicly by just saying "it is so, Antarctica would melt"Please be more carefull with prospective criticism, you can try to go on and find
other arguments pro CO2, like the PETM or the permian-triassic in the past to stay on topic.
Or you can fight my theory and i give you a hint here: i mentioned the "triassic north pole paradox"."The present day crisis involves the small-magnitude warming which will displace around 200 millon people
as sea level rise approaches 1 metre [Kulp & Strauss, 2019]. And probably a much greater size of refugee problem,
coming from storm surge, land salination, and other agricultural adverse effects
(including low-humidity and high-humidity heat waves]."What you are doing here is seen very often, you let someone speak for you.
I would have to read the study, check the sources, check the context
and then come back to you. You have to express your thoughts yourself and use studies to back up your argumentation.First of all what we are seeing here is the common axiomatical acception that CO2 plays a strong role, i would have to argue with Strauss
and confront him with my LPC theory first.
You can check accepted sources like NASA on Sea rise. It will never be that quick that men will not adept let alone react in time.
Furthermore since i see the increase as natural, there is no point to try to change it.Moderator Response:[DB] Please re-read the entire post before commenting. As the post notes, CO2 is not the only driver of climate. No climate scientist makes any such assertion. So you tilt at windmills of your own building.
Relevant to this discussion:
"The evolution of Earth’s climate on geological timescales is largely driven by variations in the magnitude of total solar irradiance (TSI) and changes in the greenhouse gas content of the atmosphere.
Here we show that the slow ∼50 Wm−2 increase in TSI over the last ∼420 million years (an increase of ∼9 Wm−2 of radiative forcing) was almost completely negated by a long-term decline in atmospheric CO2. This was likely due to the silicate weathering-negative feedback and the expansion of land plants that together ensured Earth’s long-term habitability.
Humanity’s fossil-fuel use, if unabated, risks taking us, by the middle of the twenty-first century, to values of CO2 not seen since the early Eocene (50 million years ago).
If CO2 continues to rise further into the twenty-third century, then the associated large increase in radiative forcing, and how the Earth system would respond, would likely be without geological precedent in the last half a billion years."

Off-topic and inflammatory snipped.
-
Eclectic at 13:55 PM on 2 November 2019CO2 was higher in the past
Nyood @85 , thank you for that comment: <"The only thing that will cause earth to leave the glacial period of the cenozoic is when Antarctica will move away from the south pole once again.">
I think it is not controversial that Earth will remain in an ice age for a very long time (ice age defined as Earth having substantial ice at one or both poles).
Even during the warm Eemian period, there was polar ice in the Scandinavian region (at least) plus the huge amount of land ice on the Antarctic continent.
A small rise in temperature (from today's) might fully melt Greenland ~ but that would likely take >1000 years. Still, most of the East Antarctica ice sheet will survive.
There are two scenarios where Antarctic ice will disappear:- (A) the very long term (many millions of years) as the solar output continues its gradual increase, and (B) an unexpected Large Igneous Province eruption of CO2, such as the Siberian or Deccan events. In either of these circumstances, the South Polar ice would disappear, even if Antarctica did not move from its present polar position.
The present day crisis involves the small-magnitude warming which will displace around 200 millon people as sea level rise approaches 1 metre [Kulp & Strauss, 2019]. And probably a much greater size of refugee problem, coming from storm surge, land salination, and other agricultural adverse effects (including low-humidity and high-humidity heat waves].
All this, within the lifetime of children born in 2019.
-
nyood at 10:00 AM on 2 November 2019CO2 was higher in the past
Ok i will try to be more structured with future comments.
You seem to confuse cambrian and precambrian in your criticism. The precambrian is a superaeon before the cambrian era, also called Cryptozoic. Therefore i was talking about the maximum value of a 25% dimmer sun, One of the snowball effects i refered too happend very early in the hadian, the younger double snowball event happen way closer to the cambrian.
<a href="https://en.wikipedia.org/wiki/Geologic_time_scale"> WikiGeoTime</a>
Yes my conclusion statement stays:
The only thing that will cause earth to leave the glacial period of the cenozoic is when Antarctica will move away from the south pole once again.
-
Eclectic at 07:43 AM on 2 November 2019CO2 was higher in the past
Nyood,
your presentation of items is jumbled or durcheinander, as the Germans say. It would be helpful if you could make a succinct summary of the information you wish to convey for this particular thread (and not a Gish Gallop of disparate items belonging to many different threads).
Please note that the Ordovician sun was about 3% fainter than the modern sun. The "25% lesser sun" belongs to the very early life of the planet Earth.
You seem to be suggesting that atmospheric CO2 has no effect on planetary surface temperature. But that goes against all modern science ~ but still, if you are serious in stating it, then you should present your argument in the appropriate thread here in this SkS website.
-
nyood at 05:33 AM on 2 November 2019CO2 was higher in the past
According to this recent study we have a way more accurate view on this issue now:
In the Hirnation Event Summary:
"Massive perturbations of the atmospheric and hydrosphericcarbon cycle occurred with CO2concentration varying between 8-16 x PAL and near PAL over short periods of time." PAL means Present Atmospheric Level.
This is quite remarkable, it tells us that a glaciation is capable to absorb even CO2 ammounts of 6000ppm. It does not matter how high CO2 Levels are, a glaciation will happen when the following event occurs:
Sufficent Landmasses within the Polar Circles (LPC).
Going through all time periods, we can show how decisive landmasses at the polar circles are. Note that the polar circles represent a very narrow area at the north and south borders on these pictures. Greenland todayis a good example as it forms the only northern ice shield, mainly being within the arctic circle, while edging Canada and Russia are not inland iced.
Cambrian warm period, Landmasses in the Polar Circles (LPC): 0%-10%
Ordovician hirnantion glacial event antarctic LPC 100%:
Silurian cold LPC antarctica 90%:
Devonian warming LPC 10% - 40% :
Carboniferus glaciation, Continents drop back to the south pole antarctic LPC: 90%-100%
Permian Cold with late permian transition towards mesozoic Pangea arctic LPC 80% - 100%:
Triassic warming, antarctic PLC 10%-20%, arctic PLC 70% to 90%. only Southern PLC decisive? Arctic inland ice forming reversed with the jurassic? Triassic north pole contradicton.
Jurassic, Landmasses moved away from the arctic cycle. arctic LPC 10%-20%. antarctic LPC 5%-10%.
Cretateous, sea level rise noticeable, deglaciation at its maximum, transition to upcoming glacial period, Antarctica moving south. Antarctic LPC 80%-100%:
Today, Cenozoic glacial period Antarctica resting at the pole once again. Greenland LPC 10% -20%, Antarctica 90%-100% LPC.
With an Ockham attempt i want to make 3 main arguments on why CO2 is not needed and not likely to play any thermal role at all:
1.Faint Sun Paradox,Snowball Earth and the Hot House Equilibrium.
The faint sun paradox is not a paradox. It is another evidence of how strong the terrestial force Ice Albedo is and therefore again the continental distribution.
Even with a 25% lesser sun, Oceans occur,hence the term "paradox".While precambrian snowball effects due to a supercontinent at the south pole, demonstrate the lesser sun effect.
The so called paradox underlines the trumendos forcings of Albedo and it describes the fundamental drive towards a hot house equilibrium whenever the poles are uncovered by land.
This Basic heating Trend that is strong enough to even compensate the faint sun paradox puts CO2 further away from having any thermal influence. This basic heat trend is documented by all the terminations of glacial epoches and even more so in the precambrian, with a barrier where no more heating seems possible.
So we keep in mind that we have a Glacial period during the ordovician to the early silurian, with Co2 levels around up to 6000ppm.
2. Carboniferous CO2 Levels
The carboniferous marks the point where the flora takes an increased influence on CO2 levels.
The late devonian till the middle carboniferus show how CO2 is absorbed while temperatur takes ~90 mio years to "follow".The reason temperature goes down is as usual, the continental drift towards the south pole.
What we eventualy see is a double decline in CO2.
The jurassic-cretaceous meeting of CO2 and temperature speaks for itself.
3. Today,GISS and an estimated CO2 sensitivity of 1,5°C
The uncertenty itself on the CO2 sensitivity after 30 years of research tells us per se that the science is not settled. IPCC on a global warming of <ahref=https://www.ipcc.ch/sr15/chapter/chapter-1/>1,5°C
"Past emissions alone are unlikely to raise global-mean temperature to 1.5°C above pre-industrial levels (medium confidence)"
"1.5°C emission pathways are defined as those that, given current knowledge of the climate response, provide a one- in-two to two-in-three chance of warming either remaining below 1.5°C
or returning to 1.5°C by around 2100 following an overshoot."
GISS actualy does show us a trend towards 1°-1,5°C ~2100 a.d. It is the natural interglacial trend. There is no evidence that our warming period is unique in its rate of warming compared to past medieval epoches
or to the past 11 Interglacials in our ice cores
The lowest model called the "russian model"
What is with Planck and Bolltzmann? my guess is Lüdeckepage19
and others are right, the saturation is already reached at PAL with 1°CSince the Ordovian showed how much CO2 can be absorb in the oceans, acifidication of the ocean due to human emissions might be the bigger threat. Even though most of the CO2 was embeded in limestone, hence the CO2 "starvation".
Moderator Response:[DB] Off-topic snipped.
-
One Planet Only Forever at 10:49 AM on 1 November 2019The Scientific Guide to Global Warming Skepticism
NPR has published a short article and 26-Minute Listen "Fake News Is Scary. Here's How To Spot Misinformation" as part of their Life Kit series of guides.
It is a good supplement to the this Guide.
-
ilfark2 at 02:05 AM on 1 November 2019Tipping Points: Could the climate collapse?
i'd tried to respond the other day, but was having network issues...
As to "sacrifices", general morale on the domestic front was very high during WWII mobilization (see Brinkley's "End of Reform" among many others)... suicides were at record lows, most of the population was better off in spite of rationing etc. Above all, US citizens felt they were part of an important project.
Another note about "sacrifices" in the US.
Much of our emissions come from the unwanted driving of 2 - 7 (e.g. Ford 150) ton blocks of steel and glass in an ellipse every day. The vast majority of the "jobs" this is done for are materially useless.
If we decided to re-arrange society to provide food, shelter, healthcare, education and community, we could get rid of these "jobs" everyone hates (see Graeber's "Bullshit Jobs").
At the least, assuming you want to keep Capitalism, we could have all the nonsense jobs of the Finance, Insurance, Real Estate done from home and convert all those office buildings to housing.
We could also re-arrange society so everyone could walk to work (if most insisted on keeping these useless sectors around).
All this could lead to shorter work weeks and not "sacrifices" in the USA.
Yes it would take planning away from the corporations and put it in the hands of the people, and yes you'd have to have agreement among the voters.
Anecdotally and in polls, everyone knows this way of doing things is ridiculous. Nobody likes their commute. Many don't even like their houses. Everyone is getting sick of the increasing share spent on insurance, mortgages/rent and health insurance.
Look at the PCE, and you'll see, people are spending more in the Financispere (that "70% consumption" number includes healthcare, education and insurance), not on consumer durables.
In terms of political viability, 1919 everyone knew women would never get the vote. In the 1950s, everyone knew African Americans would never go to school with whites; in the 19th century everyone knew children would always work in factories...
Better still, in 2015 everyone knew Medicare for All was fringe looney, $15 min wage was WAY out there, free college a crazy wish, student loan write offs a no way in hell...
So we could get to 0 emiisions in 3 years if we decided to, considering WWII mobilization.
And some people at MIT just published about a new electrochemical CO2 capture mechanism that might be scalable (not sure the time scale though, and it does uses carbon nanotubes which are pretty energy intense), so there may be hope for humans yet.
And we could do it in a rational but most importantly, democratic fashion.
But first a large majority of us have to agree that things could be very different once we decide to make it so.
-
nyood at 00:02 AM on 1 November 2019CO2 levels during the late Ordovician
Hello, i think i stumbled across an "Undead" thread here.
I googled for "co2 levels ordovician" and was linked here, after reading i registered and commented. After a few hours my probably flawed post was deleted. If i type "ordovician" in the SkepticalScience search bar i get 2 related links, exlcuding this thread. I guess it is obsolete, since the ppm values of Seth Young (2009) are considered wrong (5000) ppm.
What kind of makes me sad is that the 2 pages of comments in this "undead" thread will get lost as contemporary witnesses (?). It is interesting to see how the debate was 9 years ago. Aint it possible to merge these threads and maybe make a notification that, at this point people had obsolete data?
Thank you for your patience.
Oh one more thing: The linked tool "tinypick,com" to HTML post graphs is obsolete, it now links to "Photoshop" now which is not free.
Moderator Response:[PS] All threads are live. Most users follow the site with the "comments" menu item which show activity everwhere. However, your comment was deleted because it was a gish gallop and unsupported by appropriate references. Please ensure your comments conform to our comments policy.
-
One Planet Only Forever at 09:21 AM on 31 October 2019Skeptical Science New Research for Week #43, 2019
michael sweet@5,
In addition to the improved understanding, reduced uncertainty, regarding the number of relocation refugees due to climate impacts, the next question is how soon will they need to relocate?
The revised estimate is the number of people who will need to relocate in the 3 decades before 2050. How rapidly the relocation must begin is not certain. How many have to be relocated in each of those 3 decades?
The follow-up is, of course, how many will have to relocate per-decade in the decades following 2050?
And this brings up my favorite "Method of evaluation that needs to be ended - Discounting of future negative impacts". Clearly, having to relocate people in the decades after 2050 is as bad as having to relocate them today or in the decades before 2050. But the discount-rate fans defend being dismissive about future harms all the time. The further in the future, the less it matters to them.
-
michael sweet at 08:11 AM on 31 October 2019Skeptical Science New Research for Week #43, 2019
It has been known for a long time that estimates from satellite data were greatly underestimating sea level rise damage. Climate Central scientists showed in the USA that actual ground data showed greater damage than satellite data. They wrote this new study
I imagine the biggest issue was how to correct the data in countries where ground data was not available.
Bad news for people who live in low areas. Hundreds of millions of refugees! Where will they all go?
-
One Planet Only Forever at 14:48 PM on 30 October 2019Skeptical Science New Research for Week #43, 2019
doug-bostrom,
OPOF is indeed OK.
I also get the point of the new report. But, my personal experience with the issue is less high tech.
This was an issue with stereoscopic aerial photogrammetry. You could fairly easily determine the elevations of what was visible. What was harder to determine was ground level under what was visible from above. Lidar was better, but not if the growth canopy was dense.
-
Doug Bostrom at 13:54 PM on 30 October 2019Skeptical Science New Research for Week #43, 2019
Thank you, OPOF (if that contraction is OK).
After boggling over the figures this morning: "how did I miss it??" It was published about 12 hours after the final sweep for #43. There's no value in being too rigid and it's quite important not least because it'll be scrutinized heavily so I'll just add it now.
But it seems worth a blog post of its own. The paper appears to be bad news given the limitations of foundational SRTM data and the plain, crisp way the authors are able describe those.
Oddly enough I have some experience dealing with SRTM data on a practical level in a way that lends me confidence in the article, that of establishing microwave transmission paths in some challenging locations under tricky requirements and heavily dependent on a DEM with SRTM underpinnings. What SRTM claims is indeed heavily affected by "ground truths" in the form of vegetation and (rarely in our case) structures. It was fairly easy to see the limitations of the corrections applied to our particular SRTM-derived DEM when we checked optical paths as part of the RF path verification process. In our case the main problems manifesting from this had to do with Fresnel interference being a threat where by DEM it shouldn't.
-
One Planet Only Forever at 12:53 PM on 30 October 2019Skeptical Science New Research for Week #43, 2019
I should have linked the NYTs article in mention in my earlier comment.
Here it is: Rising Seas Will Erase More Cities by 2050, New Research Shows
-
One Planet Only Forever at 12:49 PM on 30 October 2019Skeptical Science New Research for Week #43, 2019
This Report should be included in next week's New Research list, but deserves special notice.
New elevation data triple estimates of global vulnerability to sea-level rise and coastal flooding
Credit to the New York Times for reporting on it so quickly.
-
prove we are smart at 11:50 AM on 30 October 201960 Years of Satellite Earth Radiation Budget Observations
I have learnt and still learning / enjoying from this wonderful website. Thanks to all, and i often quote this site for scientific facts. Thanks for the story on our ERB, Doug..
-
scaddenp at 10:51 AM on 30 October 2019Water vapor is the most powerful greenhouse gas
Agree Eclectic - shouldnt be trying to do this in a hurry.
-
Eclectic at 09:04 AM on 30 October 2019Water vapor is the most powerful greenhouse gas
Even lower than 0.2mm
360Gt for 1mm sealevel rise? Call it close to 0.05mm/year.
-
scaddenp at 06:29 AM on 30 October 2019Water vapor is the most powerful greenhouse gas
faerr - you seem to be missing the point that water vapour condenses out. No matter how much water you push up into the atmosphere by any means, the amount of water that the atmosphere will hold is dependent on the temperature. Once saturation is reached, then it just precipitates out. Burning FF does deplete O2 in atmosphere while making that water and I guess it makes an extremely tiny contribution to sealevel rise. (20Gt/y would be about 0.2mm)
-
Philippe Chantreau at 05:11 AM on 30 October 2019Climate's changed before
TVC,
I'll add that I looked at both links in your comment above and can not understand the allusion to "government." One study from Oxford University was funded by the Gary Comer Abrupt Climate Change Fellowship, the other is from the Annals of the Brazilian Academy of Science. Unless you're from Brazil, it would suggest your interlocutor did not spend much time looking at the studies; it would be a pity because the full text is available for free on both of them.
-
TVC15 at 03:58 AM on 30 October 2019Climate's changed before
Again many thanks to both MA Rodgers and Ecletic!
I am also out of my depths with respect to sea-level highstands but I knew that this denier was as well and I knew enough to know that neither of his links disproved anything I stated.
Without this site I would have to return to college and go an additional 2 years with intense focus on the science mythologies of climate change.
Thank you so much for broadening my scientific knowledge! :)
-
trmpttiger3 at 03:16 AM on 30 October 2019Video: Dorian’s Deadly Stall – How Climate Change is Weaponizing Hurricanes
Last year after Hurricane Florence made her deadly stall on the coasts of the Carolinas, I sent an email to the National Hurricane Center asking them if it was time to revamp the Saffir-Simpson Scale since wind speeds are taking a backseat to rainfall and storm surges in the more recent hurricane impacts. They agreed and said that they were indeed working on such a system, but that it may take time for acceptance since the public is so used to the Saffir-Simpson scale. I think we would be better informed on the potential devastation for a hurricane if we knew the estimated rainfall and storm surge.
-
One Planet Only Forever at 00:01 AM on 30 October 2019Skeptical Science New Research for Week #42, 2019
Dawei@3,
The following points may clarify my thoughts regarding "Are global tropical cyclones moving slower in a warming climate?", specific regarding it suporting a claim "...that AGW is likely *not* having an effect on cyclone speed":
- This document attempts to be a follow-up to a previous attempt to refute an evaluation of the full global satellite data set that strives to establish if, with the limited data currently gathered, there is evidence that the rate of movement of cyclones is reducing (they are moving slower), with the related result that the total amount of rain and wind damage from a cyclone event on a location could increase. The most likely cause of such a change of behaviour would be global warming.
- The previous critique of that report by this author resulted in modifications of the original report that did not change the conclusion of the report.
- This new critique appears to attempt a more detailed evaluation of regional 'sub-sets of the accumulated global satellite data'. If the global total data set is only marginally large enough to identify trends in, no sub-set should be expected to be large enough to note a trend. Yet the author seems to want to claim that their identification of 'regional speeding-up of movement after the eye makes landfall (my para-phrasing)' can be identified and is the basis for refuting the global evaluation.
- A lot of rain and wind damage can occur before the eye makes landfall. A recent major damaging storm swept up the coast of Florida without making landfall. And many others have done that. However, Dorian definitely 'sat on top of land for a long time', unlike cyclone movement after the eye finally makes landfall on a large land mass (the type of regional difference that the author seems to want to focus on - and it is possible that Dorian's behaviour above an 'island' would be excluded from the 'regional behaviour after landfall' that the author appears to want to write a story about).
-
Eclectic at 20:21 PM on 29 October 2019Climate's changed before
TVC15 , if I may add a little to MA Rodger's Post #800 :
your denialist friend's 2nd scientific paper quoted, is dealing with a small coastal area at the southern tip of Brazil. The paper specifically says it has not allowed for "tectonic processes" that might modify the results.
When you add in a quantum of uncertainty of timings locally, and at the Vostok site also . . . then really he is making no useful comparison with changes in insolation at 65N [was your 651N a typo?] . . . nor any useful comparison with CO2 levels. And looking at temperature changes over the course of each MIS or interglacial period, you see that each cycle shows its own unique pattern of variations against the grand sweep of glaciation/deglaciation. From "minor" variations in insolation, ocean currents, vegetation changes, etcetera ~ and variation in sea-levels.
Your denialist friend has not shown any evidence to disprove the role of CO2 in connection with planetary surface temperature.
And he seems to have quite misunderstood the papers he quoted : indeed he is wasting the time of the readers.
And tell him, regarding sea-level highstands . . . he's out of his depth!
-
Eclectic at 19:35 PM on 29 October 2019Water vapor is the most powerful greenhouse gas
Faerr @364 ,
it would be an interesting exercise if you made a quick back-of-envelope calculation to give a rough quantification of what you are proposing.
Use the burning of coal/oil at an annual rate of 10 Gigatons of carbon ~ each carbon atom would liberate about 2 atoms of hydrogen (and hence 1 molecule of water vapor. Thus (from atomic weights) . . . carbon 12 grams would produce 18 grams of water.
So, 10 Gigatons of carbon producing 15 Gigatons of water vapor annually (but probably a shade more, allowing for coal impurities and shorter-chain oily compounds). Let's round up to 20 Gigatons of water injected as vapor into the atmosphere, annually. You might have to subtract a bit from that (but how much?) to allow for coal/oil burnt in wintry & far northern regions, where you might expect much vapor to condense and "rain out" rather quickly. And the purer & dryer the coal, the less the water liberated.
But for simplicity, let's stay with 20 Gigatons water = 20 cubic kilometers of liquid water, annually.
I can't vouch for Wikipedia's accuracy, but Wiki says the world's annual precipitation is 505,000 cubic kilometers. In other words, so large that it seems completely justifiable for the scientists to choose to ignore the 20 cubic kilometers. ( I am without coffee, so please check with your own pen & envelope.)
-
MA Rodger at 19:25 PM on 29 October 2019Climate's changed before
TVC15 @799,
It is a rather incoherent rant from your denialist. When you raise the point that only two of the last 8 interglacials were higher than today, he responds "No, it's every single one of them." Yet nothing he presents (his "science") is saying that all past interglacials had sea level above today. Indeed none are saying that global sea level was any different to your assertion (2 of 8 higher).
He presents two references.
Henderson et al (2006) is discussing the timing of the interglacial high stand in the Bahamas during MIS7 & MIS9 (note MIS9 is also one of the 2 past interglacials that were higher than today). They were certainly not considering the height of the peak sea level globally. Even if Henderson et al were discussing the height of the highstand, the isostatic movement of land means a local measure of relative sea level is not a reliable marker of global sea level. Nowhere do Henderson et al mention isostatic land movement. The height of the highstand is not their thesis, the timing is. (Note in the following reference Lopes et al, fig 6 shows the MIS1 holocene highstand 4 metres above present sea level. This would be down to local isostatic movement.)The denialist's second serving of "science" is Lopes et al (2014) is again primerally concerned with dating and having concluded that it is an MIS7 highstand they have identified, do not proclaim that MIS7 sea level has been underestimated (as the denialist concludes). Instead they look to find reason for their highstand being higher than they would have expected, their suggestion being that plate tectonics may be at work.
The denialist then sets out non-controversial CO2 levels from the Eemian. Quite how this links to his final grand "science says" assertion can only be speculated. Is he saying that if CO2 was below 300ppm in the Eemian with its higher sea level, then (sarcastically perhaps) with CO2 at 400ppm today sea level must rise? Strangely, this is the case. The warming resulting from increased CO2 will add perhaps 2.3m/degree C to global sea level, according to IPCC AR5.
-
faerr at 14:06 PM on 29 October 2019Water vapor is the most powerful greenhouse gas
My first post, may it be interesting. I read these two posts concerning water vapor and GHG. My comment is that for the current level of 409 ppm, there must have been a much higher corresponding amount of water vapor emitted by burning fossil fuels (putatively how the CO2 is formed, eh?). Now there is a small exception of coal. However, since a given hydrocarbon has more Hydrogens than Carbon, the worst ratio being Methane 4:1 H:C and thus 2 molecules H2O to 1 molecule CO2 perhaps this will make up for coal then. So given the increase in water vapor, where is this considered? To me it seems that some scientists have oversimplified or missed or ignored it. It is far too easy to follow CO2, but not so easy to follow increased atmospheric water vapor until it enters the water cycle of ecosystem.
-
TVC15 at 12:41 PM on 29 October 2019Climate's changed before
MA Rodger @788
OK so I shared the link showing that only two of the last 8 eight had sea level rise higher than today and this is what he came back with.
No, it's every single one of them.
Here's more science showing sea levels in MIS-7 and MIS 9:
The presence of a sea-level highstand at E180 ka represents a challenge to the idea that Pleistocene climate is driven by summer insolation at 651N. Sea-level is increasing (and therefore ice is melting) when 651N summer insolation is at one of its lowest points of the last 400 ka.
[emphasis his the denier]
Recognition of non-Milankovitch sea-level highstands at 185 and 343 thousand years ago from U–Th dating of Bahamas sediment
https://www.whoi.edu/cms/files/Hende...2006_21693.pdf
Here's another on MIS-7...from your own government....omigod...how can you debunk your own government?
Thermoluminescence (TL) and electron spin resonance (ESR) ages from sediments and fossil shells point to an age of ?220 ka for the end of this marine transgression, thus correlating it to MIS 7 (substage 7e). Altimetric data point to a maximum amplitude of about 10 meters above present-day mean sea-level, but tectonic processes may be involved.
https://www.ncbi.nlm.nih.gov/pubmed/25590701
Sucks to be you.....you can't scream, "Oil company funded research!"
The last interglacial (LIG; also known as the Eemian or MIS5e) lasted from 129 to 116 thousand years before present (ka).
If we look at EPICA Ice Core Data for CO2 levels in ppm, we find:
YBP ..... ppm CO2
116,501.... 262.5
117,750.... 267.6
118,649.... 273.7
119,672.....271.9
120,382.... 265.2
121,017.... 277.6
122,344.... 272.1
123,070.... 276.4
124,213.... 268.7
124,257.....266.6
124,789.... 266.3
125,081.... 279.7
125,262.... 273.0
125,434.....277.1
126,347.....273.7
126,598.....267.1
126,886.... 262.5
127,132.....262.6
127,622.... 275.3
127,907.... 275.6
128,344.... 274.0
128,372.....287.1
128,609.....286.8
128,866.....282.6
129,146.....264.1
129,340.....263.4
129,652.... 257.9
129,736.....259.0For a brief period, CO2 levels were in the 280s ppm CO2, but for the most part below that and the average is only 271.7 ppm CO2.
That, is Science, and Science says sea levels are going to rise and you can't stop it.
I've never stated that sea levels are not going to rise so him tossing that in at the end is a non sequitur.
I don't think that either link he posted is refering to sea-levels being higher than the two interglacials you mentioned in 784. (only two previous interglacials that saw such sea levels - the Eemian (MIS-5e) and 400,000y bp the MIS-11).
-
Doug Bostrom at 06:49 AM on 29 October 201960 Years of Satellite Earth Radiation Budget Observations
Heh, this article was written in extreme haste when I realized we were about to ignore an important birthday. And the author is a mile wide and an inch deep, with shoals. :-0
Yes, moving the decimal to the correct position and using 2013 figures, our own power delivery is about 18TW.
Yup, wrong on total imbalance expressed as instantaneous power. Digging on this, I find I made exactly the same mistake as Greg Easterbrook, so at least I'm in superior company. Details of how to go wrong here: How much extra energy are we adding to the earth system?
-
jabell at 06:02 AM on 29 October 201960 Years of Satellite Earth Radiation Budget Observations
It is definitely worth memorializing the beginning of observational (satellite) measurements of Earth’s Radiation Budget (ERB). A couple of caveats about the information in the explanatory background on the ERB (that have no effect on the overall message of the article) seem in order. The first has to do with the present energy imbalance. If we take this as 0.8 watts per square meter, then the total over the Earth’s surface (about 5 x 10^14 square meters) is about 400 terawatts, not “well over a thousand terawatts”. Second, the International Energy Agency has the total energy used by all human activities now nudging 20 terawatts, not 1.2 terawatts from “human manipulation of energy from all sources”. The comparison of 5% from human activity is negligible, but not as trivial as the article implies. It seems important, in communicating about climate science and climate change, to make sure these kinds of details are correct, so readers can be confident that the rest of the material is also trustworthy.
-
Doug Bostrom at 03:39 AM on 29 October 2019A small electric plane demonstrates promise, obstacles of climate-friendly air travel
Further to Rob's remarks, as I read it the objective of hybrid aircraft is to employ batteries and electric assist to reduce fuel guzzling during take-off and a portion of ascent.
JATO: particulate emissions from aviation boost rockets as an elliptical geoengineering scheme? Hmm. Maybe we'd best remain silent on this. :-)
Leisurely aviation: go to ntrs.nasa.gov, plug in "dirigible" and "airship" as search terms, sort results in ascending order and one sees a picture of a world that did not happen, with airships occupying the top slot in commercial aviation. However it wasn't so much problems with lifting gas that truncated this path as issues with control of the vehicles in inclement weather, particularly during docking and while at dock.
-
TVC15 at 03:14 AM on 29 October 2019Climate's changed before
Eclectic @796
MA Rodger @ 797
Thank you both so much! I learn so much everytime I come here and post the weird things that denialists state.
Thank you both so much!
-
One Planet Only Forever at 01:52 AM on 29 October 2019Skeptical Science New Research for Week #42, 2019
Dawei@3,
Doug has provided a good reponse regarding the section the Report is listed under.
I will provide the following in an effort to respond to the other parts of your comment.
The abstract ends with the following: "The relationship between the slowdown of tropical cyclones and anthropogenic warming is therefore not apparent and the relevant potential increase in local rainfall totals in the future warming climate is suspicious."
That appears to be inconsistent with claiming "...that AGW is likely *not* having an effect on cyclone speed".
My comment was pointing out that, in addition to reading the complete abstarct, reading just a little further raises even more doubts about the claim "...that AGW is likely *not* having an effect on cyclone speed".
Along the lines of Doug's point regarding the category for the Report, claiming to doubt a conclusion of another report that has already been corrected without the corrections affecting the conclusions seems to indicate that serious skepticism should be applied regarding the claims this report appears to try to make. The author is not refuting the revised conclusion of the other report. They appear to be trying to tell a different story based on their personal interpretations of selective information.
-
GwsB at 20:33 PM on 28 October 2019CO2 effect is saturated
Three weeks ago there was a congress in Amsterdam of Flat Earthers. I don’t believe the earth is flat. Neither do you. But what do you reply if your child asks “Why isn’t the earth flat?” Do you say “99.9% of the scientists say that the earth is a ball floating in space.” What if your daughter persists, and asks “But why is the earth a ball floating in space?”
I think I can give a sensible answer to that question. If I am asked whether reducing CO2 will have an influence on the climate I am not able to give convincing arguments why a reduction at the present level makes sense.
The Zhong&Haigh (2012) article is well written and convincing, but if one reads it a second and a third time one realizes that the paper contains no arguments. Figure 2 is on a scale which makes it impossible to see the effect of the shoulders and wings of the absorption around 665/cm. The vertical scale covers 12 orders of magnitude. There is no indication of the calculations performed to yield the plots in Figure 6.
Figure 3 suggests that between 750 and 1000/cm the IR radiative flux emitted at TOA follows the Stefan-Boltzmann curve for 280K and between 600 and 750/cm the S-B curve for 220K. This is a model-generated curve but quite close to the observed curve IRIS spectrum dd May 5 1970 over the Sahara at 12.00, see
https://disc.gsfc.nasa.gov/datasets/IRISN4RAD_001/summary
This observation was made almost fifty years ago. Where can one find more recent plots? A clear difference between 1970 and 2019 would be evidence that there is as yet no saturation.There is a nice explanation of molecular radiation and collisional lifetime (which distinguishes elastic and non-elastic collisions) at https://noconsensus.wordpress.com/2010/08/17/molecular-radiation-and-collisional-lifetime/
DJ Wilson and J Gea-Banacloche (2012) Simple model to estimate the contribution of atmospheric CO2 to the Earth's greenhouse effect (Am. J. Phys. 80, pp 306-315) presents good quantitative arguments for the greenhouse effect of CO2. Does anyone know of more recent literature, in particular on the topic of saturation?
If so that might help me convince my daughter that reduction of CO2 emission makes sense. -
MA Rodger at 20:08 PM on 28 October 2019Climate's changed before
TVC15 @795,
Your denialist runs through quite a complex argument, so probably well rehearsed but it is not very concerned with reality.
The talk of the decoupling of global temperature & CO2 is probably going back hundreds of millions of years. There is an SkS post on this here (& probably other too) but I would punt the ball back into the denialist's court and ask which era they are talking about. They probably have some ancient denialist graph showing CO2 & temperature less than strongly coupled but addressing specific eras is the way forward, not trying to debunk some bogus lines on a graph scribbled out years ago, (usually with temperature a parody of this Scotese graph).
The denialist presumably dismisses the tight coupling of CO2 through the last million years of ice ages with their "slight increase that follows a warming period". Then they plunge into the bold assertion that denies temperatures have been increasing over recent decades. If they require it to be "verified" they obviously haven't understood how thermometers work, how calendars work (winters and shorter, summers longer under AGW) and a whole ot more. This is village idiot talk.
Their final run is in arguing for there being other causes for the temperature increase which is exceptional over thousands of years but that they deny exists. It would probably be better responding that the cause of such an exceptional global temperature change requires a cause, not just a list of mechanisms that impact the climate system. So if they want to invoke rain or humidity or clouds, what has set these off to cause this exceptional warming now?
One of those they point to as a potential cause is, of course, manmade. CFCs & HCFCs would have been as bad as CO2 at forcing AGW if they hadn't been banned. There is also albedo which could be forced by land-use change as well as cloud (& there are denialists that have argued this as the cause of warming, although measured albedo shows nothing to support such an assertion).
Their final talk of "questions that ought to be asked" could be another approach to a reply - what questions? Be specific!!
-
Eclectic at 19:02 PM on 28 October 2019Climate's changed before
TVC15 @795 ,
I am assuming that you are dealing with a single denialist who tries to bury you under a blathering gush of Gish Gallop.
IMO, best to challenge him on just a few points of his gush :-
(A) Planetary surface temperatures show a good correlation with the *combined* effects of changes in solar output and variations in atmospheric CO2 level. Examples: look at the cooler/warmer periods of the Ordovician Age and also the Carboniferous Age, as well as the Cenozoic recently. Sometimes the CO2 rise was caused by the temperature rise, and sometimes (such as the last 150 years) the CO2 rise preceded & caused the temperature rise.
[to him] "Question: Why are you apparently unaware of all that paleo evidence?"
(B) We know the surface temperature is rising, because [i] satellite evidence shows land and sea ice is melting, and [ii] satellite and tide-gauge evidence shows rising sea level, and [iii] thermometers confirm the rising temperature (a rise now of almost 1 degree since reliable general measurements commenced).
[to him] 'If you cannot understand such basic science, then your "can't feel it" opinion is worth nothing.'
(C) The scientists have looked into all sorts of factors that might influence climate (ranging from clouds and cosmic rays, to greenhouse gasses and albedo changes).
[to him] "If you yourself have discovered a vitally important factor they overlooked, then [i] tell us what it is, and [ii] write to the National Academy of Sciences, and explain to them what morons they all have been for missing such a basic factor, and (iii) start planning how to spend all the Nobel Prize money that you will be awarded from the astounded and delighted Nobel Committee ! .....And good luck with that, Mr Unappreciated Genius."
(Doubtless he will start shifting goalposts, and/or go into strawman arguments, and/or go into Conspiracy Mode.)
.
-
Doug Bostrom at 15:21 PM on 28 October 2019Skeptical Science New Research for Week #42, 2019
In the abstract of the paper Dawei mentions, we read this:
A recent astounding study reported a 10% slowdown in global tropical-cyclone translation speed over the past 68 years (1949–2016) and implicitly related this to the weakening of tropical circulation forced by the anthropogenic warming. It thereby suggested that it might result in more local rainfall totals in a warming climate. However, here this study shows that no robust and significant observational and modeling evidences reveal that they are.
The paper goes on to discuss the author Chan's reasons for disagreement with the paper he cites. Both papers are discussing effects of global warming, Chan in a slightly more histrionic but otherwise standard format. Finding a negative result does not vanish the topic, so to speak.
-
Dawei at 13:37 PM on 28 October 2019Skeptical Science New Research for Week #42, 2019
One Planet, I'm not sure what point you are trying to make. The paper is clearly intended as a counter to the claims of cyclone slowing. The authors argue there's no evidence for it, so this paper shouldn't be listed in a group called "Observation of global warming and global warming effects" (its whole purpose is to argue that the case for this being one of its effects is weak to non-existent).
-
TVC15 at 12:56 PM on 28 October 2019Climate's changed before
Here's some more climate change denier blather I came across today.
When you are using a complicated explanation to detail why something is happening, or is believed to be happening, you have almost certainly overlooked a much simpler reason for it.
In the case of CO2, we already know from the fossil record that levels have been much higher in the past and also lower.
During periods of low atmospheric CO2 levels, surface temperatures have been significantly higher.
Likewise, during periods of very high CO2, temperatures were cooler than we are experiencing today.
In fact, the only consistent relationship between CO2 and surface temperature seems to be the slight increase that follows a warming period as the oceans release stored CO2.
So, when doubling the atmospheric CO2 level results in a claimed surface temperature change that is essentially imperceptible to the senses, the question becomes, how do we know the temperature has actually increased.
Assuming an increase in surface temperature can be verified (good luck with that), the next question is, is it really caused by elevated CO2 levels and to what degree?
What other factors are in play and, most importantly, what other factors cannot be measured and their influence accounted for?
On the issue of cloud cover, NASA essentially punts.
They admit that past cloud cover was never measured in any meaningful way and that measuring cloud cover, even with the technology available today, is more or less a scientific fool's errant.
Of course, the problem is that we can't account for the effect of CO2 unless we also account for the effect of cloud cover, then and now.
I could go into refrigerants in the stratosphere, the albedo effect, rain and humidity and other factors that are clearly ignored by the settled science crowd, but why bother.
CAGW is a religion dressed up as a pseudo science trying to pass itself off as legitimate science.
The reason questions that ought to be asked are not asked is because we would have to admit that the data is insufficient, unavailable and probably unknowable.
There are so much illogical claims here I don't know where to start!
-
One Planet Only Forever at 11:34 AM on 28 October 2019Skeptical Science New Research for Week #42, 2019
Not far below the abstract the following is stated. Note the use of "may" regarding claims that are implied to support the suggestions of this paper.
"Recently, Kossin (2018a) reported that the global tropical-cyclone translation speed over the 68 year period 1949–2016 was slowing down by 10% and implicitly related this to the weakening of the tropical circulation forced by the anthropogenic warming (Held and Soden 2006, Vecchi et al 2006, Vecchi and Soden 2007, Coumou et al 2015, He and Soden 2015, Grise and Polvani 2017, Mann et al 2017). He thereby suggested that it might result in more local rainfall totals in the warming climate, particularly over land. Such findings and implications have been widely interpreted, broadcasted and forwarded by various social media and sectors since then (Guglielmi 2018, Patricola 2018, Shultz et al 2018). Unfortunately, his study was imprecise and questioned. The early work of the present study pointed out two deficits in his calculation of tropical-cyclone translation speed and an author correction had been made after (Kossin 2018b). Although the correction shows no material impact on the key conclusions of the original study on a global scale, it has a number of varying effects on regional scales. Such varying effects are more apparent for tropical cyclones over land. On top of that, this study further suggests that the slowdown of global tropical-cyclone translation speed stated by Kossin (2018a) may not be a real climate signal or it may be exaggerated, which is consistent with what Moon et al (2019) and Lanzante (2019) commented coincidentally."
-
Dawei at 08:40 AM on 28 October 2019Skeptical Science New Research for Week #42, 2019
The abstract of "Are global tropical cyclones moving slower in a warming climate?" concludes that AGW is likely *not* having an effect on cyclone speed. (Betteridge's law should have been a clue).
-
MA Rodger at 19:56 PM on 27 October 2019Video: Dorian’s Deadly Stall – How Climate Change is Weaponizing Hurricanes
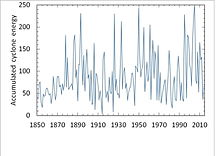
The difficulty with arguing about tropical cyclones with trolls is two-fold. Firstly global-wide records only stretch back to 1970 meaning that the increase in ACE 1970-on, a NH phenomenon (see bottom graph in link @6) which is a statistically significant decadal rise of 5%(+/-2% - 2sd), is too short given the wobbles evident in the one long record we do have (the N Atlantic).
Secondlly, where records are of a useful length (ie the North Atlantic graphed above), their reliability of the data back in the day of sailing ships and quill pens puts the trend (with its narrower statistical significance) into doubt.
Mind, I see one poorly discussed phenomenon that demonstrates we probably are stoking up a whole heap of trouble with future tropical cyclones. The 2017 North Atlantic season started very very quietly. Then from late August through to October, it went crazy, smashing all records for ACE over that period. Eight storms, all hurricanes, six of them major.

And it looks like we were not far off a repeat in 2019. Again a very quiet start then come the end of August the storms start ramping up. ACE for September was well short of 2017 but otherwise head-&-shoulders above recent years. Unlike 2017, only four of the nine storms wound up into hurricanes but three of those managed to reach major categories.

As it is with rain data, tropical cyclone activity is very lumpy which makes identifying trends very difficult - very difficult but not impossible. And, paraphrasing the troll @2 (although snipped) "wishing it weren't so doesn't have much effect!"
-
agno at 19:11 PM on 27 October 2019Using fallacy cartoons in a quiz
I know this post is a bit old now, and I hate to split hairs, but, I think that you have misunderstood some of John's material.
As much as I love the idea of this toolkit, and am grateful to you for making it available, (I thought about using it at a Transition Town Meeting), I think it needs some small corrections.
Logical Fallacies are a subset of Science Denial Techniques. You have listed all of the Science Denial Techniques as a "Taxonomy of Logical Fallacies", not just the Logical Fallacies.
Fake Experts, Fake Debate, Impossible Expectations, Moving the Goalposts, Cherry Picking and Slothful Induction, are not Logical Fallacies.
Thank you again.
Prev 175 176 177 178 179 180 181 182 183 184 185 186 187 188 189 190 Next


