


 Arguments


Recent Comments
Prev 1860 1861 1862 1863 1864 1865 1866 1867 1868 1869 1870 1871 1872 1873 1874 1875 Next
Comments 93351 to 93400:
-
michael sweet at 06:08 AM on 18 March 2011Maize harvest to shrink under Global Warming
Johnd and Charlie, Perhaps the two of you are not familiar with the peer review process. This paper was published in Nature, one of the most respected journals in science. The peer reviewers have concluded that simple issues like you have raised are not germane to this discussion. If you have a problem with that you need to produce actual analysis of data. Idle hand waving and saying "I doubt it" for no particular reason is not an argument against a paper published in Nature. Provide links to data supporting your extraordinary claims or put in the effort to analyze the data yourself. -
L.J. Ryan at 06:06 AM on 18 March 20112nd law of thermodynamics contradicts greenhouse theory
les@621 Like I said C can equal A, but C cannot equal D. -
GFW at 06:05 AM on 18 March 2011And so castles made of sand fall in the sea, eventually
Unfortunately, the idea of buying future coastline property doesn't work. Once the melt accelerates enough to cause the current coastline to indefensible, sea level rise is likely to be a multi-century process, with a "new" coastline every decade or so. -
Chris G at 06:02 AM on 18 March 2011Examining the impacts of ocean acidification
Mike G, Thanks for the explanation. I recall some back of the envelope calculations that we could correct for extra CO2 by adding carbonate compounds to the ocean. They calculated that if we were to mine all of the cliffs of Dover, grind it up, and disperse it through the world's oceans, that would neutralise the extra CO2, but I can't recall whether that was at present levels of CO2 or a doubling, or what. In any case, no, that doesn't happen in nature, at least not at the rate required to accommodate the rate we are adding CO2. Ah, found it. Not exactly what I remembered, but the point remains. http://www.realclimate.org/index.php/archives/2009/10/an-open-letter-to-steve-levitt/ Gavin's comment #9 Gavin's link is broken, but likely is related to Ocean acidification due to increasing atmospheric carbon dioxide Page 37 "To counteract the changes in acidity caused by today’s ocean uptake of roughly 2 Gt C per year (IPCC 2001) would require roughly 20 Gt CaCO3 per year (Caldeira & Rau 2000), which, for a limestone layer 100 m thick, would require the removal of roughly 60 km2 each year." "Furthermore, limestone does not dissolve in surface waters, so additional processing, and energy, would be needed (Kheshgi 1995; Rau & Caldeira 1999)." and "Although the vast amounts of carbonate minerals needed may make this approach infeasible at the scale required to mitigate global changes in ocean chemistry, this approach is widely used by salt-water aquarists to promote coral growth in fish tanks. Thus, it might be possible to use alkalinity addition to save specific coral reefs (Rau & Caldeira 2002), but such ideas have never been tested in situ and therefore must be regarded as speculative." Speculative indeed. -
les at 05:44 AM on 18 March 20112nd law of thermodynamics contradicts greenhouse theory
"till they do." - oops, sorry should be "till the sum of Ds = A"... Or do you think it's possible that a significant number of photons will bounce around the box for ever without leaving? -
DSL at 05:43 AM on 18 March 2011Peer reviewed impacts of global warming
"The scientific community almost unanimously agrees Earth is in a warming period as part of the natural cycle." Nope. That's the thing: according to identified "natural" cycles, we should be heading for an ice age. We're not. During the last solar minimum, average global temp increased. Shorter-term natural cycles--El Nino/La Nina--do not add heat/energy to the atmosphere; they move it around. The scientific community almost unanimously agrees that Earth is warming due to increased CO2, CH4, and H20 lengthening the path of infrared radiation as it exits the system. It's like a detour because of road construction: same number of cars entering and exiting the system, but more time is spent driving (and perhaps dropping by the Arctic Ice store on the way to melt a few kilos). As for No. 2, the more serious debate is between those who have various opinions on feedback mechanisms (particularly albedo in the form of land use, clouds, snow cover, etc.). That CO2 is a path lengthener is hardly seriously debated anymore (except here, by a handful). So as the drivers drive home via the detour, how many wrecks will they cause, causing more detours? As Arctic sea ice is diminished, how does that affect planetary albedo? As the temp rises, how much more water vapor (a GHG) does that put into the troposphere? No. 3: It seems that way. Life is persistent, but the speed of environmental change can't exceed the speed of evolution, or life will suffer. Our ability to adapt--as a species--is wicked. But there are seven billion of us living in a pretty complicated and sketchy system of food, water, shelter, and energy distribution. Minor disruptions, like the Japanese earthquake, cause thousands of deaths. It's easy to say that increased warmth will lengthen the growing season, but the person saying it usually hasn't taken into account everything else happening simultaneously: migrations, economic and political considerations, disease adaptation, insect (both as pollinator and pest) adaptation, changes in precipitation patterns and intensities, and all the interconnections between these elements. Your friend is right: Oil is good -- how we use oil . . . well that's another question. -
Alexandre at 05:41 AM on 18 March 2011Peer reviewed impacts of global warming
Gairzo #94 Asking questions is good. I don't think you summed up well the current scientific understanding about GW. About your conclusion #1: there are many natural cycles known to science. None of them explain the recent warming (over the last half a century or so). For mor detail, you can see these posts here (among others): It's a natural cycle It's the sun So, the scientific consensus and the evidence do not point to natural causes. I think that kind of covers your #2 too. Your #3, which refers to this post specifically, is basically correct, although I'd elaborate more on the "planetary survival" bit. Let's say we'd have a lot of negative impacts on both human societies and ecosystems. for a more comprehensive picture ov the available evidence, there the Scientific Guide to GW Skepticism too. I hope this gives you a starting point. Feel free to ask. Oh, and welcome to SkS. -
les at 05:41 AM on 18 March 20112nd law of thermodynamics contradicts greenhouse theory
619 Ryan - hint: the walls are reflective. All the photons which do D (i.e. don't escape when they hit the front window) will bounce around (lets say B') till they hit the window again and are either C' or D', then B''/C''/D'', B'''/C'''/D''' etc. till they do. -
Bob Lacatena at 05:39 AM on 18 March 2011One of the best climate change ads I've seen
6, ClimateWatcher, And it has to be sold because: 1) Many (most?) people are too shortsighted to look or think beyond their most immediate needs 2) There is a lot of money being spent on the foolish idea that climate change is not a problem. 3) There is a horde of people who have, for various reasons, fallen for the denial meme, and so tout that particular line even when they aren't getting a big check from the fossil fuel industry. The quiet implication that climate change needs to be sold because it's not real is as invalid as it is offensive. Regardless of the reason for the "sale," people need to prompted into waking up and doing something, by a variety of means, and the fact that this particular effort is annoying to deniers tells me that it is an effective tool. -
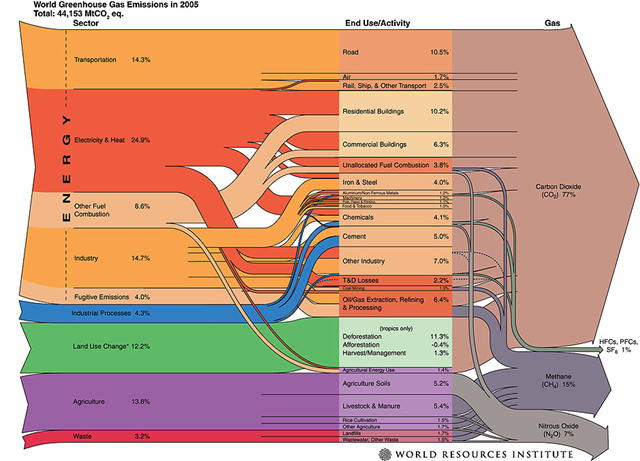
Alexandre at 05:07 AM on 18 March 2011Those who contribute the least greenhouse gases will be most impacted by climate change
It's a striking picture. I understood IEA data include only fossil fuel combustion (someone correct me if I'm wrong). For greater accuracy, I think the CO2 emission figures should include all emission sources, and all GHG. I don't think the overall picture would change much, but there could be some notable local differences. After all, fossil fuels are only about half of the picture. -
Gairzo at 04:59 AM on 18 March 2011Peer reviewed impacts of global warming
I'm just a screenwriter living in Burbank and am having the debate with what are obviously right-wing, John Locke-ish, extreme deniers. I made the mistake of saying there wasn't a peer reviewed study denying global warning. So these climate change deniers verbally spanked me and sent me to a couple websites. After a short review, it was clear few of these sites denied warming was occurring but blamed it on the natural cycle, the sun etc. Please try and educate me on the general conclusions I reach from the twenty or so articles studies, charts, I've read--in other words please tell me if my conclusions have any merit: 1.) The scientific community almost unanimously agrees Earth is in a warming period as part of the natural cycle. 2.) The debate is between those who believe the spikes in temps, ice melting, oceans rising, etc.--the "negatives" seen in the last 150 years--are due to human activity, and those who claim human activity cannot possibly affect such forces that manifest over hundreds of thousands of years. 3.) From what I read, the "negative" studies far outweigh the "positive" studies and our planetary survival could well be in question if we don't act now. My friend sent me an e-mail extolling the virtues of the free market and the horrible economic impact transitioning to alternative energies would be. He ended the e-mail in big red letters...OIL IS GOOD. I don't think he'd be convinced if penguins moved next door. I won't try. I just want to know if a non-science guy like me was generally reading the data accurately. Forgive the intrusion on your discussion, just though I'd ask.Moderator Response: [Daniel Bailey] Let me first start off by saying (in my best Ed McMahon imitation): "Welcome to Skeptical Science!" Second, you're not intruding: you're a guest here and guests get treated as valued persons (until some outwear their welcome then they get the ol' Heave-Ho!). Third (before we get to the main act), you have the right of it. Some will never be convinced of Christ's 2nd Coming unless they can stick a finger in His side... With the opening fanfare done, let's dig in, shall we?There is an immense amount of reference material discussed here and it can be a bit difficult at first to find an answer to your questions. That's why we recommend that Newcomers, Start Here and then learn The Big Picture.
I also recommend watching this video on why CO2 is the biggest climate control knob in Earth's history.
Further general questions can usually be be answered by first using the Search function in the upper left of every Skeptical Science page to see if there is already a post on it (odds are, there is). If you still have questions, use the Search function located in the upper left of every page here at Skeptical Science and post your question on the most pertinent thread.
Remember to frame your questions in compliance with the Comments Policy and lastly, to use the Preview function below the comment box to ensure that any html tags you're using work properly.
To sum up: "You are correct, sir!" Dig in your heels, brandish the Skeptical Science sword of truth & shine the Lantern of Peer-reviewed Science into the dark corners of un-physical land, where up is down and down is up & consequences be damned...
Anyway, stop back if you have questions; just put them on the most appropriate thread. If needed, direct them at me (I'll see 'em). Ciao.
-
Philippe Chantreau at 04:56 AM on 18 March 2011Skeptical Science nominated for Climate Change Communicator of the Year
My vote is in, no doubt as to who my favorite are :-) Keep up the good work John. Rob, the "athleticism" at WUWT is really questionable. One has to peruse through that pathetic thread in which they slap each other on the back after some guy verified that CO2 does not deposit at -70 degrees in Earth' atmosphere. This, of course after repeated attempts by some who knew better to make the general population of the site understand the phase diagram. It's painful to watch such collective idiocy in action. These are the same people who go on accusing scientists of fraud when they clearly don't have the means to even begin to understand what the scientists are doing. If there is any "athleticism" at WUWT, it's barely at 8th grade level. -
Charlie A at 04:43 AM on 18 March 2011One of the best climate change ads I've seen
It would be even more effective if one of the polar bears was in danger of being sucked into the whirlpool. -
L.J. Ryan at 04:41 AM on 18 March 20112nd law of thermodynamics contradicts greenhouse theory
Tom Curtis@615 1. A = C ok 2. C can not equal D without violating the 2nd law. Otherwise you have doubled your light/energy with a mirror and a filter. Light can not brighten due to it's own reflection. If your box was fully enclosed such all surfaces are reflective save two small aperture. One aperture to receive light the second to radiate light, do you really think the light/energy will increase beyond it's input? Now change your perfectly reflective interior to one with an emissivity of 1 (black body). Do you believe C will be grater then A. Again no. Black body emission represent the maximum conferred energy for light input. Therefore, a surface with emissivity less then one will NEVER radiate more then it's black body equivalent...regardless of it's own reflection or it' own re-radiation (back radiation). -
shoyemore at 04:34 AM on 18 March 2011Maximum and minimum monthly records in global temperature databases
Charlie A #47, You can read some of the "Further Reading" which provide further detail of the "1/n model" for a random incidence of records. Random incidence is a hypothesis, not an assumption. As a hypothesis, it is certainly rejected by the data. Hence the excursions shown on the charts must be concluded to be due to extrinsic factors. A second (composite) hypothesis that temperatures changes up to mid-century are due to naturally occurring factors, and changes thereafter are due to human-induced factors, is also not rejected by these data. In that usual scientific sense, that is support. Confirming what we already know is quite boring, but most scientific experiments and analyses end up that way. However, these data may say something about the "cooling" that allegedly took place from the mid 1940s to mid 1970s, when greenhouse gas heating kicked in. These data seem to say that 1945 to 1956 was rather a slowdown in the warming trend (no coldest months noted, but several months that ranked in the top 10, other than 1). It also seems to date the end-of-century warming to the end of the 1950s, rather than the 1970s. Those are the only departures from the conventional picture presented by the temperature data analysis, and warrant further examination. -
Charlie A at 04:31 AM on 18 March 2011Maize harvest to shrink under Global Warming
The problem with simplistic extrapolations such as "Roughly 65% of present maize-growing areas in Africa would xperience yield losses for 1 °C of warming under optimal rain-fed management," is that it assumes farmers are dumb. Farmers in different regions and different climates plant and harvest at different times of the year. It is unreasonable to assume that planting and harvesting times will not change. -
johnd at 04:29 AM on 18 March 2011Examining the impacts of ocean acidification
dhogaza at 03:40 AM, "warming winters" is the equivalent of " declining alkalinity". "Hotter winters" is a more appropriate comparison for ocean acidification. -
johnd at 04:18 AM on 18 March 2011Maize harvest to shrink under Global Warming
Rob Painting at 18:27 PM, whilst you might see some take-home points, I see only bring-along points which is what my very first comment on this thread indicated. Regarding your comment of uncultivated areas, perhaps further study of the information able to be extracted from the maps might lead to such areas being better described as areas beyond those already considered marginal. We must see this study for what it is. The authors are not those people who conducted the original trials. They have been able to utilise some data yielded by the trials but I expect that other data would have been considered propriety by the trial managers, and as such their, the trial operators, take-home points likely to be somewhat different to what this study could allow. The reason this is likely comes with understanding what trials such as these set out to achieve. The development of new varieties is an ongoing process as various traits are sought to be refined or developed. Developing varieties that allow cultivation to be extended into areas now considered unsuitable or marginal is as much an objective as increasing yields under existing conditions, and it appears that the former was one of the primary objectives of the original trials. Not all varieties live up to expectations when field trialled, some show negative responses, others none, others positive responses to varying degrees. Whilst we don't know how many different varieties were trialled or how each performed, what is indicated in this study is that the data is all in, in other words, the data includes the failures and the successes. This is where those conducting the original trials will most likely be taking home something different to what this study allows. They will have identified, and quantified, those varieties that responded positively to the trial conditions. It will be those such varieties that extend the ongoing development in plant genetics that allow productivity to keep pace, or even out-pace change as it occurs. -
Mike G at 04:08 AM on 18 March 2011Examining the impacts of ocean acidification
Ken, you're forgetting the significance of the biological pump and the the effects of depth/temperature on CO2 solubility. Unlike heat, the pH and dissolved inorganic carbon patterns aren't determined by the mixing depth or diffusion rates. -
Mike G at 04:03 AM on 18 March 2011Examining the impacts of ocean acidification
@8 WheelsOC- In oceanography, alkalinity and pH are two distinct parameters. Alkalinity is essentially the measure of the buffering capacity of seawater. Usually in the case of ocean acidification we're talking specifically about carbonate alkalinity, which measures the amount of buffering provided by carbonate and bicarbonate ions. Rest assured that when oceanographers are talking about the acidity of the sea, we use pH just like everyone else. The confusion comes from the fact that seawater has a pH>7, so it can be described as alkaline- though that term is unrelated to the measure of alkalinity. As the seas take up CO2, they become less alkaline, but alkalinity isn't directly affected. Confusing enough? ;) FWIW, while we are concerned about the reduction in pH, the real concern is the impact that that reduction in pH has on CaCO3 saturation. Even under pH below 7.8 many calcifiers do just fine so long as carbonate concentrations are maintained. Unfortunately, that works well in an aquarium but doesn't happen in nature. -
pbjamm at 04:00 AM on 18 March 2011Republicans to Repeal Laws of Physics
Tom Curtis @177 "2) Attempting to place the burden of proof entirely on the opposing theory" This is the root of many a skeptic argument tactic. They reject the evidence as inadequate or fraudulent thus forcing the burden back onto the supporters of the AGW theory. Since this rejection is based entirely on ideology it makes it impossible to shift back. You can present evidence and facts til you are blue in the face and all the skeptics need do is deny them as facts. It is an unwinable struggle and a very unscientific attitude. -
Andy Skuce at 03:45 AM on 18 March 2011Those who contribute the least greenhouse gases will be most impacted by climate change
One of the limitations of applying cost-benefit analysis to climate change is because the costs and "benefits" (ie, avoiding or reducing negative impacts) accrue to different people or groups of people. Seen from the point of view of a poor Bangladeshi girl, having a wealthy westerner pay more for their energy in exchange for a slightly reduced chance of he grandfather's farm becoming submerged looks like a good deal, regardless of the discount rate or the damage probability function. And vice versa, unfortunately. -
dhogaza at 03:40 AM on 18 March 2011Examining the impacts of ocean acidification
"ocean acidification" is no more wrong than discussing "warming winters". -
dana1981 at 03:32 AM on 18 March 2011Republicans to Repeal Laws of Physics
Nature has just published an editorial which is consistent with my article:"...That [the EPA endangerment] finding is scientifically sound had no bearing on the decision to push the legislation, and Republicans on the House of Representatives’ energy and commerce committee have made clear their disdain for climate science. At a subcommittee hearing on 14 March, anger and distrust were directed at scientists and respected scientific societies. Misinformation was presented as fact, truth was twisted and nobody showed any inclination to listen to scientists, let alone learn from them. It has been an embarrassing display, not just for the Republican Party but also for Congress and the US citizens it represents...the legislation is fundamentally anti-science, just as the rhetoric that supports it is grounded in wilful ignorance."
-
dana1981 at 03:18 AM on 18 March 2011Republicans to Repeal Laws of Physics
Gilles -"there is absolutely no room for any creationism or astrology in the known science. Defending these ideas is, in fact, attacking the whole construction of modern science"
That's not true. If for example there were an all-powerful deity which created the Earth 6,000 years ago and put all the pieces in place to make us think the planet is 4.5 billion years old, that wouldn't contradict modern science. What we know, for example, is that species evolve through natural selection. We've observed this. We also know that the planet is warming, we know how the greenhouse effect works, etc. There are observations and then there are theories and predictions based on those observations."there is nothing contradicting the laws of physics if there were natural cycles explaining the medieval optimum"
Of course not. Natural forcings do explain the MWP! That's a rather silly example. The bottom line is that the scientific evidence overwhelmingly supports both the evolutionary and AGW theories. But they are still both theories, and there are people who will always attack those theories. But Creationists really are not fundamentally different from global warming "skeptics". You may personally be more convinced by "skeptic" arguments than you are with Creationist arguments, but that doesn't mean they're any more or less scientifically valid. -
Chris G at 03:00 AM on 18 March 2011Examining the impacts of ocean acidification
FWIW, I was thinking of a response to Rob's comment on the planet-dying phrase, but I see that Alan's reply #14 matches my original interpretation of his words. On the pedantic side of language, andthorne's comment does indeed parse, but the tokens do not create a well-formed expression. :P Regarding Ken and CB, I'd be interested in seeing some math to support either position. It's conceivable that the upwelling of the deep ocean will, or is, providing something of a buffer, but it is not clear whether that is enough to prevent a large enough change in pH to dramatically change the nature of life in the oceans. Current trends indicate it is not. However, Ken's use of "if" is a bit off-putting. What do you mean "if"? Measuring pH is not difficult, and there exist records. We have measurements and basic chemistry that both tell us that the ocean is and should be becoming more acidic. It smacks of an attempt to cast doubt where there really isn't any. More acidic/less alkaline, they mean the same thing; let's not get hung up on the name. The general population believes that acids dissolve things, and that is what is happening. If you say the oceans are becoming less alkaline, it does not convey the meaning of what is really happening. Well, if does to those with a solid foundation in chemistry, but that isn't the majority of the audience. So, we have to deal with some backlash with the Dunning-Krugers when they learn that the actual pH is still technically on the alkaline side before they learn that alkaline water does in fact still dissolve the shell material, and that it dissolves it a lot more at 8.1 than it does at 8.2. A pH of 7.8 is downright frightening from an ocean food web perspective. -
Charlie A at 02:58 AM on 18 March 2011Maximum and minimum monthly records in global temperature databases
Shoyemore, #46 says "There is a useful model that if the records are random in a period of static temperature, the probability of a record in the nth datum (i.e. that is is greater or less than all previous data) is 1/n." There are two problems with the above statement. 1. "in a period of static temperature" .... most records indicate that the global temperature has been generally increasing since around 1800, or perhaps 1750. Your analysis assumes that there is not underlying trend to global temperatures. Over a wide ranges of averaging periods, that is clearly NOT true. Once you have made this erroneous assumption, the remainder of your analysis is faulty. 2. "probability of a record in the nth datum (i.e. that is is greater or less than all previous data) is 1/n." .... even for stationary processes this is not true. For a process with zero autocorrelation the probability is proportional to log(n). This is pretty much irrelevant, though, because 1) the temperature record has a trend, thereby invalidating your analysis, and 2) there is a high degree of autocorrelation in the temperature record, whether one looks over a period of months, years, decades. ------------------------- In response to my request that you apply your analysis to the earlier period, you use the interesting argument that "The conventional wisdom is that (human induced) CO2 warming did not set in on a large scale until the 1970s, whereas warming earlier in the century was due to other (natural) variations. There is nothing explicit in the chart to upset that view." The price of tea in China also does nothing to upset that view. Is there anything in your analysis that explicitly supports that supports that view? As a Skeptical Scientist you approach to proposing and supporting a hypothesis is rather strange. My point in asking you to apply your analysis to the earlier period is to see if there was something in your calculations that would give indication that some increases in temperature are abnormal and unnatural, and that some are merely natural variations. -
dana1981 at 02:48 AM on 18 March 2011Those who contribute the least greenhouse gases will be most impacted by climate change
Gilles keeps making this argument that if we're forced to reduce global fossil fuel use, poor countries will remain poor. Reality is that as DSL notes in #8, energy use increases with wealth, but there's no particular reason fossil fuels must be the source of that energy. It's just been the case so far because fossil fuels have been (artificially) cheap and plentiful. That doesn't mean economic growth and increased energy consumption in developing nations can't come from another energy source if we want it to. Gilles is stuck in the past, unfortunately. -
Albatross at 02:34 AM on 18 March 2011What would a CO2-free atmosphere look like?
TTT @73, "Ignoring feedbacks doesn't make the answer wrong..." Interesting contorting, but Lindzen's answer remains wrong, and it is troubling that you are willing to bend over backwards to dismiss that fact and defend yet another of Lindzen's monumental faux pas. The biosphere is a fully coupled and interactive system, you cannot ignore feedbacks. Well, you could but your answers/science would be wrong as demonstrated here. Your argument is ironic, given that Lindzen and Spencer insist that climate scientists are ignoring their hypothesized strong negative feedback. Yet here you seem to be arguing that "ignoring feedbacks does not make the answer wrong". No. Yet more inconsistencies and contradictions by 'skeptics'. -
JMurphy at 02:29 AM on 18 March 2011We're heading into cooling
Henry justice, firstly, see muoncounter's reply to you (if you have missed it) over on "Does CO2 always correlate with temperature (and if not, why not?)" Next, your gish-gallop list of the usual so-called skeptical arguments are easily dealt with on these threads : Climategate and the peer-review process Is there a scientific consensus on global warming? Taking the Money for Grant(ed) – Part I Taking the Money for Grant(ed) – Part II (The latter two are from Global Warming : Man or Myth ?. In fact, you would probably get a lot from just starting at this thread : Newcomers, Start Here Finally, your use of a site which contains the following - "intelligentsia ranks of leftists/liberals progressives and socialists", "the 'elites'", "left-liberal climate science", "the left-biased MSM", "the elites' science of stupidity", "liberals-progressives-socialists" - betrays an obvious need for political bias and opinion rather than facts : a sad state of affairs for anyone claiming to be a scientist. -
Albatross at 02:19 AM on 18 March 2011Those who contribute the least greenhouse gases will be most impacted by climate change
Well, Gilles was wanting attention and he sure has received it. I for one would ignore his pontificating until he posts something substantial and that is backed by the science and related literature. otherwise the thread just gets hopelessly off topic and derailed-- the intention perhaps? -
Yvan Dutil at 02:09 AM on 18 March 2011And so castles made of sand fall in the sea, eventually
Time to by future beach from properties en Bâton Rouge. -
ClimateWatcher at 01:56 AM on 18 March 2011One of the best climate change ads I've seen
"Limited time offer, order now." "Hurry, supply is limited" "So you don't forget, order before midnight tonight". Things which have to be sold rely on hard sell and time limits. Climate armageddon follows suit. -
Dikran Marsupial at 01:55 AM on 18 March 2011Most of the last 10,000 years were warmer
alecpiper@2 Here is a hint, you are likely to be taken more seriously if you are able to accept when you are incorrect, for instance the assertion that there is no correllation bewtween temperature and CO2. You are also shifting the goalposts from 10,000 years (i.e. the current interglacial) to the last 25,000 years. Of course there has been significant warming since the height of the last ice age, and of course it was non-anthropogenic. However that does not mean that changes in carbon dioxide were not implicated in the warming. Of course recent temperature changes are small compared to the difference between glacial and interglacial conditions, but they don't have to be that large to cause significant hardship, so that is a silly argument. Mentioning Easterbrook's WUWT article suggests you didn't read the article to which you were responding. You do know that it is Easterbrooks work that is the subject of the article? -
CBDunkerson at 01:49 AM on 18 March 2011Examining the impacts of ocean acidification
Ken Lambert #16 - You assume that heat and carbonic acid disperse through seawater at identical rates? -
the fritz at 01:49 AM on 18 March 2011Examining the impacts of ocean acidification
World ocean PH in 1875 ? It looks like Beck's curves for atmospheric CO2 ! -
les at 01:48 AM on 18 March 20112nd law of thermodynamics contradicts greenhouse theory
Tom@617 ... absolutely, hence the "for fun" remark - it was only that, sometimes, one good model deserves another. as for the heat capacity - I hesitated long and... then well, didn't have time to think that one out. Indeed the heat capacity would determine how long it would take to "heat up until" - and an infinite heat capacity would result in it taking an infinite time to heat up. Boundary conditions, hu? always a good way of doing a sanity check on a model - which is the point of your model; so back to that. -
alecpiper at 01:46 AM on 18 March 2011Most of the last 10,000 years were warmer
You guys still miss the basic point. Over the past 25,000 years there have been major changes in temperature (up to 14 deg C) over 40 years without any anthropogenic influence. Recent temperature changes pale into insignificance when compared to the past. Studies also show a close correlation between GISP2 (Greenland Ice Core project) and other glaciers. Samples from GICP are representative of world changes. See Dr Easterbrooks readable paper. http://wattsupwiththat.com/2011/01/24/easterbrook-on-the-magnitude-of-greenland-gisp2-ice-core-data/Moderator Response: No, you are missing that basic point. For education, see "Climate’s changed before," "It’s only a few degrees," and "It’s not bad," and if you want to argue, do so on those relevant threads, not this one. -
Yvan Dutil at 01:34 AM on 18 March 2011And so castles made of sand fall in the sea, eventually
I would like to add a warning on the utilization of those map. Sea rise is not uniform around the globe. In many place isostatic rebound is of the same order of magnitude as the sea rise rate. This means that some place will not see any increase, some will see decrease and some will see much larger increase. For example, New Orleans is expected to drop by 5 m before then end of century. In addition, if atmospheric or oceanic circulation is somewhat modified, rapid change in see level can be expected. Recently, there was also a suggestion that modification in weight distribution of ice could also leads to large scale sea level modification.Moderator Response:[DB] That just guarantees that this will happen, then (red is 1 meter SLR, tan is the next 5):

-
Pete Dunkelberg at 01:01 AM on 18 March 2011Examining the impacts of ocean acidification
"I know your words are English but collectively they do not parse." Bot or human?Moderator Response:[DB] Me or commentator #3? ;)
#3 has posted similar comments here in the past; I've also seen comments of that ilk likewise posted on other climate sites as well. Infrequent, but there.
My guess: Human
. -
Tom Curtis at 00:56 AM on 18 March 2011Republicans to Repeal Laws of Physics
Gilles @176, the difference between science and pseudo-science is not a difference in subject matter, but in how the "scientist" responds to falsification of their claims. In essence, a scientist will always attempt to maximize the empirical content of their theory; while a pseudo-scientist will minimize it. Pseudo-scientists will do this by: 1) Holding dogmatically to already falsified positions; 2) Attempting to place the burden of proof entirely on the opposing theory; 3) Using conventionalizing strategies that attempt to make their theory true by definition; 4) Using vague theories, and not spelling out the empirical predictions of their theories; and 5) Misrepresenting facts, including quoting sources out of context, and incorrectly describing the content of sources (ie, quote mining). They will also use tribalism to ensure that they do not have defectors, including abusing, vilifying and in general dehumanizing their opponents; and reserving criticism for their opponents, even when they clearly disagree with their friends. These are not exhaustive lists, but the crucial point is that all of these behaviours are common place in denier circles. Some more so than others. Plimmer, for example, and Monckton, appear to use the list of pseudo-science traits as a play book. IN fact, my overwehlming impression of Plimmer's Heaven and Earth was that he had taken his earlier "Telling Lies for God" as a tactics manual. Now granted there is a scale here, and not all deniers are as bad as each other; but not a single leading denier does not exhibit a large number of these traits. And amongst leading deniers, not a single one makes a practice of acknowledging the instances where they have been rebutted, and attempting to correct their theories accordingly. There are some minor players on the denier side who are much better in this regard, including IMO Ferdinand Engelbeen and Leonard Weinstein. But despite these rare examples, much that passes for criticism in denier circles is plainly pseudo-science; and the little that rises above that level does not support their case. Therefore the comparison with creationists is apt. Frankly, it is about time the serious deniers started recognizing this fact. So long as denier "science" is dominated by the Moncktons and the Plimmers, and the Watts; or even by the McIntyres of their movement, mainstream scientists are entirely correct to dismiss them as pseudo-scientists. The one thing a genuine scientist never lacks is fruitful lines of inquiry. Given that, and limited time, simple practicality dictates that they ignore the pseudo-scientists. There are to many probably fruitful lines of inquiry to waste time on the almost certainly fruitless. If you think there is more to that from the denier side; something mainstream scientists really need to pay attention to; then have enough faith in the idea to stop hiding it behind the great wall of nonsense which is so typical of denier websites and books. Clean out the charlatans from the denier house, and then it will be worthwhile for mainstream scientists to listen to the surviving denier ideas, ... if any. -
DSL at 00:52 AM on 18 March 2011We're heading into cooling
Justice: "The peer review process is lacking substantial articles favoring the opposite view and therefore, is not balanced, and maybe not credible at all. " You're absolutely right, Henry. It's not balanced. There's a reason for that. You might check out the journal Energy & Environment, a journal which is desperately seeking that opposing view you mentioned. Why such a hard time finding it, I wonder . . . -
DSL at 00:47 AM on 18 March 2011Those who contribute the least greenhouse gases will be most impacted by climate change
Gilles: "the fact that countries that emit the most CO2 are the most resilient does prove per se that use of FF increases the wealth and the capacity of mankind to resist natural cataclysms." That is a ridiculous idea, Gilles. Undoubtedly, cheap energy does create more wealth. It allows people to more cheaply produce, distribute, and consume food, water, shelter, and other types of goods and services. It does not increase the capacity of mankind to resist natural cataclysms. Only the ability to predict and the willingness to do something about the cataclysms will protect humanity from these cataclysms. True, the predictive ability is enhanced indirectly through cheap energy: more people can do science. Indeed, wealth may make people more susceptible to cataclysms--or, rather, it may make more people susceptible. Take the claim (I believe it was on SkS a couple of days ago) that Japan was saved by their wealth--saved relative to Haiti. Japan's infrastructure allows 30 million people to live in Tokyo. That infrastructure is based on cheap energy--energy to heat, to cool, to import food, and to provide jobs. What is Tokyo suddenly without cheap energy? A death trap. Without cheap energy, Haiti looks like . . . Haiti. The destruction in Haiti was the result of the quake's epicenter being 15 miles away from the capital city and the relatively unexpected nature of the event. If that 9.0 hits 15 miles away from Tokyo . . . at least twice the number of people that died in Haiti. Just because we have cheap energy, should we use it in an unrestrained manner? Should a species of animal populate an area to the extent of that area's available energy--when it knows that the energy source will diminish and a significant portion of the population will necessarily die? Should that same intelligent species use an economic mode that places productive people in harm's way for the sake of unrestrained growth (precisely what this article is about)? -
adelady at 00:36 AM on 18 March 2011Those who contribute the least greenhouse gases will be most impacted by climate change
Gilles, that doesn't necessarily follow. If you look at the 'advantages' of wealth and modernity that citizens of places like US and Oz aspire to, we're perfectly capable of increasing our already profligate use of power. And by far more than the kind of modest first steps that previously impoverished people can do. Just look at the shopping centre carparks near my home. Are they teeming with economical consumption vehicles. Not at all. Huge SUVs, people movers and other gas guzzlers abound and seem to increase by the month. One of our new suburbs, touted as 'environmentally friendly' in its early publicity, uses nearly twice the power of other suburbs (the environmental advantage was confined to water use). We now buikd bigger houses than anyone else in the world and they seem to require vast expanses of sun facing, single sheet glass - which requires extraordinary airconditioning efforts to make them livable in our extremely hot summers. (If you need a comparison, our climate is equivalent to some parts of the North African Mediterranean.) We don't even have a legal requirement to have our roof spaces ventilated to speed evening cooling and slow daytime heating. Air conditioning Adelaide during a heatwave is a huge use of power - we do it because we can and we're doing it more and more. If cities like Adelaide and Perth took serious steps to manage power use by negawatts alone (leaving aside renewable power), we could probably power and transport many multiples of the 3 million people currently luxuriating in such extravagant wastefulness. And the same could be said for most Australian and US cities. -
michael sweet at 00:25 AM on 18 March 2011Those who contribute the least greenhouse gases will be most impacted by climate change
Gilles: Please provide links to support your extraordinary assertion that predicted growth is in undeveloped countries. Your assertion that FF consumption directly relates to wealth is also false. See Wikipedia list fo co2 emissions. Provide links that support your claims, not just your poorly informed opinion. -
Bern at 00:20 AM on 18 March 2011Those who contribute the least greenhouse gases will be most impacted by climate change
Gilles, your "FF increases wealth" meme that you're pushing seems like just another variant of the "CO2 limits harm the economy" argument, refuted here. In any event, we have a choice. 1) Provide undeveloped nations with cheap fossil fuels, so they can build the wealth & capacity to attempt to adapt to global warming (although based on some predictions, it seems the entire GDP of the planet would be required, and then some). 2) Provide undeveloped nations with alternate (non-fossil) energy sources, so they can build wealth & capacity to improve their standard of living, without making global warming worse... I don't know about you, but I'd prefer #2 myself. Thing is, it'll end up being a whole lot cheaper for the developed parts of the world, too. I mean, seriously. Predictions of sea level rise suggest that by the end of the century half of Bangladesh might be under water. Where are you going to put those 80 million climate refugees? And how are developed nations going to deal with them while madly trying to move $trillions worth of real estate & infrastructure to higher ground? This paper suggests a cost on the order of a trillion dollars for a 1m sea level rise. That'd buy a whole lotta renewables for developing nations. It also ignores costs due to other potential impacts of global warming (such as heatwaves, decreases in crop yields, droughts & floods due to a more intense hydrological cycle, etc etc etc). Start to factor those in, and you're talking about a serious chunk of change... -
Utahn at 00:20 AM on 18 March 2011Those who contribute the least greenhouse gases will be most impacted by climate change
Gilles:" the fact that countries that emit the most CO2 are the most resilient does prove per se that use of FF increases the wealth and the capacity of mankind to resist natural cataclysms" So correlation is causation, in your view? So all of those Chinese first time car buyers got wealthy from fossil fuel use and *then* bought a car? Or did they make money some other way, use it to buy a car, and thereby increase their fossil fuel consumption? I know which one sounds more plausible to me. Prove the causation, the correlation proves nothing "per se" or otherwise... -
Ken Lambert at 00:15 AM on 18 March 2011Examining the impacts of ocean acidification
Alan Marshall #14 On the positive side, if the oceans are acidifing, then the surface layers (top 700m) are mainly involved. If the deep oceans were involved (700m - 3700m av depth) then the amount of dilution of the man made CO2 dissolved in this vast extra volume, would change the pH by an infinitesimal amount. If that conclusion seems logical, then transport of absorbed CO2 and heat energy to the deep oceans by deep mixing would be very limited and therefore the missing heat supposed to be down below 700m is not there either. -
Henry justice at 00:08 AM on 18 March 2011We're heading into cooling
Is the data presented in the referenced NOAA/NCDC site wrong? If so, let me know. I am perfectly capable of drawing my own conclusion about what I see. There is no credible evidence that CO2 is causing unprecedented warming. Likewise, the science presented supporting warming trends are not yet conclusive in light of the real raw data that I have seen and the information, rebuttals, and data showing the cooling trends. The peer review process is lacking substantial articles favoring the opposite view and therefore, is not balanced, and maybe not credible at all. I find substantial flaws in a lot of the warming data presented. Sadly, it's like peeling back a good onion only to find it's rotten inside. I too am a scientist. Any fool can see what that a lot of money has been thrown at the warming game. The temperature rise to date does not support the claims made about CO2. -
K T at 00:05 AM on 18 March 2011Those who contribute the least greenhouse gases will be most impacted by climate change
Clearly if there's a God, he's not known for being fair in meting out punishments.Moderator Response: [DB] Not all are meted out in this lifetime. All will be meted out, eventually.
Prev 1860 1861 1862 1863 1864 1865 1866 1867 1868 1869 1870 1871 1872 1873 1874 1875 Next


