


 Arguments


Recent Comments
Prev 1861 1862 1863 1864 1865 1866 1867 1868 1869 1870 1871 1872 1873 1874 1875 1876 Next
Comments 93401 to 93450:
-
Gilles at 23:54 PM on 17 March 2011Republicans to Repeal Laws of Physics
OK for the argument of websites - this is a minor point. And I'm not saying that all arguments of climato-skeptics are true. But i think there is a fundamental difference; there is absolutely no room for any creationism or astrology in the known science. Defending these ideas is, in fact, attacking the whole construction of modern science, which has proved to be incredibly efficient - after all if our laws were wrong, it would be a miracle that TV, satellites, or computers work perfectly. On the other hand , there is nothing contradicting the laws of physics if there were natural cycles explaining the medieval optimum, if the retroaction of water wouldn't be so strong after all, if the ultimate amount of FF would be below 1000 Gtoe, or if mankind would adapt satisfactorily to a change of a few degrees. This wouldn't be at all contradictory with the fact that TV, satellites, or computers do work - actually this wouldn't be contradictory with anything. So I keep thinking that the comparison with creationism is disingenuous.Moderator Response: [Muoncounter] Odd you would find it disingenuous, as you brought it up. Yet another example of the power of fact-based argument over your 'I think' and 'its clear to me'. Please try harder to substantiate your ideas; refuting mere opinion is tedious. -
Gilles at 23:41 PM on 17 March 2011Those who contribute the least greenhouse gases will be most impacted by climate change
First : the map is the map of CURRENT emissions. What about the map of PREDICTED emissions in a "BAU" scenario? if CO2 emissions increase, it can only be through the growth of consumption in poor countries ! Second : the fact that countries that emit the most CO2 are the most resilient does prove per se that use of FF increases the wealth and the capacity of mankind to resist natural cataclysms. This is true also without GW - of course there will always be hurricanes, earthquakes, and droughts, in any case. So one should carefully balance the fact that limiting the use of FF would automatically limit the capacities to resist natural hazards - even without warming.Moderator Response: [Daniel Bailey] When you make statements of this nature, please support your assertions with links to credible sources. As it stands, your comment in its entirety amounts to trolling. Be advised. -
CBDunkerson at 23:13 PM on 17 March 2011Those who contribute the least greenhouse gases will be most impacted by climate change
Also note that if the emissions map were as detailed as the impact map (rather than averaging at the country level) the inverse correlation would continue to hold in many cases. For instance, the U.S. northeast has the highest 'emissions density' in the world, but will show little impact... while the U.S. southwest will have some impact despite having relatively low emissions. That said, there are some areas where the reverse correlation does not hold. Most notably... Saudi Arabia. -
CBDunkerson at 23:05 PM on 17 March 2011Examining the impacts of ocean acidification
Alan, I think the problem with the phrase 'the planet is dying' is that, while it is a reasonable way of describing the degree of biodiversity loss we are facing, it implies the end result of continuing down this path would be 'the planet is dead'... and that isn't going to happen. The changes we are making would result in a massive decline of human population, down to a level where we would no longer be making those changes, long before it would wipe out ALL life on the planet. Not an issue of disagreement on what is going to happen, but rather the implications of the particular turn of phrase. The planet is 'wilting', 'being poisoned', possibly 'decimated'... but not going to die and ergo not in the process of 'dying'. -
Dikran Marsupial at 22:43 PM on 17 March 2011Most of the last 10,000 years were warmer
alecpiper@2 1. Richard Alley does not dispute that it has been significantly warmer in the past. Of course in the past the warming wasn't due to AGW (because the was no A to cause the GW), but that doesn't mean the temperature changes were not due to changes in CO2. The greenhouse effect is the same regardles of the source of the CO2. 2. Easterbrook does not "simply illustrate that the Earth has been warmer in the past", he attempts to show that the Earth has been warmer in the past 10,000 years, which is unlikely to be true and is not supported by the evidence. Dr Easterbrook's research cannot prove that there is no correllation between temperature and CO2 levels, simply because it isn't true, you only need to look at e.g. the Vostok ice core data to see that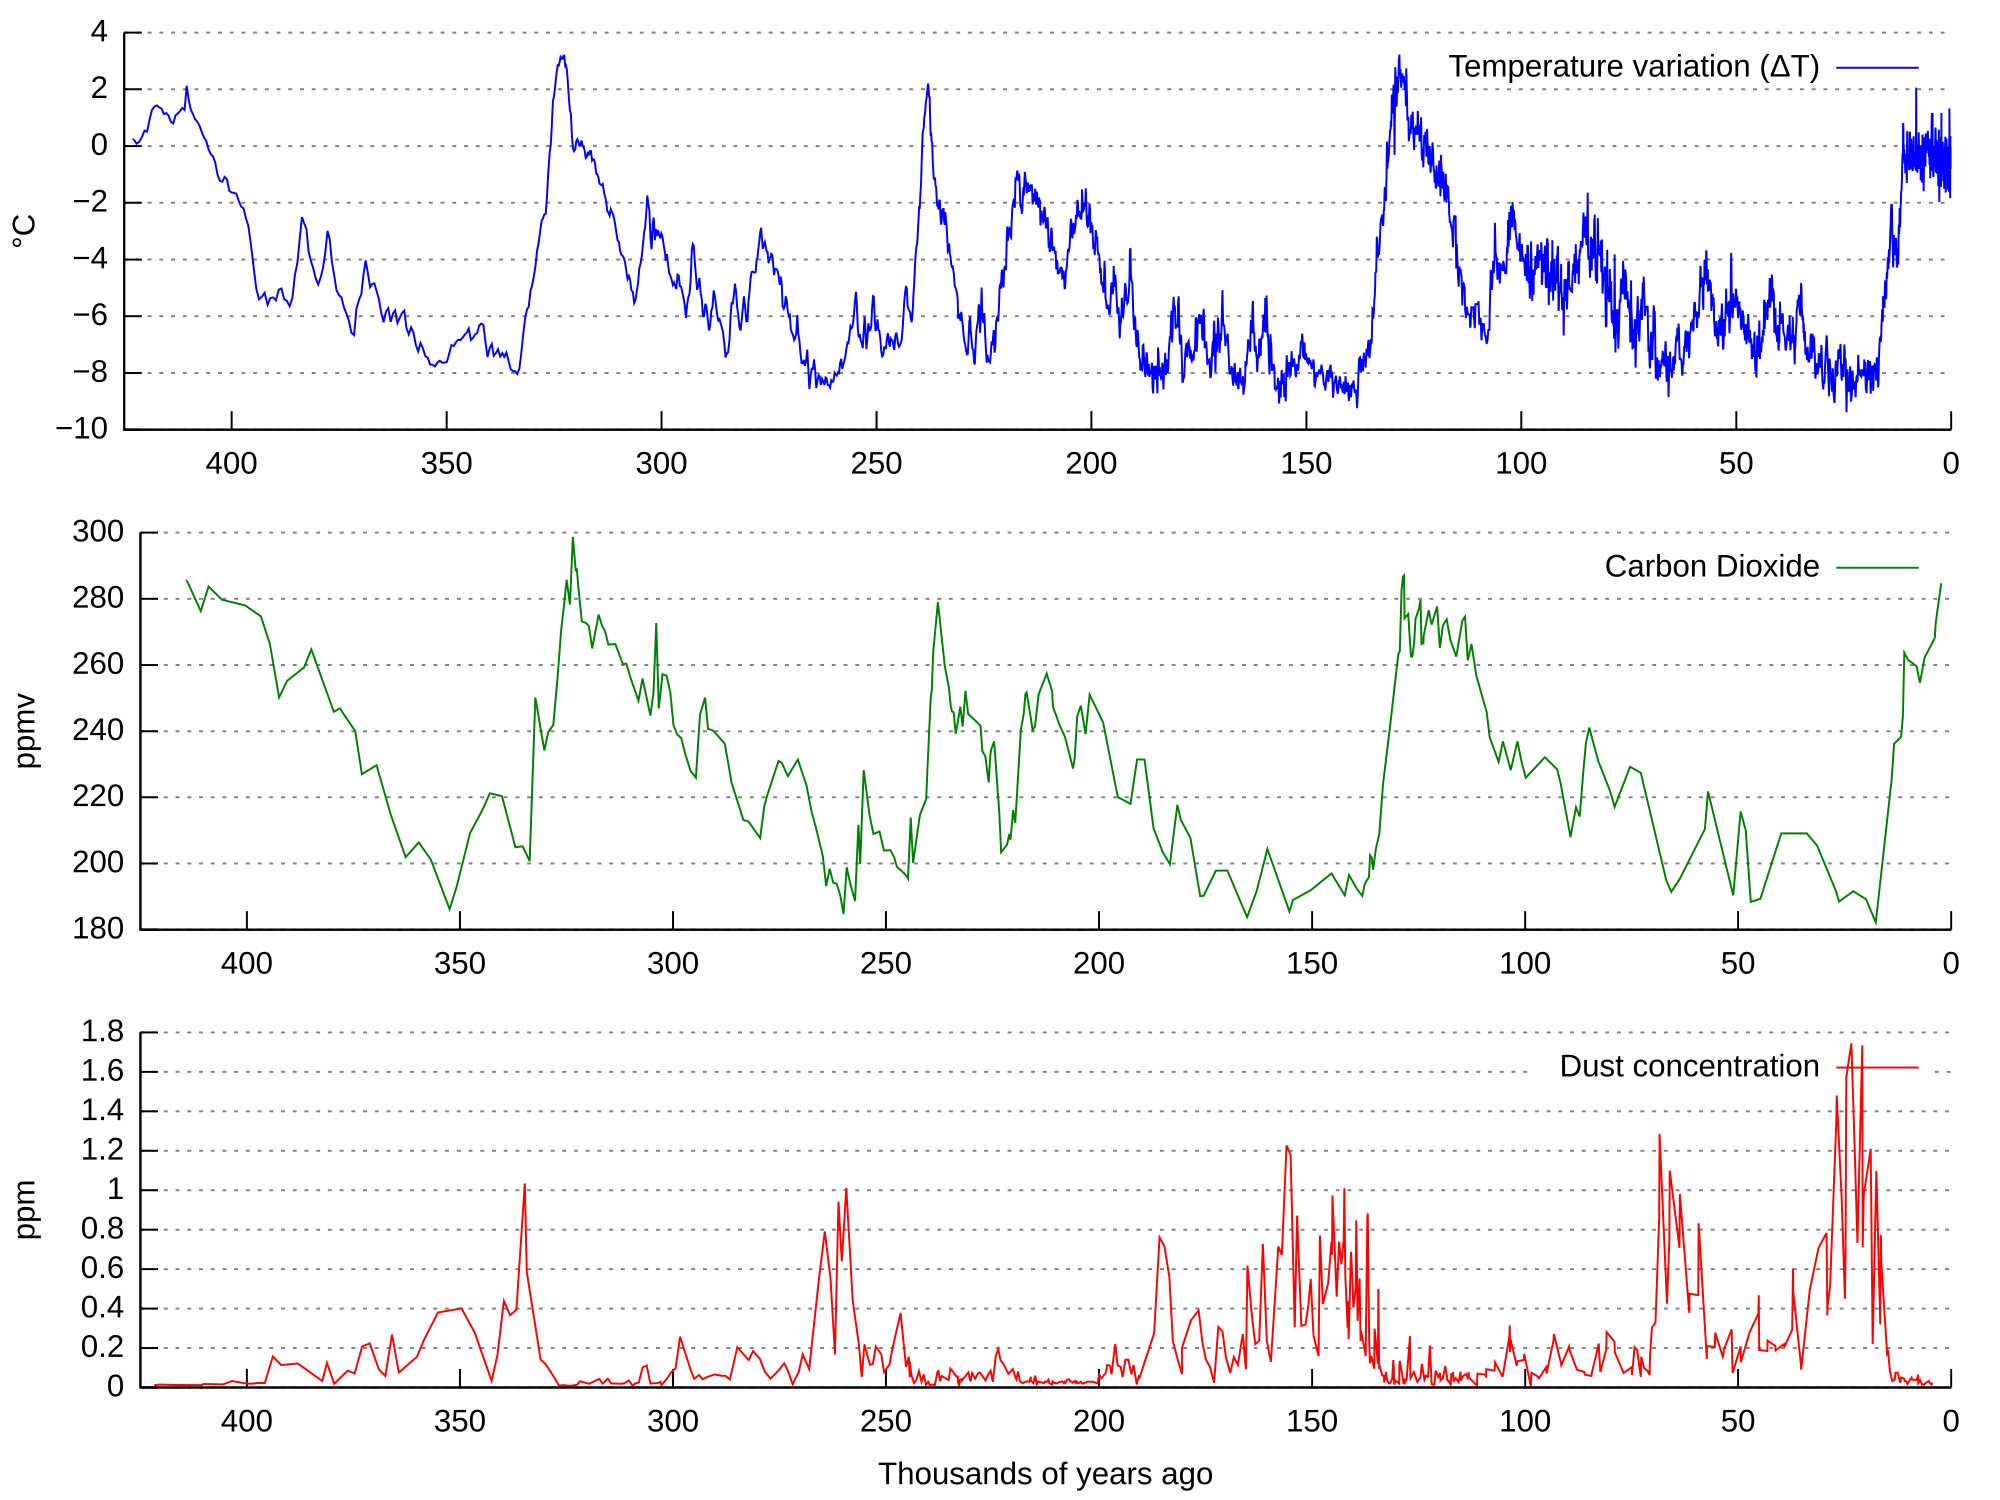 It is well known that CO2 generally lags CO2, but that does not mean that CO2 didn't cause most of the warming as it has generally been a feedback mechanism rather than a forcing. However, there have been occasions where CO2 has been a forcing rather than a feedback, for instance the emergence from the snowball Earth conditions of the late Ordovician.
However more appropriate places for discussion of the relationship between CO2 and temperature would be CO2 lags temperature or Does CO2 always correlate with temperature or CO2 was higher in the Ordovician. I'd be happy to discuss these issues with you on a more appropriate thread.
It is well known that CO2 generally lags CO2, but that does not mean that CO2 didn't cause most of the warming as it has generally been a feedback mechanism rather than a forcing. However, there have been occasions where CO2 has been a forcing rather than a feedback, for instance the emergence from the snowball Earth conditions of the late Ordovician.
However more appropriate places for discussion of the relationship between CO2 and temperature would be CO2 lags temperature or Does CO2 always correlate with temperature or CO2 was higher in the Ordovician. I'd be happy to discuss these issues with you on a more appropriate thread.
-
TimTheToolMan at 22:20 PM on 17 March 2011What would a CO2-free atmosphere look like?
The whole idea of arbitrarily removing all the CO2 from the atmosphere and contemplating the resulting temperature is contrived and is no more useful than contemplating the temperature while ignoring (unknown) feedbacks. Ignoring feedbacks doesn't make the answer wrong, it is still correct and just as useless in any practical sense. Its far less OMG though, isn't it.Moderator Response: (DB) Your opinion is noted; however the excellent post by Chris still stands. The fact that others have found this thread intensely interesting & informative still stands, as well. -
JMurphy at 22:17 PM on 17 March 2011Republicans to Repeal Laws of Physics
In addition to Tom Curtis's good examples, I would like to add Richard Dawkins and his Foundation for Reason and Science - he has wasted much of his time battling against Creationist beliefs. Also see his book The Blind Watchmaker. Also see : Science Museums Adapt in Struggle against Creationist Revisionism All part of what Creationists would call an ongoing debate, in just the same way as the so-called skeptics would say with regard to AGW. As Tom also noted, the tactics are pretty much the same and involve some scientists who both believe in Creationism (i.e. they are anti-science) and doubt AGW (ditto). Anyway, this is all pretty much off-topic by now but I think it has been shown that a debate involving non-experts is not the same as scientific arguments which are the normal state of play within good science. -
alan_marshall at 22:00 PM on 17 March 2011Examining the impacts of ocean acidification
gattuso @ 10 (and Rob Painting @ 13) Thanks for the link. It looks like a good site. I checked the latest article title "Ocean Acidifciation: The Acid Sea" published 16 March 2011, and I quote: Will organisms be able to adapt to the new ocean chemistry? The evidence from Castello Aragonese is not encouraging. The volcanic vents have been pouring CO2 into the water for at least a thousand years, Hall-Spencer told me when I visited. But the area where the pH is 7.8—the level that may be reached oceanwide by the end of the century—is missing nearly a third of the species that live nearby, outside the vent system. Those species have had "generations on generations to adapt to these conditions," Hall-Spencer said, "yet they're not there. So your own site suggests that conditions expected by the end of century will cause one third of species to disappear! I also refer you to the article “The Earth’s Sixth Mass Extinction May be Underway”, posted on this site on 9 March, with which I agree. I have been careful with my language, but I don’t regret using the words “the planet is dying”. Obviously I am not saying that all life is under threat. What I am saying is that with the climate projected to warm by 4 degrees C, and ocean surface pH projected to fall to 7.8 by the end of the century, many species are threatened with extinction due to human negligence, threatening the capacity of the Earth to support its present population. In my article I included Dr Will Howard’s photos showing damage to Globigerina bulloides. This damage did not occur in simulated conditions, but in 2007 in ordinary Southern Ocean seawater. It doesn’t look very encouraging, does it?. I know many scientists, and some of my colleagues on this site, dislike emotive language. But I think it is rational to use language proportionate to the threat, and the threat we face is unprecedented in history. -
alecpiper at 21:59 PM on 17 March 2011Most of the last 10,000 years were warmer
1. The "last word" from Richard Alley is truly pathetic. It is indisputable that in the past the earth has been significantly hotter than it is today. In those hotter periods there nwas no AGW. I agree that there are "finger prints" in the present but that is irrelevant to the basic that it was warmer in the past. 2. Dr Easterbrook simply illustrates that the earth has been warmer. That is not disputed.My understanding of Dr Easterbrooks research is that he "proves" there is no correlation between between temperature and CO2 levels. -
Tom Curtis at 21:52 PM on 17 March 20112nd law of thermodynamics contradicts greenhouse theory
les @616, with some minor amendments, and one major one, your variant box would much better model the greenhouse effect. However, it is not clear that it raises any issues of thermodynamics not raised with my simpler box. So, unless it is clear that we cannot get agreement that no additional thermodynamic arise in the simple model, than I would rather stick with that. If it becomes clear that we cannot get that agreement, we should introduce one variation at a time until we can isolate the actual issue in dispute. The one major disagreement, by the way is the infinite heat capacity. An infinite heat capacity would imply the walls of the box would neither heat nor cool, no matter who much radiation they absorbed or emitted, which would itself violate the laws of thermodynamics (I think) and certainly not accurately model any real physical process. -
Rob Painting at 21:36 PM on 17 March 2011Examining the impacts of ocean acidification
Hey Alan, Jean-Pierre Gattuso commented on your article. I've read a lot of his work in the scientific literature. I think he has a point, the planet won't die. Humans and many other species may, but not the planet. -
alan_marshall at 21:19 PM on 17 March 2011Examining the impacts of ocean acidification
WheelsOC @ 9
Yes, there are skeptics who think that the term ocean acidification is a misnomer. They argue that while the pH of the ocean remains above 7.0, the ocean is alkaline, and so it is. But as the references in my article explain, and as my above post (11) demonstrates, the ocean chemistry that supports marine life is compromised when conditions become less alkaline through rising emissions of CO2. It does not require blue litmus paper to turn red for biodiversity to be lost. I am happy to use the term "ocean acidification" as I am in the business of climate communication and this is the name by which the phenomenon is best known. In so far as dissolved CO2 increases the supply of H+ ions (see equation 1 in the main article), it moves the chemical balance further towards the acid end of the pH scale. -
alan_marshall at 21:02 PM on 17 March 2011Examining the impacts of ocean acidification
Here is another photo showing the damage to marine life we can expect to see if we do not act to reduce greenhouse gas emissions. As you can see from Fig. 1 in the article, the projected end-of-century pH for all oceans other than the Arctic, under a business-as-usual scenario, is 7.8. In the Arctic along the coast of Siberia it gets down to 7.6. A recent study of the effects of sea water with pH of 7.6 was published on 7 March 2011 by The Age newspaper in Melbourne. As you can see from the photo below, the growth of sea urchin larvae under such conditions is very seriously impeded.
-
les at 20:47 PM on 17 March 20112nd law of thermodynamics contradicts greenhouse theory
615 Tom Curtis I like, understand and agree with your model, but..The box is not a model of the greenhouse effect; but it does have the virtue that any thermodynamic issues raised by the greenhouse effect are also raised by this box, but in a simplified form.
it doesn't do the thermodynamics justice. (For fun) To do that the 'mirrored' walls should be perfectly black, perfectly insulated and with infinite heat capacity; the radiation hitting them would be perfectly converted into heat and the walls would black-body radiate. Then if the half-mirrored front was, instead, transparent at wavelength λ (give or take), and opaque else where: the box would heat up until radiance from the walls reaching the window at λ equaled the radiance coming in... With a little more messing around (2nd window, transparent at a different wavelength, etc.) you'd have a green house 'box'. -
shoyemore at 20:41 PM on 17 March 2011Maximum and minimum monthly records in global temperature databases
Charlie A #44, I am not a climatologist so all I can do is eyeball the charts as if they were an industrial process, say the temperature of an ongoing exothermic reaction in a large vessel. There is a useful model that if the records are random in a period of static temperature, the probability of a record in the nth datum (i.e. that is is greater or less than all previous data) is 1/n. Using that to set an expectation, neither the periods when cold records or hot records predominate in Figure 2 are random outcomes. So they must be due to extrinsic processes. In other words, we must look to processes that warm or cool the globe to explain the excursions in Figures 2 and 3. The conventional wisdom is that (human induced) CO2 warming did not set in on a large scale until the 1970s, whereas warming earlier in the century was due to other (natural) variations. There is nothing explicit in the chart to upset that view. -
shoyemore at 20:21 PM on 17 March 2011Maximum and minimum monthly records in global temperature databases
Eric (Skpetic), The average records per station over all of New England in your example is 50/20 = 2.5, in which case neither Boston nor Harford would depart significantly from the norm. More events is usually better in statistics, though Bayesians dissent from that as 0 events can still be used to update a prior distribution. -
scaddenp at 18:33 PM on 17 March 2011CO2 lags temperature
Without reading the papers and associated evidence, I cant comment on the reliability of the data. However, as a general rule, anything "paleo" in investigation has to necessarily form an hypothesis based on what we do know and then project back into the past to see if it fits paleo data. A fit gives us confidence that our ideas are not grossly wrong but cant of course "prove" that we are right. Since this is a climate blog concerned with the more immediate future of planet, you also need to recognize the significance (and insignificance) of this work. The geological processes at work here are largely irrelevant to climate of next 100 years. However, the predictions for the next 100 year ARE dependent of a model of drawn from physics (not paleoclimate). If this model of climate is correct, then it must also work (within the uncertainities) for paleoclimate. -
Rob Painting at 18:27 PM on 17 March 2011Maize harvest to shrink under Global Warming
John D - Map e) shows what 1° C will do to current areas under a managed rain-fed regime: That is, taking the results from the trial data analysis and applying it to the areas presently under maize cultivation, 65% of areas see a decline. And under drought management (map f) all areas decline, with 75% of areas seeing declines of over 20%.
 Those are the take-home points. The fact that presently uncultivated areas will be negatively impacted too (seemingly your gripe) simply means that there doesn't seem to be any upside.
-
gattuso at 18:13 PM on 17 March 2011Examining the impacts of ocean acidification
"Our planet is dying" I believe that this is a very excessive statement that should not be on this otherwise excellent web site. I invite readers to check the EPOCA blog (http://oceanacidification.wordpress.com/) for more recent and better documented general articles on ocean acidification and its effects on marine organisms and ecosystems. Note also that the Oceanography special issue referred to at the beginning of this post was published in 2009, not last year. Jean-Pierre Gattuso, coordinator of EPOCA -
Tom Curtis at 18:06 PM on 17 March 20112nd law of thermodynamics contradicts greenhouse theory
RW1, would you consider the following simple model: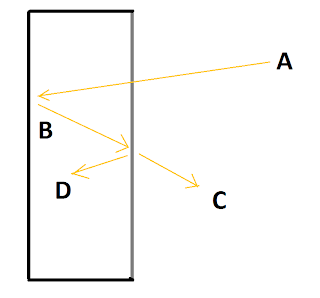 The model is a simple box with mirrored back and sides. We will assume the mirrors are 100% efficient, and reflect all light. The box is covered with a material that is completely transparent to all light coming from outside the box. However, it is half mirrored on the inside, reflecting exactly 50% of all light from the inside of the box, and transmitting without loss the remainder.
The box is not a model of the greenhouse effect; but it does have the virtue that any thermodynamic issues raised by the greenhouse effect are also raised by this box, but in a simplified form.
In this box, we have the following equalities:
1) Incoming light (A) = Outgoing light (C) (by virtue of conservation of energy).
2) Light reflected from the lid (D) = light transmitted by the lid (C) = Outgoing light (by virtue of the defined half mirrored property of the lid).
3) Light reflected from the back = light striking the underside of the lid (B) = light transmitted by the lid (C) plus light reflected by the lid (D) (by virtue of conservation of energy).
Therefore
4) Light reflected from the back of the box (B) = light reflected from the back of the lid (D) plus Incoming light (A) = 2 x A (again, by conservation of energy.
By simplifying the situation, ie, by getting rid of any concerns about convection and light absorbed by the atmosphere etc, we should be able to raise any issues you have with the consistency of the GHE with the laws of thermodynamics without getting hung up on trivia. Do you agree? Do you also agree with me that this simple model does not violate any laws of thermodynamics?
The model is a simple box with mirrored back and sides. We will assume the mirrors are 100% efficient, and reflect all light. The box is covered with a material that is completely transparent to all light coming from outside the box. However, it is half mirrored on the inside, reflecting exactly 50% of all light from the inside of the box, and transmitting without loss the remainder.
The box is not a model of the greenhouse effect; but it does have the virtue that any thermodynamic issues raised by the greenhouse effect are also raised by this box, but in a simplified form.
In this box, we have the following equalities:
1) Incoming light (A) = Outgoing light (C) (by virtue of conservation of energy).
2) Light reflected from the lid (D) = light transmitted by the lid (C) = Outgoing light (by virtue of the defined half mirrored property of the lid).
3) Light reflected from the back = light striking the underside of the lid (B) = light transmitted by the lid (C) plus light reflected by the lid (D) (by virtue of conservation of energy).
Therefore
4) Light reflected from the back of the box (B) = light reflected from the back of the lid (D) plus Incoming light (A) = 2 x A (again, by conservation of energy.
By simplifying the situation, ie, by getting rid of any concerns about convection and light absorbed by the atmosphere etc, we should be able to raise any issues you have with the consistency of the GHE with the laws of thermodynamics without getting hung up on trivia. Do you agree? Do you also agree with me that this simple model does not violate any laws of thermodynamics?
-
trunkmonkey at 18:04 PM on 17 March 2011CO2 lags temperature
299.PPS. Berner is alledging here that he has some knowledge that there was a lot of silicate (read rhyolitic and granitic)well drained upland rock for the giant Gymnosperms (tree ferns) to sink their roots into 370 Ma. He goes on to alledge that he has somehow tested this in modern soils. Assuming for the moment he is correct, this might explain the decent into a glacial epoch, but not the climb out. -
scaddenp at 17:57 PM on 17 March 2011CO2 lags temperature
I'm unfamiliar with paper you are trying to cite. Thanks to colleague who are interested in PETM and want to use my hydrocarbon maturation model to examine sedimentary basin feedback, I have suddenly had to come to speed on PETM. The models I was referring to are GCM-type models used in PMIP. See Ch 6 of WG1 for access to the enormous literature on this. I would readily agree that the relative contributions of various carbon sources and sinks are still uncertain. However, the climatic response response is well captured. The main takeaways though are: 1/ carbon-cycle feedbacks in the SHORT term (1000's of years) amplify the effects (positive and negative) of other climate forcings. 2/ The CO2/CH4-feedback in the glacial cycle is from ordinary organic carbon. 3/ The CO2 in the atmosphere today is from fossil fuel sources. 2 and 3 are evidenced from carbon isotope data. Carbon-cycle feedbacks are slow. Most AR4 models ignored them as irrelevant for next 100 years. If this is incorrect, then warming would be worse. -
ribwoods at 17:43 PM on 17 March 2011Positive feedback means runaway warming
I think the distinction between gain < 1 (no runaway even though feedback is positive) and gain > 1 should be explicitly stated early in the article. Climatology's use of "positive" (gain could be either > 1 or < 1) in regard to feedback is not the same as electronics's use of "positive feedback" (gain strictly > 1), IIUC. _That_ is why "positive feedback" has such a strong connotation of "runaway" for many newcomers to climate science. I think you need to jump on this early and explicitly in any discussion of "runaway", in order to cut down on misunderstandings. Don't bury the significance of _gain_ halfway down the article at the end of a paragraph ("and call the gain factor g"). -
Tom Curtis at 17:33 PM on 17 March 2011Republicans to Repeal Laws of Physics
Gilles @173:Let me just observe that I don't know any website maintained by scientists and devoted to criticize the arguments of creationism or astrologists.
TalkOriginsTalk.origins is a Usenet newsgroup devoted to the discussion and debate of biological and physical origins. Most discussions in the newsgroup center on the creation/evolution controversy, but other topics of discussion include the origin of life, geology, biology, catastrophism, cosmology and theology. The TalkOrigins Archive is a collection of articles and essays, most of which have appeared in talk.origins at one time or another. The primary reason for this archive's existence is to provide mainstream scientific responses to the many frequently asked questions (FAQs) that appear in the talk.origins newsgroup and the frequently rebutted assertions of those advocating intelligent design or other creationist pseudosciences.
The Panda's ThumbAbout “The Panda’s Thumb” is many things… First, it is an example of jury-rigged evolutionary adaptation made famous by the late Stephen Jay Gould in an essay of the same name. Second, it is the legendary virtual bar serving the community of the legendary virtual University of Ediacara somewhere in the Ediacaran hills of southern Australia, growing out of the lore of the Usenet talk.origins newsgroup. And now it is a weblog giving another voice for the defenders of the integrity of science, the patrons of “The Panda’s Thumb”.
Just two (and two of the best) of many sites where scientists discuss, analyse and otherwise pull to shreds the arguments of creationists, geocentrists and flat earthers such as, for example, Dr Roy Spencer, that rather well known (to us) Intelligent Design Creationist. The ranks of the creationists include a very large number of qualified scientists. So, by the standard you are defending, there is after all a scientific debate about creationism, and evolution; and indeed, even a scientific debate about geocentrism. Alternatively, some scientists allow dogma to rule their minds, and generate pseudoscience in defense of the dogma they cannot let go of. Let me tell you, as a veteran of the creation/evolution debate, AGW deniers show all the intellectual rigour I have come to know and love from creationists. Right down to that old favourite argument of creationsists: X is a scientist; X is a creationist; Therefore There is a scientific debate about creationism. -
johnd at 17:00 PM on 17 March 2011Maize harvest to shrink under Global Warming
Rob Painting at 15:29 PM, I take it that you have by now digested the two quotes from the study that I drew your attention to. Would you like to confirm that and perhaps comment on how you interpret them, perhaps after you have studied the relevant maps. It would help tremendously if you selected the appropriate maps that are relevant to the points made. The map showing the trial sites is irrelevant to the findings of the study, if you understand the objectives involved for the selection of the trial sites, then you will understand why that is so. Please study the maps I have provided below, then perhaps their relevance will become apparent. Map (a) shows the average growing season temperatures allowing the areas above and below 23°C to be identified, and hence those areas that tend to gain from additional warming and those that tend to decline with warming. Map (d) shows the current maize growing areas as various shades of green according to the % of land utilised for maize. Note the heavily shaded area in the vicinity of Johannesburg and the next most heavily shaded area in southern Nigeria. Map (e), apparently you have overlooked it, as it shows the present growing areas where yields will vary, up and down, shaded according to the degree of variation. You should note the positive or zero shading in relation to the two areas I mentioned. Map (b) with it's prominent shadings of deep red, shadings that are absent from map (e) show that the greatest impact on maize yields will occur where maize is not currently grown, though that hardly needs to be said does it?
-
dana1981 at 16:58 PM on 17 March 2011Irregular Climate Episode 18 (featuring Dana Nuccitelli)
Heh thanks Alexandre. It went okay :-) -
Gilles at 16:57 PM on 17 March 2011Republicans to Repeal Laws of Physics
JMurphy : I am a scientist, so I presume I have some ability to distinguish between a scientific discussion (e.g. discussing reconstruction methods, numerical models, role of spatio-temporal chaos, retroaction loops) and silly arguments. I admit that non-scientists are less able to do that, and must rely more on authority arguments ( = we MUST trust scientists !). Let me just observe that I don't know any website maintained by scientists and devoted to criticize the arguments of creationism or astrologists. They just laugh or try to generally educate people, but there is no DISCUSSION of them - for a simple reason, there is no "scientific" assertion of creationists, as long as i can see. Obviously this site is discussing scientifically arguments. that's enough for me to call it a scientific debate - you're indeed the best proof that the debate does exist.Moderator Response: [Muoncounter] You are ill-informed - see the National Center for Science Education, run by scientists specifically for the purpose of criticizing the arguments of creationists in their cloak of intelligent design. They produce an excellent list of discussion points; however existence of such a discussion hardly legitimizes one side of the debate. If you write 2+2=5 and you are corrected, your 'side' of that brief debate is not given status via correction. -
WheelsOC at 16:19 PM on 17 March 2011Examining the impacts of ocean acidification
No, I mean clicking on the Roman numerals in the article itself tries to direct me to a Skeptical Science Forum (with a *thread.php* in the url and everything), that I'm apparently not allowed to access. Also the links pointing towards notes iii and vi are not actually links in the article body. It's the same when I visit the Intermediate Rebuttal version of this post, I'm afraid.Moderator Response: [DB] Should be all fixed. HTML anchors were all hosed, corrupting links. Had to rebuild the whole post. The Intermediate Rebuttal I'll have to kick up to John to fix. -
adelady at 16:18 PM on 17 March 20112nd law of thermodynamics contradicts greenhouse theory
Tom@612. I'm saving that one. Your physics explanations are always good, but this one has bells, bows, balloons and buzzers. Outstanding. -
trunkmonkey at 16:12 PM on 17 March 2011Models are unreliable
299. CO2 Lags PS. Sorry, everything went wanky when I tried to paste the Berner citation. I think it is in Breeker anyway. I wanted to cite a specific example. Berner, in the failed citation, makes the grand arm waving statement " A large Devonian drop in CO2 was brought about primarily by the acceleration of silicate rock weathering by the development of deeply rooteds plants in well drained upland soils." -
trunkmonkey at 16:08 PM on 17 March 2011CO2 lags temperature
Your Honor, I swear I was going to pull this back to temperature precedence, but at your guidance I will move my post script to "models", even though they may be non sequitur there -
WheelsOC at 15:48 PM on 17 March 2011Examining the impacts of ocean acidification
I get so caught up in dealing with climate denier nonsense that it often slips my mind to work in an explanation of ocean acidification, but it's clear that I can't afford to let this issue slip away any longer. Thanks for the straightforward article. Couple of things, though. 1) When I follow the note links, I'm directed to a forum I can't access instead of the footnotes on this page. 2) Someone once got all pedantic and insisted that "ocean acidification" was a misnomer because oceanographers referred specifically to alkalinity, not pH, when talking about acidity of the seas; I remember from college chemistry that the two measures are not interchangeable. I take it that the "alkalinity only" thing is not really a hard-and-fast rule? All the public messages I've seen on CO2 and ocean acidification referred to pH rather than alkalinity.Moderator Response: [DB] If you're referring to the last source note, the URL was truncated. Here's the full URL: http://www.gbrmpa.gov.au/corp_site/key_issues/climate_change/climate_change_and_the_great_barrier_reef/what_is_coral_bleaching. I'll look into fixing the original post at top as soon as I can (the linked references in the main body appear to be gremlined). -
RW1 at 15:45 PM on 17 March 20112nd law of thermodynamics contradicts greenhouse theory
Tom Curtis (RE: 599), "And some of the energy flux carried by convection and evapo/transpiration makes its way to space. Do you deny that?" Let me try to explain this a little better. Yes, some of the kinetic energy flux into the atmosphere from the surface by thermals and latent heat can end up being radiated out to space. However, if this occurs, it also must result in an equal amount of energy less being returned to the surface. If less energy is returned to the surface than the amount of energy that left the surface, the surface will cool. As a result, the cooler surface will radiate an equal amount less than the amount radiated out to space from latent heat and thermals. Thus, the net effect of latent heat and thermals on the radiative budget is zero, as Conservation of Energy dictates, because all the energy leaving at the top of the atmosphere is radiative. -
trunkmonkey at 15:45 PM on 17 March 2011CO2 lags temperature
299. PS. Sorry, everything went wanky when I tried to paste the Berner citation. I think it is in Breeker anyway. I wanted to cite a specific example. Berner, in the failed citation, makes the grand arm waving statement " A large Devonian drop in CO2 was brought about primarily by the acceleration of silicate rock weathering by the development of deeply rooteds plants in well drained upland soils." -
Rob Painting at 15:29 PM on 17 March 2011Maize harvest to shrink under Global Warming
John D - The maps provided in the study identify such areas as well as the % of land utilised for growing maize, it's a simple matter to then correlate the two. Still no idea what you're referring to. Here are the trial and weather station sites: And the area currently growing maize.
 John D - With regards to the matter of tolerance to warming. Warming is a very subjective term, do they mean, plus 5°C, 10°C, 20°C, 30°C ?
It appears you haven't even read the study. Please do so, and then maybe some rational discussion can ensue.
John D - With regards to the matter of tolerance to warming. Warming is a very subjective term, do they mean, plus 5°C, 10°C, 20°C, 30°C ?
It appears you haven't even read the study. Please do so, and then maybe some rational discussion can ensue.
-
trunkmonkey at 15:14 PM on 17 March 2011CO2 lags temperature
299. "I believe that the clear signal that temperature lead CO2 in these data is an extremely important clue that is not adequately explained by Milankovitch." And what is the basis of your belief? Certainly not published science. How come models using known physics have little problem with such data? I have read most of the threads on this website and I have not seen many citations. I presume the models you refer to are GEOCARB and GEOCARBSULF (see Berner@"I believe that the clear signal that temperature lead CO2 in these data is an extremely important clue that is not adequately explained by Milankovitch." And what is the basis of your belief? Certainly not published science. How come models using known physics have little problem with such data? I have read most of the threads on this website and I have not seen many citations. I presume the models you refer to are GEOCARB and GEOCARBSULF. A good synopsis can be found at Breeker et al 2010. If I may be permitted to incorporate herein by reference all of his citations, it will save me a lot of trouble. A philosophical question: can a computer model with postulated imputs that successfully match a known phenomenon, but which has never successfully predicted anything, ever be considered to be more than a correlation, or indeed a logic exercise?Moderator Response: See the Argument "Models are unreliable." And post further comments about that topic over there, not here, please. -
Tom Curtis at 14:49 PM on 17 March 20112nd law of thermodynamics contradicts greenhouse theory
Camburn @604: 1) First and most importantly, the action of a force on an object never consumes energy. It only ever changes its form, and its location. This concept is actually very hard to grasp for most people because it is counter intuitive based on our everyday experience. In our everyday experience, a body in motion will come to rest unless an external force acts on it. This is the experience fairly well captured by Aristotle's laws of motion, but it is an illusion based on not taking into account the effects of friction and air resistance. In space (or by careful experiment) we can see that Newton's laws reign supreme, and that: a) A body at rest or in a state of steady motion will remain at rest or in a state of steady motion unless an external force acts on it; b) Force equals mass by acceleration; and c) For every action, there is an equal and opposite reaction. So, if we consider a gas molecule heading towards space. Gravity indeed acts on it, and it decelerates, losing energy in the process. But gravity equally, and oppositely acts on the Earth at the same time, accelerating it so that it has more energy. In fact, it gains exactly as much energy as the molecule loses. If we follow the path of the molecule under gravity, and ignore all the other collisions (which cancel out in effect), eventually the molecule will collide with Earth, resulting in another exchange of energy that cancels out the exchanges that took place under gravity. (To tell this story completely accurately, I would need to include gravitational potential energy, which shows up in General Relativity as very small changes in mass; but this is just a comment on a blog so you'll have to settle with the short and dirty version). Anyway, gravity does play a crucial role in the atmosphere. It is because of gravity that the atmosphere is dense near the surface, and thin away from the surface. A secondary consequence of this is that molecules move rapidly (the gas is warm) near the surface and slowly (the gas is cool) away from it; and it is possible to predict those temperature relationships using Newtons theory of gravity. But it does not result in a loss of energy, because all forces only result in the exchange of energy, never its loss. 2) Heat that is generated by friction is just kinetic the energy of the molecules that make up the substance being warmed as they vibrate in position; or in the case of a gas, move around in their container. But because that heat is just the motion of those small particles, the small particles themselves do not lose energy to friction. 3) The molecules in a gas do need to have significant kinetic energy to stay aloft. That is the energy of motion that they have because of the temperature of the gas. If the gas cools, they slow down, and will eventually not be able to escape the surface (which will mean the gas has condensed as a liquid or solid). However, they have this energy, the do not need to expend energy because any forces just rearrange the energy, not dissipate it. Further, they do not have frictional energy losses. The do lose energy by the radiation of IR gases, which needs to be replaced directly or indirectly from the sun - but for practical purposes they do not lose energy over and above that. -
RW1 at 14:02 PM on 17 March 20112nd law of thermodynamics contradicts greenhouse theory
Tom Curtis (RE: 599), "RW1 @595, all energy "emitted" from the surface is radiative only because we do not talk about "emitting" convection, or evapo/transpiration." OK, this is the crux. Is 396 W/m^2 radiated from the surface or not? "Not all energy flux from the surface, however, is radiative. In fact, only 80% of it is." Agreed. "And some of the energy flux carried by convection and evapo/transpiration makes its way to space. Do you deny that?" No. As I said, trade offs do occur but an equal and opposite amount less is then returned to the surface. Less energy returned to the surface than what initially left in kinetic form will cool the surface, which reduces the amount of emitted radiation by an equal and opposite amount. -
Camburn at 13:54 PM on 17 March 20112nd law of thermodynamics contradicts greenhouse theory
Philippe@607: Now you are understanding why I didn't understand. I was trying to explain his reasoning, which I did a poor job at doing. His lectures etc on that still tickle my brain tho. I know there is something there that I didn't understand. -
Philippe Chantreau at 13:48 PM on 17 March 2011Examining the impacts of ocean acidification
andthorne "the ice is growing astronomically at the South Pole and prior to the BP breech it had been growing for two years in the Arctic." This is complete nonsense, as any cursory look at either Cryosphere Today or NSIDC will demonstrate. As for the rest of your post, I'll say in chorus: uh? -
Riduna at 13:47 PM on 17 March 2011Examining the impacts of ocean acidification
Dr Gretchen Hoffman (UCSB) warned of this problem in 2009 when she described pteropods (Thecosomata) as “chips of the sea” because they were so widely consumed by fish on which larger fish preyed and on which, ultimately, a billion humans depended for protein. Alan Marshall’s article is a good reminder of the dangers posed by ocean acidification. Frankly, I am somewhat shocked by acidification expected over the rest of this century (Fig. 1) If it develops, the gloomy prognosis in my article “No Chips, No Fish” (http://www.onlineopinion.com.au/view.asp?article=8934) will indeed be realised with disastrous effects on marine habitat and human diet. That outcome is exacerbated by the fishing industry’s penchant for over-fishing and destroying marine habitat. An example of this is the Newfoundland cod fishery, over fished until 1992 when no cod appeared. Cod did not return. The Canadian government closed the fishery. Nineteen years later, cod have still not returned in quantity, 40,000 jobs have been lost and a valuable food source has been destroyed. The prime threat of ocean acidification is the loss of plankton and other calcifying animals, creating a break in the food chain and loss of habitat, particularly that provided by coral reefs. Some argue that fish-farming can replace the effects of open water species depletion and that there is nothing to worry about. Anyone who has studied the extent of fish farms and the inputs required or their operating cost knows that this is wishful thinking. Clearly, if we do not stop CO2 emissions and overfishing, our days of dining on fish and chips will be numbered and a dish once considered the preserve of the working class because of its affordability will become a rarity enjoyed by the rich. Frankly, the prognosis is not good. scaddenp @ 4 I think what andthorne is referring to is the possibility of methane released by melting clathrates creating anoxic conditions resulting in loss of marine species. My view is that marine species will be long gone before that occurs. -
Charlie A at 13:47 PM on 17 March 2011Maximum and minimum monthly records in global temperature databases
#36 Shoyemore "Figure 2 is the cusum plot, with expected centering and expected symmetry about 0. This is actually what happens 1880 to 1940s, giving rise to the suspicion that what was going on back then was natural variation. " Is the cumsum plot below what you would get for the 1920-1945 period, with 1925 cumsum set to zero? I'm pretty sure it is. What does your analysis tell us about that period? Natural variation or not? I'm trying to understand the basis of your concluding that recent warming is anything other than a continuation of the warming seen in the rest of the instrumental record.
-
RW1 at 13:42 PM on 17 March 20112nd law of thermodynamics contradicts greenhouse theory
Tom Curtis (RE: 597), "5) The surface radiation is a function of temperature and emissivity, which is not 1 at any location, though very close to 1 at most." OK yes, temperature and emissivity, which for all practical purposes is 1 because the surface is a near perfect black body radiator. -
RW1 at 13:38 PM on 17 March 20112nd law of thermodynamics contradicts greenhouse theory
Tom Curtis (RE: 597), "Saying that 239 w/m^2 becomes 396 w/m^2 is to directly assert the non-conservation of energy." How do you figure? I said the 239 W/m^2 entering the system becomes 396 W/m^2 at the surface. The amount leaving is still 239 W/m^2. Power in = power out = Conservation of Energy.Moderator Response: [DB] Fixed unclosed html tag. -
johnd at 13:37 PM on 17 March 2011Maize harvest to shrink under Global Warming
Rob Painting at 12:20 PM, re "Don't know where you get that idea." Firstly from this comment in the introduction of the paper, "Roughly 65% of present maize-growing areas in Africa would experience yield losses for 1°C of warming under optimal rain-fed management, with 100% of areas harmed by warming under drought conditions." More specifically from this - "For optimal management, at present, maize growing below ~23°C in average growing-season temperature tends to gain from warming, owing to positive effects of GDD8,30, whereas yields of maize grown in areas above this baseline temperature tend to decline with warming." The maps provided in the study identify such areas as well as the % of land utilised for growing maize, it's a simple matter to then correlate the two. With regards to the matter of tolerance to warming. Warming is a very subjective term, do they mean, plus 5°C, 10°C, 20°C, 30°C ? What data is there that identifies the exact degree of warming that it was thought to be able to tolerate, or was it all based on anecdotal stories? -
Philippe Chantreau at 13:35 PM on 17 March 20112nd law of thermodynamics contradicts greenhouse theory
Sorry Camburn, it still makes no sense. You say "Gravity is a force." Then you say "That energy is absorbed by gravity." So energy is absorbed by a force. Please elaborate on the physical process there, I'm at a loss. -
L.J. Ryan at 13:34 PM on 17 March 20112nd law of thermodynamics contradicts greenhouse theory
RickG @ 591 "Specifically, what is it that you guys don't understand about this diagram? You are trying to make it into something that it is not." I'm not trying to make this diagram into anything. I question the basis by which the energy is stored in the atmosphere...if not temperature. So I ask again how do you know is there...can it be measured? And by what means is the atmospheric energy stored? -
RW1 at 13:31 PM on 17 March 20112nd law of thermodynamics contradicts greenhouse theory
Tom Curtis (RE:597), "1) The energy absorbed at the surface is the Incoming Solar Radiation absorbed at the Surface (approx 161 w/m^2) plus the Back Radiation absorbed at the surface (approx 333 w/m^2)." OK, here is my question then to you: If you agree that the atmosphere cannot create any energy of its own, and 78 W/m^2 of the 239 W/m^2 (239 - 161 = 78) entering the system never reaches the surface, then where is the 333 W/m^2 of back radiation coming from if 239 W/m^2 is also leaving the system? 40 + 78 + 121 = 239 W/m^2 leaving. 396 W/m^2 - 239 W/m^2 = 157 W/m^2 emitted down to the surface. 161 + 157 = 318 W/m^2 at the surface (396 W/m^2 required). Also, 157 W/m^2 + 97 W/m^2 = 254 W/m^2 (333 W/m^2 required). -
Camburn at 13:18 PM on 17 March 20112nd law of thermodynamics contradicts greenhouse theory
Tom C@602: 1. Conservation of energy. Gravity is a force. Everything in our atmosphere/earth sphere is affected by gravity. It consumes energy. Without it, we would all float etc. Yes, kinetic energy is kinetic energy. But even kinetic is the result of heat and can be converted to heat. Friction is an example. When two molecules, even tho of minisucle weight, collide, energy is not only transferred, it is expended because they do not bond, rather they collide and go a different direction and they will go in a different direction at a slightly slower speed. That energy is absorbed by gravity. Even our atmosphere, while of atomic weights, requires an expenditure of energy to stay aloft. This energy comes from the sun as I know of no other source. A physics prof was trying to get this into my mind in college. Not sure I ever really totally grasped what he was trying to show, but rattling my old cobwebs I am trying to understand it still. It gets back to including all energy in any equation talking about energy. Maybe he was all wet, but the older I get the more I think he understood something quit clearly that I didn't. -
scaddenp at 13:02 PM on 17 March 2011Examining the impacts of ocean acidification
You might like to read Realclimate on methane eg here and and especially here. Climate looks grim but lets understand the real reasons.
Prev 1861 1862 1863 1864 1865 1866 1867 1868 1869 1870 1871 1872 1873 1874 1875 1876 Next


