


 Arguments


Recent Comments
Prev 1863 1864 1865 1866 1867 1868 1869 1870 1871 1872 1873 1874 1875 1876 1877 1878 Next
Comments 93501 to 93550:
-
JMurphy at 08:19 AM on 17 March 2011Republicans to Repeal Laws of Physics
Gilles wrote : "...Mcintyre has already made relevant criticisms that have been acknowledged by the community, and published reviewed papers (which is not the case of astrologists for astrophysicists or creationnists, to my knowledge)." It's easy to criticise but quite another thing to be taken seriously, as McIntyre knows. He may well have pointed out some problems with proxy data in MBH98 but, not being in any way an expert in anything to do with Climatology, he has not (indeed, cannot - in the same manner as you mention with regard to astrologists vis a vis astrophysics) been influential. Oddly, though, so-called skeptics seem to hold him in high regard and he has even been called here a "real statistician" - whatever that was meant to prove. If you want to see more 'debate' with regard to Evolution, how about this peer-reviewed journal - admittedly as scientifically trustworthy as Energy & Environment. Now, which hero to the so-called skeptics has published in E&E...? -
Gilles at 07:49 AM on 17 March 2011Republicans to Repeal Laws of Physics
" I am judging you on your inability to make a consistent, coherent and fact/science-based argument, and your inability to get your facts straight. " I'm deeply sorry you think so. So may be we could compare our "facts". For instance, let us compare our scenarios. Could you please indicate me , what would be for you * the worst scenario * the "most realistic" scenario * the "best scenario" for the XXIth century, with the following estimates : - CO2 concentration in 2100 - annual CO2 production in 2100 -annual energy consumption in 2100 - annual GDP in 2100 - average temperature increase in 2100 (with respect to preindustrial value) -
RickG at 07:49 AM on 17 March 20112nd law of thermodynamics contradicts greenhouse theory
damorbel @ 570 The diagram is not about temperature. Its about incoming solar radiation expressed in W/m^2 and how it is distributed throughout the Earth's climate system, which is the proper unit of measure for that particular type of energy (Incoming Solar Radiation). The 2009 diagram shows slightly different numbers from your example which was published in 1997 because the data has been updated. Why would Ternberth or anyone for that matter want to use 12 year old data when more up to date data is available? And again, the diagram is about the distribution of energy, not temperature. -
Gilles at 07:34 AM on 17 March 2011Republicans to Repeal Laws of Physics
Chris G "You are using an appeal to authority, and the vast majority of the authorities are against you." I'm sorry, but you're projecting your own attitude on me. I am not appealing any authority. I am not saying these people are always right. I observe that there is a debate, and I can give you many comments even by climate scientists showing that these people have been often right. " The only efficient way to stabilize the CO2 content of the atmosphere is to quit putting more into it. " Well said ! and the only efficient way to avoid car crashes is to stop using cars, too. so why don't you stop using ANY fossil fuel just tomorrow ? " The vast majority of authorities agree that things will get catastrophically bad if BAU continues until we run out of fossil fuels. Like Yul Brynner, at some point, we will quit using fossil fuels. The sooner we do that, the less chance we have of developing a fatal condition. The current bill would delay when we quit." The vast majority of authorities don't have any idea how to stop FF without an immediate economic crash, and nobody even think of that . So please tell me : what is the reasonable minimum amount of FF you would allow per capita, and for how long ? -
Tom Curtis at 07:30 AM on 17 March 20112nd law of thermodynamics contradicts greenhouse theory
damorbel @578, you are of course correct about the stratosphere. Further, without the absorption of UV by the dissociation of O2 and O3, there would be no temperature inversion in the stratosphere. However, even without that absorption, radiation rather than convection would dominate energy transfers in the stratosphere as I have described, and for the reasons given. I had considered giving the fuller explanation, but opted for brevity. -
Gilles at 07:26 AM on 17 March 2011Maize harvest to shrink under Global Warming
MattJ : I thought that the continuous of fossil fuels had increased our food production by several dozens, but again, we may not live in the same world .... -
damorbel at 07:10 AM on 17 March 20112nd law of thermodynamics contradicts greenhouse theory
Re #573 Tom Curtis, very interesting contribution. You are certainly correct about radiation playing a minor role in transferring energy in the bulk of the troposphere. But I have a problem with your explanation for the 'top of the trop.' I suggest it is the absorption of ultraviolet by O2 that dominates the heating of the atmosphere above the tropopause. About 10% of the Sun's radiant energy is absorbed by O2 and of course the resultant O3. This 'stratospheric heating' occurs even with the rather small amount of UV energy because the density of air is so low 'up there'. And, being a heating effect and causing the temperature to rise, it produces what is called, in the troposphere, a temperature inversion, a condition with warm air over cold, known to supress convection and produce stable air conditions, just the reason why jet transports like to fly in the stratosphere. The temperature at the bottom of the stratosphere ('top of the trop.') can be -60C but it rises steadily to about 0C at 60 to 65km. -
Tom Curtis at 07:06 AM on 17 March 20112nd law of thermodynamics contradicts greenhouse theory
The following is a diagram to illustrate the importance of the lapse rate from one of the best simple explanations of the Green House effect that I know of. (Warning, it contains some maths; but you do not need to follow the maths to understand the explanation.) One point the diagram illustrates which I haven't mentioned is that GHG "sets the temperature at the top of the troposphere" (which on reflection, is not the best wording) by adjusting the altitude from which the Earth effectively radiates to space at different frequencies.
-
Protector at 07:00 AM on 17 March 20112nd law of thermodynamics contradicts greenhouse theory
Tom Curtis @ 573: Wow, that's a whole different picture from what I had in mind. Very enlightening!... So, it sound like the vertical pressure gradient is a key factor controlling the lapse rate at least in the troposphere, and then GH gases affect directly only the upper troposphere temperature, and controls the surface temperature indirectly through the lapse rate, correct? Let me ponder on this for a while before I continue this amazing (at least to me) discussion. -
Rob Honeycutt at 06:57 AM on 17 March 2011The name is Bond...Gerard Bond.
PhySci @ 18... "I have researched this topic in detail, I can tell you with full confidence that is NO credible empirical evidence in the entire historical record that CO2 has had ever any impact on Earth's climate! " I can tell you with equal (or more confidence) that there are many thousands of other scientists who have researched this in excruciating detail and have come to the conclusion that CO2 is the "largest control knob" on the planet's climate. You have a daunting uphill battle to convince the broader scientific community of your position. -
Tom Curtis at 06:55 AM on 17 March 20112nd law of thermodynamics contradicts greenhouse theory
Protector @572, back radiation is relatively unimportant in determining global temperatures, although situations arise where it is very important in determining the local temperature for a period of time. However, if back radiaton raises surface temperatures to far, this will raise temperatures at the top of the troposphere by convection. The raised upper tropospheric temperatures will result in more radiation escaping to space, thus cooling the Earth. In consequence, the temperture at the surface in the long term is set by: 1) The Lapse rate; and 2) The balance of IR radiation to space from the upper troposphere, as determined by GHG. You need both factors. If you consider a number line representing the surface tempertures, then the lapse rate is a sloped line intersecting the number line. The point of intersection will determine the surface temperature. However, if we just know the slope, we do not know the point of intersection. We also need to know the location of at least one other point on the slope, and that is determined by the GHG in the atmosphere. -
les at 06:48 AM on 17 March 2011Republicans to Repeal Laws of Physics
160 Moderator Yes, well. No engineer understands all the processed of combustion in a piston; and certainly not without the help of models and simulations. This uncertainty is surely enough to stop someone, inclined to that kind of thinking, to stop driving a car. -
Tom Curtis at 06:47 AM on 17 March 20112nd law of thermodynamics contradicts greenhouse theory
Michael Sweet @571, damorbel is using the correct units, and the approximate value of the environmental lapse rate, which is critical to the greenhouse effect. (See my comments at 563 and 573.) Where he is wrong is in supposing that Trenberth's diagram from the IPCC is a model of the greenhouse effect. It is not, except in the most rudimentary terms. It is only what it claims to be, the Earth's energy budget, ie, a tabulation of what comes in and what goes out. His demand about the proper presentation of the table amounts to a demand that every diagram related to a theory should explain every feature of the theory, which is absurd. -
Tom Curtis at 06:42 AM on 17 March 20112nd law of thermodynamics contradicts greenhouse theory
Protector @569, very happy you are finding it useful. The air heats as it falls because it is compressed by the higher pressure air around it. It cools as it rises because it expands because of the lower pressure air around it. This is an indirect effect of gravity, which is of course the reason the air becomes more dense, and under higher pressure the lower you get in the atmosphere. GHG also impose a lapse rate on the atmosphere, however, in the troposphere, the effect of convection overwhelms that of GHG in determining the lapse rate because it takes much less time for convection to move energy than it does radiation. Radiation counter intuitively takes a long time to move energy because it only travels a short distance before being absorbed. It will then take considerable time before it is re-emitted. So, while convection carries energy quite slowly, and radiation carries it very fast (at the speed of light), convection carries it in one continuous motion, while the radiation makes a series of short journeys with very long delays in between. The tortoise and the hare come to mind. At higher altitudes, because the molecules are greatly seperated radiation becomes the main means of carrying energy. But because the molecules a greatly seperated, very little of the Earth's radiation to space comes from those altitudes, so they can be effectively ignored. So, in the troposphere, convection determines the lapse rate. What GHG do is determine the temperature in the upper troposphere. By determining that temperture, they also determine the temperture at the surface because the two are related by the lapse rate. And to avoid one common confusion, this is not a case of the upper troposphere warming the surface. The sun warms the surface. The lapse rate and GHG determine how efficiently the energy from the sun can escape the surface, and hence how much the surface is warmed by the sun. -
Protector at 06:20 AM on 17 March 20112nd law of thermodynamics contradicts greenhouse theory
Tom Curtis @ 565 I just read your comment to PhysSci. "As a result, except for short term excursions (ie, over a few hours or in some cases days), back radiation is not very significant in determining average surface temperature. However, back radiation can lift surface temperatures up to the temperature determined by the lapse rate without the heat being dissipated by convection." I thought that back-radiation was the primary factor controlling the global surface temperature. That has been my impression all along from the popular literature describing the greenhouse effect. However, as someone has pointed out on this thread before, one cannot learn good physics from popular literature and analogies ... So, should I understand that back radiation is only marginally important for surface temperature globally because of the presence of convection? Is this another way of saying that the lapse rate is the main factor determining surface temperature? Thanks again! -
michael sweet at 06:19 AM on 17 March 20112nd law of thermodynamics contradicts greenhouse theory
It is amazing that someone who does not even understand the units thinks that professional scientists have been wrong about the 2nd law for 150 years. And they are the only ones who can figure it out! degrees/km, it would be funny except people like this keep us from taking any action about AGW. -
Alexandre at 06:16 AM on 17 March 2011Irregular Climate Episode 18 (featuring Dana Nuccitelli)
I have just listened to the interview. Relax Dana, you did really fine. -
scaddenp at 06:15 AM on 17 March 2011CO2 lags temperature
trunkmonkey - "Paleoclimate is really a logic excercise where you are lucky when the disparate signals from proxies give you a correlation." This simply not true. Uncertainty bands gets larger but you will find that alternative theories have to work with quite strong constraints. Suggest you read up on this. "I believe that the clear signal that temperature lead CO2 in these data is an extremely important clue that is not adequately explained by Milankovitch." And what is the basis of your belief? Certainly not published science. How come models using known physics have little problem with such data? As to whether CO2 has always led temperature, possibly but PETM is closer to what we had. Temperature increases will certainly lead to CO2 increases to amplify the effect but if another mechanism (eg burning fossil fuel) will increase CO2, then you still get the temperature rise. -
damorbel at 06:11 AM on 17 March 20112nd law of thermodynamics contradicts greenhouse theory
Re #541 RickG, you wrote:- "The diagram was about the flow in energy which is expressed in units of W/m^2. That is: energy (watts) over a specific area (a square meter). Are you suggesting that it should be "degrees" per square meter?" No, I'm not. Degrees per meter i.e. distance, not area. The temperature in the tropsphere (in the diagram) should be shown as -6.5C per km (altitude). Then the author could show how it is affected by CO2, it is the second law of thermodynamics. You also wrote:- "Also, why are you criticizing the IPCC when the diagram you are talking about is by Trenberth, Fasullo and Kiel (2009)? " Because the IPCC use Treberth's diagram in many of its official reports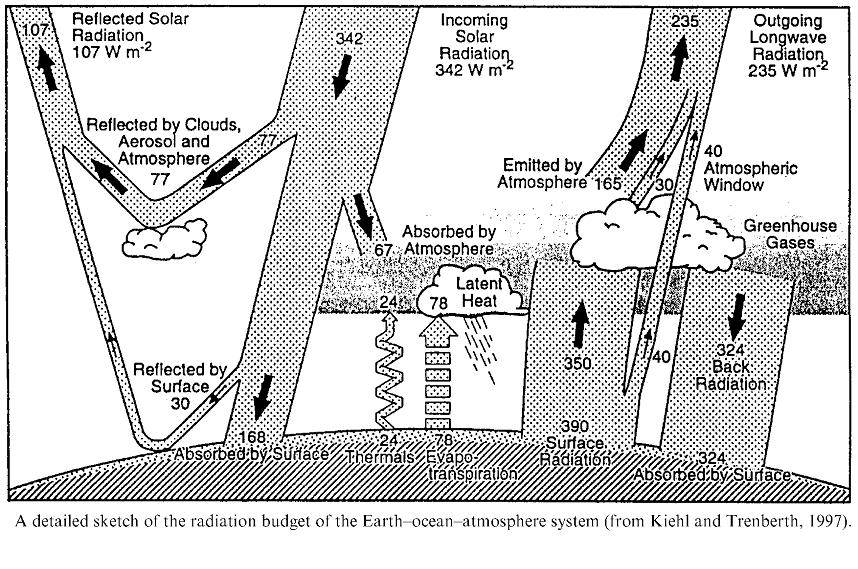 when making the case for governmental action to reduce CO2 emissions
Trenberth has updated his diagram a number of times changing the W/m^2 numbers but never showing any temperatures or even temperature gradients. Surely if the IPPC wishes to make the case for CO2 global warming they could have chosen a diagram with temperatures on it so that the warming would be clear to all?
It a fundamental of heat transfer, W/m/K Watts per metre per degree Kelvin. You can multiply this by however many m^2 you have to determine the total power being transferred for the given temperature difference, the formula just gives the temperature gradient; in the atmosphere it is -6.5 deg. Kelvin per km.
Moderator Response: [Muoncounter] You've raised this point before. If you have an objection of substance, perhaps you can take it up directly with Dr. Trenberth and report back.
when making the case for governmental action to reduce CO2 emissions
Trenberth has updated his diagram a number of times changing the W/m^2 numbers but never showing any temperatures or even temperature gradients. Surely if the IPPC wishes to make the case for CO2 global warming they could have chosen a diagram with temperatures on it so that the warming would be clear to all?
It a fundamental of heat transfer, W/m/K Watts per metre per degree Kelvin. You can multiply this by however many m^2 you have to determine the total power being transferred for the given temperature difference, the formula just gives the temperature gradient; in the atmosphere it is -6.5 deg. Kelvin per km.
Moderator Response: [Muoncounter] You've raised this point before. If you have an objection of substance, perhaps you can take it up directly with Dr. Trenberth and report back. -
Protector at 05:58 AM on 17 March 20112nd law of thermodynamics contradicts greenhouse theory
Tom Curtis @ 563: Thank you for this wonderful explanation! It gave me insight and more food for thought. I knew that air rises when it heats up, but did not fully realize that it also cools at the same time. I did not understand that 'compression' actually heats up the falling air. From what you said: "That [lapse] rate is a function of the gravitational acceleration and the specific heat capacity of the gas involved", I figured out that gravity is somehow responsible for compressing a falling parcel of air. Could you elaborate a bit more how exactly that works? Also, from your explanation, I gather that greenhouse gases are not determining the lapse rate. Is this right? I thought GH gases were either controlling the lapse rate or directly heating the surface, and that the lapse rate was responsible for the higher temperature on the surface. Could you provide a little more clarification on this? This discussion has been really useful for me. I feel like I'm really advancing my understanding in a field I've been taken for granted! -
angusmac at 05:50 AM on 17 March 2011Climate Emergency: Time to Slam on the Brakes
Albatross I will respond to @106 but it may take some time because I am trying to source data on your RC chart. However, I hazard a guess that the rest of SkS are total bored with our dialogue. Wake up SkS! It can’t be that boring – we all may learn somthing. If you are still following this please give us some encouragement. Meanwhile Albatross, I request that you desist from giving me personal advice – especially when it is patently wrong. For example @102, if I needed to replace my brake pads on my car, I would accept the advice of a service station technician as you suggest. However, if I needed someone to “break pads” on the car, I would go to a wrecker’s yard. -
Tom Curtis at 05:39 AM on 17 March 2011What would a CO2-free atmosphere look like?
BP @61, assuming it was sensible to calculate a no feed back change to temperature from the removal of CO2, your method of doing so is so sloppy as to be worthless. Using Modtran, setting it to a US standard atmosphere and then adjusting the temperature down to approximately equal the effective temperature (-0.9 degrees), I then removed the CO2. The result was to increase OLR by 27 watts, increasing the effective temperature by approximately 10 degrees. The version of Modtran I used is obsolete, so this figure is not exact; but it is a far better estimate than your estimate by sloppy calculation based on generous (to your argument) estimates. -
shoyemore at 05:30 AM on 17 March 2011Maximum and minimum monthly records in global temperature databases
Henry justice, Apologies, you will have to explain what you mean by "duration" in your post. Do you mean time between records? -
Henry justice at 05:06 AM on 17 March 2011Maximum and minimum monthly records in global temperature databases
The number of maximum or minimum temperatures may or may not indicate warming or cooling. As such, the amount of warming or cooling is not quantified by such data. Without this quantification of warming/cooling, no conclusion should be drawn from just the number of the max or min only data without the duration added in in some form of units. In other words, you certainly can have three times the number of max warming vs cooling, but cooling can still be occurring due to their longer duration. -
Chris Colose at 05:02 AM on 17 March 2011What would a CO2-free atmosphere look like?
BP, First off, a "CO2 frequency-band effective temperature" is highly wavelength dependent, moving from even colder than 240 K at the center to even warmer than 240 K toward the wings, and with spectral overlap with the other GHG's. You wouldn't even be able to define how the temperature would change using your methodology for a doubling of CO2, since the "bite" in the spectrum by more CO2 doesn't really get deeper at the center. Secondly, CO2 absorbs in a much more important place in the spectrum than in other conceivable spectral domains, say, toward the far tail of the Planck function. The "no-feedback" temperature change is approximately RF/(4*sigma*T^3), where RF is the radiative forcing and the denominator is the derivative of the Stefan-Boltzmann equation for a blackbody. For T=255 K, the denominator is about 0.26 K/(W/m2), which allows you to approximate the traditional ~1 C temperature change for a CO2 doubling. In contrast, by removing all the CO2, the RF is even more so a real value is closer to 7 C. As Albatross noted, your estimates don't include feedbacks at all, either surface albedo or the water vapor feedback. -
Rob Honeycutt at 04:38 AM on 17 March 2011What would a CO2-free atmosphere look like?
BP... Don't you think it's just a little bit disingenuous to make a statement about Holocene variability compared to glacial periods by tossing up GISP2 data? You'd be more clear and accurate to say "Holocene variability above the Arctic circle..." The actual variability within the last glacial is not that much greater than the Holocene, and it's pretty well accepted (to my understanding) that Vostok is probably more indicative of global temperature than is GISP2. -
shoyemore at 04:29 AM on 17 March 2011Maximum and minimum monthly records in global temperature databases
Eric (skeptic), #39, Yes ... but ... this method is used in a variety of situations in healthcare and industrial monitoring. It has a rich literature in reliability engineering and survival analysis. For example, a study on asthma in a collection of sufferers may only collect the datum "onset of attack", rather than patient peak flow measurement. Monitoring of computer systems may collect the datum "alarm recorded" rather than voltage or current, or the error count rather than the errors. Analysis of these "time to event" data is quite complex .. Rigdon & Basu Statistical Methods for the Reliability of Repairable Systems is a good introduction. It would be wrong to assume that a discrete count measurement has a lesser statistical significance than a measurement on a continuous scale. It is true that the references approach the counting of records from a different viewpoint, but I found no references with an approach like this one. -
RickG at 04:24 AM on 17 March 2011CO2 lags temperature
trunkmonkey @ 297, I see a lot of hand waving but not a bit of supporting evidence to back up anything you said. -
Gilles at 04:13 AM on 17 March 2011Republicans to Repeal Laws of Physics
Marcus : i'm speaking of the integral over time (ultimate recoverable ). I don't see how Germany or California could have proved anything concerning the integral production of the whole world throughout the century. I explain further if it's still unclear : a country owns an oil field containing 100 Gbl. With no conservation, it would be exhausted in 30 years. Now thanks to great effort in the world, consumption has been divided by two, so after 30 years , it still remains one half of the initial content. Will it stop the extraction just because "if nothing had been done, it would have been exhausted now?" Of course not -first because we wouldn't have any idea of what would have happened "if ..." , and second because it would be completely silly to stop the extraction when a lot of people still need it. We don't stop NOW the extraction of oil just because the oil growth curve has been strongly reduced after the first oil shocks ! (it has.). Concerning the alleged attitude of 'recommending" to spoil FF, I defy you to find a single post from me where I would have said that. " There's a whole WIKIPEDIA page here about the Creationism/Evolution 'controversy', and scientists like Spencer would claim that the debate is worth having and, therefore, isn't settled. Do you agree ? " Spencer is not a biologist. Newton believed in alchemy, I don't. Evrything is not comparable. As a general scientist, I find that many criticisms concerning an undue faith in numerical simulations and uncertain reconstructions are founded,and Mcintyre has already made relevant criticisms that have been acknowledged by the community, and published reviewed papers (which is not the case of astrologists for astrophysicists or creationnists, to my knowledge). But my main criticism is not about the uncertainty of models, which is acknowledged even by climate scientists : it's about the unreasonable amount of FF that are needed in most scenarios -
Berényi Péter at 03:53 AM on 17 March 2011What would a CO2-free atmosphere look like?
#63 Albatross at 03:20 AM on 17 March, 2011 one can trigger a full snowball Earth with a sufficient reduction in atmospheric CO2 Perhaps one could. And a snowball Earth has much higher short wave albedo indeed. However, it has no bearing on our present situation. Area of ice covered surface is small relative to the entire surface in this interglacial, on top of that where there's ice there's no insolation for half a year. Therefore even if all the ice melted, the effect on global albedo would be negligible. Especially if low level clouds which tend to develop over ice free cold regions are taken into account as well. It just shows how fast climate sensitivity decreases with increasing temperatures. This is why Holocene temperature variability is an order of magnitude smaller than during glacial periods, don't you think?
-
Rob Honeycutt at 03:52 AM on 17 March 2011What would a CO2-free atmosphere look like?
BP... My point is that you're taking the same position as Lindzen and doing pretty much exactly what Lindzen did in front of the Congressional Subcommittee. Pulling a napkin out of your hat and saying, "Eh, I think would be about 2.5 degrees cooler" without hard research to back up the statement. Conversely, those who have done the hard research (Lacis, as mentioned above by Albatross) come up with completely different numbers. For me, napkin calculations just don't sway my opinion as much as published research. Now, if you could get that napkin worked up into a published paper then you (and Lindzen) might have something worthwhile to discuss. -
MattJ at 03:48 AM on 17 March 2011Maize harvest to shrink under Global Warming
This is why I keep telling people in various online forums: bad as nuclear power is, even a thousand Fukushimas will not cause as many deaths in misery and agony as our continued use of fossil fuels, especially coal, causes due to rising famine, war and pestilence. I try to phrase it better than that, though;) Of course, it is still quite an uphill battle, because the same "green instincts" that usually accompany taking AGW seriously, also find nuclear power repellent. Then there is the widespread fear of radioactivity simply because it is invisible and poorly understood. TEPCO's incompetence both in handling the disaster itself and in handling the public relations around it don't help, either. -
Chris G at 03:33 AM on 17 March 2011Republicans to Repeal Laws of Physics
Gilles, Regarding, "Lindzen , Pielke, Curry ... They may be wrong, but I'm not qualified to say that" So, it is an appeal to authority argument. Let's examine your authorities: Lindzen - Agrees that CO2 is a greenhouse gas and that more of it will change the thermodynamic properties of the earth, but believes through a bit of complicated math that the earth's climate will regulate itself and thereby prevent changes dangerous to us. This is despite a geologic record which does not give one the sense that the climate is inherently stable. He reminds me of the guy who "proved" that heavier-than-air flight was not possible; it is not clear what he thought of birds. Well, actually, there was more than one who believed this, but Lord Kelvin was one of them. My point is that Lindzen may be highly competent, but the evidence is against him. Peilke - I have no comment. Christy - He seems to be saying that either the observed warming is not really observed, and/or that we don't know anything because we don't know everything. Curry - I sometimes have trouble reconciling the different statements she makes, but that could just be me. In any event, she also has stated that the warming is real and that it is potentially dangerous. Her range of possibilities include some scenarios under BAU that are pretty much game-over situations. So, I don't believe that she is a good authority for supporting BAU. You are using an appeal to authority, and the vast majority of the authorities are against you. The only efficient way to stabilize the CO2 content of the atmosphere is to quit putting more into it. As I understand it, the current bill does not counter the findings of the EPA that higher levels of CO2 are dangerous, it just removes their ability to regulate CO2. The vast majority of authorities agree that things will get catastrophically bad if BAU continues until we run out of fossil fuels. Like Yul Brynner, at some point, we will quit using fossil fuels. The sooner we do that, the less chance we have of developing a fatal condition. The current bill would delay when we quit. -
trunkmonkey at 03:25 AM on 17 March 2011CO2 lags temperature
294. "the problem (as with a lot of problems in paleoclimate) is not finding a solution but that there are more solutions than the data can constrain." Sad but true. The only data that can really constrain anything come from the last sixty years and everything pre satellite is sketchy. Paleoclimate is really a logic excercise where you are lucky when the disparate signals from proxies give you a correlation. What is unique about the Antarctic ice core data (although the "down under" data point is less than ideal) is that they give us independent signals for both temperature and CO2 at the same time and in the same medium. I believe that the clear signal that temperature lead CO2 in these data is an extremely important clue that is not adequately explained by Milankovitch. Invoking Occam, we should probably suppose that temperature has lead CO2 for all of earth history, or at the very least in prior glacial episodes. -
Berényi Péter at 03:23 AM on 17 March 2011What would a CO2-free atmosphere look like?
#62 Rob Honeycutt at 03:08 AM on 17 March, 2011 I don't think even Lindzen has any research that backs that up I am not talking about Lindzen's research, but actual data and simple back of the envelope calculations. It does not show changes in surface temperature directly, it's about the temperature of terrestrial photosphere. However, if environmental lapse rate does not change dramatically, it should translate to a surface temperature anomaly of the same order of magnitude. -
Albatross at 03:20 AM on 17 March 2011What would a CO2-free atmosphere look like?
BP @61, "Of course it is a very crude approximation. The actual value can be anywhere between 2°C and 3°C." Quick, submit a rebuttal to Lacis et al. in Science, all based on a short bog post and a "very crude approximation"-- post normal blog science lives, and what is more we do not have to worry about the consequences of doubling CO2 b/c its effects on global SATs are minimal! Hang on though, first you might want to read their paper....I see no consideration for feedbacks in your "analysis" BP, other than the plants dying because they have no "food". From the main post, b/c you seem to have not read it: "There have been a number of studies which examine the evolution of the climate system with no CO2 in the atmosphere. Such experiments are described for example in Pierrehumbert et al (2007) , or by Voigt and Marotzke (2009). From these papers, one can trigger a full snowball Earth with a sufficient reduction in atmospheric CO2. A substantial reduction in water vapor (shown below, from Lacis et al (2010) as well as increase in the surface albedo are important feedbacks here, showing that removing the non-condensing greenhouse gases (mostly CO2) in the atmosphere can collapse nearly the entire terrestrial greenhouse effect. What’s more, since the albedo increases substantially, the total greenhouse effect can be thought of as providing even more than 33 K of warming relative to Earth’s blackbody emission temperature." -
pbjamm at 03:15 AM on 17 March 20112nd law of thermodynamics contradicts greenhouse theory
It would be very helpful if PhysSci would actually state his position and present his argument. If you are unwilling to do so until after you publish your paper then please wait til then to comment on it. -
Rob Honeycutt at 03:08 AM on 17 March 2011What would a CO2-free atmosphere look like?
BP... I don't think even Lindzen has any research that backs that up. It's little more than a bit of wishful thinking pulled from a tattered top hat that would justify his sloppy research. -
Albatross at 03:06 AM on 17 March 2011Republicans to Repeal Laws of Physics
Gilles, I have not read all of your rant above @157, I almost stopped when I read this fallacy posted by you: "Even McIntyre is a real statistician who knows his stuff." McIntyre is not a real statistician, and has been shown to not know his stuff. He is a conduit for misinformation and a lap dog for the Republicans, "skeptics", contrarians and those who deny AGW. He also has a personal vendetta against Dr. Mann. Finally, a source (referring to you quoting the IPCC), something substantive. The SRES scenarios are the best that we have, and thus far the projections have been on the conservative side, that is not encouraging, and not consistent with your opinion voiced here. Who to place more weight on, a contrarian on the web or the imperfect SRES? Easy, SRES and the work that has since been done since which Daniel Bailey linked us to above. "I think it's difficult only if you don't really listen to what I'm saying, but judge me with your prejudices." Nonsense, you have for all here exposed your bias, prejudices, so please do not project those onto me. In fact, it is you who is judging the IPCC and climate scientists with your prejudices and are failing to listen to the informed people both here and at RC. I am judging you on your inability to make a consistent, coherent and fact/science-based argument, and your inability to get your facts straight. No efficiency alone is not going to reduce GHG levels or net emissions, it is part of the wedge approach proposed by Pacala and Socolow. More science for the Republicans to ignore. Giles, I am not going to continue debating with you, and providing you a platform to perpetuate your misinformation. -
Berényi Péter at 02:57 AM on 17 March 2011What would a CO2-free atmosphere look like?
"An answer was provided by MIT scientist Dr. Richard Lindzen, who suggested that such a hypothetical removal of all the CO2 in the air would translate into a global cooling of about 2.5 degrees, presumably in Celsius" Yeah, that's about right. As you know effective temperature of a body is the temperature of a black body that would emit the same total amount of thermal radiation. Effective temperature of Earth as seen from outer space is about 255 K. This value does not depend on CO2, neither on any other GHG for that matter. It is entirely determined by the solar constant and the short wave albedo of the planet. We can also define effective temperature of Earth for a restricted frequency range like the main CO2 band between 18 and 22.5 THz (which includes the wings) the same way. Currently it is about 240 K. As for realistic temperatures (let's say between 220 & 290 K) a black body emits about 16% of its radiation in this frequency band, it means effective temperature of Earth outside the main CO2 absorption band should be some 257.5 K to still produce a 240 W/m2 overall OLR. Now, if we removed the carbon dioxide from the atmosphere, effective temperature inside and outside this band would both be 255 K, which is a decrease of 2.5°C. Of course it is a very crude approximation. The actual value can be anywhere between 2°C and 3°C. Not to mention the fact if we removed all the carbon dioxide, we'd kill plant life, which would change short wave albedo by eliminating evapotranspiration entirely. Fortunately there'd be no one to notice it, because with no food people are inclined to starve to death. -
Chris G at 02:51 AM on 17 March 2011Republicans to Repeal Laws of Physics
I thought this Dilbert would be appropriate, and perhaps provide some levity. -
Rob Honeycutt at 02:32 AM on 17 March 2011Skeptical Science nominated for Climate Change Communicator of the Year
Albatross... If I might add an analogy: Science, that is "real" science as done within scientific circles by professionals whose field of expertise is in the subjects they are researching, is like a wrestling match; like Greco-Roman wrestling. True tests of strength and agility. It uses clear rules that both sides abide by that assure fair play and legitimate measure of the best athlete. "Skeptic" (note the quotes) climate science as played out on blogs (i.e., WUWT) is the WWF. Sure, there is athleticism in the WWF (or WUWT). I would never begrudge that. But it's not a real test of athleticism (science). And similarly, WWF plays very well with the general public where Greco-Roman wrestling can hardly hold peoples attention unless they are directly involved somehow. -
SNRatio at 02:22 AM on 17 March 2011Maize harvest to shrink under Global Warming
While studies like this give strong indications, I would be very careful when it comes to actual estimation. Implying that we may have too little knowledge as of yet about how large the net effects will be. There are too many parameters which I think are not properly controlled here. Adaptations in genetics, growing techniques etc may to some extent mitigate. I would also be careful about generalizations. While there may be very good support for a claim that warming, all other factors held constant, will reduce crops, all other factors will not be held constant in practice. But extrapolating from past improvements is even worse, I think.. -
michael sweet at 02:03 AM on 17 March 2011And so castles made of sand fall in the sea, eventually
Idunno, I have seen several posters recently suggest sea level rise would stabilize the gas clathrates. The addition of 2 or 3 meters of water would only add a small amount of pressure. The temperature change is much more important in their stability. We are currently changing the temperature in a big way. I am 52 years old. Even a house in the Florida Keys (very low land near Miami) would be unlikely to be inundated in my lifetime. Decision makers like Dick Cheney, who is older and in poor health, do not care if Miami is inundated in 40 or 50 years. My students were excited about Inconvienent Truth and sea level rise when it first came out. When they realized that the projected 20 foot sea level rise would not occur for 100-250 years many said "my grandchildren can deal with it". -
chudiburg at 01:48 AM on 17 March 2011It's cooling
Thanks guys. I must have missed that we are in the midst of a la nina year. That explains some of the temporary cooling (compared to the last few years at least) I also liked the analogy about how much you grow in a day vs. a week/month/year. Keep up the good fight gentlemen. Cheers!Moderator Response: [DB] Cheers to you, too. BTW, Feb data is now available from the GISS link I provided earlier. -
les at 00:45 AM on 17 March 2011Republicans to Repeal Laws of Physics
Following on from 159 JMurphy/Gilles.... The "there is debate so the science isn't settled" argument is a real tell that someone really knows little about how science actually works. To illustrate. There was a fascinating paper in Nature the other week on olification. Really it's not clear - it turns out - which proteins process which molecules do smell, or how - shape or vibrational state. Vibration theory of olfaction .v. Shape theory of olfaction Yet no one goes round saying "smell isn't real" or "I'm not prepared to smell anything till the science is settled". The American legislature doesn't vote against perfume sales etc. etc. There is legislation that keeps down bad smells in various places. I've no doubt there are people who lobby for and against such things. The facts are that we can smell things. It's an objective, measurable (to some degree) fact. That we don't know how it works beyond any doubt is neither here nor there... The settledness of the science is immaterial. OK, compared to the climate; it's of less economic importance, impacts on peoples lives less... but that's not the point if you're arguing that "... so long as scientists debate... things are not settled". No. That is the attitude of someone who has never been closer to science than "The Cookie Monster Drop an Apple and Explains Newton" episode of Sesame Street. Real science is knee deep in uncertainties, debates and alternatives... which embed within a settled science.
Moderator Response:[DB] Another good example is the internal combustion engine. The fact that few people have any real idea how they work doesn't stop them from driving a car.
-
2nd law of thermodynamics contradicts greenhouse theory
Tom Curtis - Excellent and very clear explanation here at @563; thanks! -
RickG at 00:34 AM on 17 March 2011Skeptical Science nominated for Climate Change Communicator of the Year
Ken Lambert: Censors just keep deleting my replies - so I guess the message is that this site has put up the shutters and is only wanting to hear from the true believers. Considering recent posts by "PhysSci" I would suggest your claim has no support. Maybe your deletions have something to do with the comment policy. -
Arkadiusz Semczyszak at 00:33 AM on 17 March 2011The name is Bond...Gerard Bond.
@Tom Curtis I agree ... Information from Wikipedia might already be outdated. Changes may be slow. See here. Sorry is my "oversight" - should verify the information in Wikipedia. P.S. About my link - it’s refers to a global phenomenon that affects the Sahara. -
2nd law of thermodynamics contradicts greenhouse theory
PhysSci "Gentlemen, absorption and re-emission can only redistribute available energy, but cannot produce extra heat in the atmosphere needed to explain the near-surface thermal enhancement presently called atmospheric 'greenhouse effect'." PhysSci, that would be true if the climate were a static, fixed energy system. However, the climate is an open ended energy flow, not a static distribution. Energy will accumulate or dissipate based upon flow rates until input energy equals output energy. Given the limiting throughput of the atmosphere, there is more accumulated energy at the surface than the instantaneous flow rate, but that instantaneous flow rate of 240 W/m^2 enters the system and leaves it. Sorry, Tom Curtis, another analogy. PhysSci, water flows down a river, into a dam, and out the other side. The water is much deeper at the dam than in the upstream river, pressure at the bottom of the dammed lake is much higher than at the bottom of the river, but the flow rate in and out of the dam is equal, or the level at the dam will change until that is true. Your complaint is inappropriate for this situation. Sadly, PhysSci, it is becoming apparent to me that your grasp of the physics involved is not terribly strong. I suggest more reading on your part.
Prev 1863 1864 1865 1866 1867 1868 1869 1870 1871 1872 1873 1874 1875 1876 1877 1878 Next


