


 Arguments


Recent Comments
Prev 1864 1865 1866 1867 1868 1869 1870 1871 1872 1873 1874 1875 1876 1877 1878 1879 Next
Comments 93551 to 93600:
-
witsendnj at 00:29 AM on 17 March 2011Maize harvest to shrink under Global Warming
Maybe the results wouldn't be quite so surprising had the researchers factored two undisputed and well-established (although generally ignored) tenets into their calculations: 1. more heat = higher levels of tropospheric ozone and; 2. tropospheric ozone is toxic to vegetation - multiple international studies have conclusively demonstrated that at ambient levels ozone is already significantly (5 - 80%) reducing both crop yield and quality and that amount is expected to increase as climate change continues. http://witsendnj.blogspot.com/p/basic-premise.html -
Ken Lambert at 00:21 AM on 17 March 2011Skeptical Science nominated for Climate Change Communicator of the Year
Rob and Albatross Censors just keep deleting my replies ( -Snip- )Moderator Response: [DB] Your first response was deleted because it was a long comment filled with a multitude of topics found on many other threads. This forced a moderator response, as it amounted to a Gish Gallop. Subsequent complaints about moderation do not help, as you should well know. Comments that are succinct to the topic of the thread they are posted on which also comply with the Comments Policy receive no moderation. You are welcome to resubmit your individual points on the appropriate threads, with a summary response posted here pointing to each individual thread. This is how business is done here to keep the dialogue on individual threads on topic. And again, this is something you have been repeatedly counseled on. -
JMurphy at 00:03 AM on 17 March 2011Republicans to Repeal Laws of Physics
Gilles wrote : "My position is that as long as scientists debate, there is a debate. Lindzen , Pielke, Curry are NOT politicians or astrologists. Even McIntyre is a real statistician who knows his stuff. They may be wrong, but I'm not qualified to say that. I'm just observing that things are not settled." There's a whole WIKIPEDIA page here about the Creationism/Evolution 'controversy', and scientists like Spencer would claim that the debate is worth having and, therefore, isn't settled. Do you agree ? As for McIntyre, could you tell what you mean by him being a "real statistician" ? What do you base that on, considering that you don't feel qualified to judge ? Is it just fact that he (and a few others) are arguing from a minority position, therefore they must have a valid point somehow ? How have you determined that ? -
Lou Grinzo at 23:49 PM on 16 March 2011Maize harvest to shrink under Global Warming
johnd: I would say this study does tell us something we didn't know -- it quantifies the effects you mentioned. It's one thing to say "condition X is sub-optimal compared to condition Y" and quite another to know just what the impact is in change from Y to X. Surely various studies will arrive at different values -- look at the assessments of the life cycle carbon savings from ethanol, which are all over the map -- but given the implications for humanity and public policy, I would rather see us start soon with a possibly flawed set of studies and work (quickly) to improve them than to guess. -
johnd at 23:29 PM on 16 March 2011Maize harvest to shrink under Global Warming
Does this tell us anything that is not already known? Commercial croppers know the optimum growing conditions required for the crops they grow, and based on how seasonal conditions are progressing, and forecast, will adjust their sowing time accordingly. Grow out of season and the results will disappoint. Nor is the season ruled by the calender. This is why accurate forecasts are so important to croppers, and why many are prepared to pay private forecasters handsomely for a premium product. It is really no surprise that if the conditions change after sowing, or if the crop is sown late, that the yield will be effected. As for how the trials were conducted, I can't understand why they had to use data from local weather stations remote from the trial sites if these were properly controlled trials on research stations. The weather data should have been collected at the trial plots by those conducting the trial, especially if irrigation was being used, as it was. It has happened here in Australia where trial results have been invalidated because the rainfall data was collected from nearby stations, not from the actual trial location. I also don't understand this rationale behind this artificial adjustment if the trials were producing yields that could be physically measured- "The net effect of warming on yields was computed for each trial by artificially raising observed temperatures on each day by 1 °C, recomputing temperature indices such as GDD8,30, and using the regression equations to predict the new yield." Can someone explain the reason for having to do this? -
Arkadiusz Semczyszak at 23:23 PM on 16 March 2011Maize harvest to shrink under Global Warming
“... a new study demonstrating once again, that global warming will generally have a very negative impact on food production.” That conclusion is nothing “illegitimate” - optionally may apply only to maize and part of Africa. “Projected impacts relative to current production levels range from −100% to +168% in econometric, from −84% to +62% in process-based, and from −57% to +30% in statistical assessments.” (Climate change risks for African agriculture, Müller et al., 2011.) “Despite large uncertainty, there are several robust conclusions from published literature for policy makers and research agendas: agriculture everywhere in Africa runs some risk to be negatively affected by climate change; existing cropping systems and infrastructure will have to change to meet future demand.” Only this request has a strong scientific basis - but only for Africa. Interannual variability and climate sensitivity of Net Primary Productivity: a process-based multilayer-canopy vegetation model compared against observed tree-ring width, Bodin, Alton, and Krakauer, 2010.: “We estimate a global increase in NPP of 0.32% yr - 1 over the period 1951-2000. This is in approximate agreement with previous studies. Most of this increase can be attributed to CO2 fertilization rather than climate change.” Generally ... - this is the 0.32% NPP increase per year in the Positive. -
CBDunkerson at 22:54 PM on 16 March 2011And so castles made of sand fall in the sea, eventually
Daniel Bailey in #5: "Seize every chance possible over the next few years to unload low-lying real estate near the sea." I've often found myself wishing I could think of a way to 'invest' in the continuation of global warming... and encourage 'skeptics' to invest in its supposed non-existence. With those who deny the possibility of fossil fuel depletion you can invest in the alternative energy sources which must eventually replace them... though picking which alternatives will do so is still a gamble. For GW I suppose one could buy real estate along the 'future coastline', but again that would be a gamble in determining exactly where that will end up. Anyway, the underlying point is that I think we've arrived at a world where denial of reality is status quo for large sections of the population. One way of changing that would be if clinging to such irrational beliefs hurt them financially in a directly visible way. Currently the 'scam artists' get away with it because they can always divert blame elsewhere or change their stories as the situation changes. Make falling for these scams a direct hit on the pocketbook and they could no longer continue ad infinitum as they do now. -
Lou Grinzo at 22:50 PM on 16 March 2011Maize harvest to shrink under Global Warming
I'm glad to see SkS highlighting this information, because I think it's one of those "little details" that has immense implications. If you start with large, sustained (for now) CO2 emissions, you see a range of effects, some of which interact with each other, and most wind up in some way affecting humanity's ability to feed itself. Given the role that drought, rising sea levels (and the resulting salt water incursion into coastal farm land and wells), and population growth will have our situation, even a small decrease in our ability to grow a major food is a very big deal. -
Tom Curtis at 22:29 PM on 16 March 2011The name is Bond...Gerard Bond.
AS @20, if you want to trump the variety of papers I linked in suport of the slow drying of the Sahara, perhaps you coud find something more recent than a seminar in 1998 (the source of the Wikipedia claim). For your edication:_F3.jpeg) The onsite evidence clearly shows a gradual drying.
Your scientific link, by the way, does not discuss the drying of the Sahara.
The onsite evidence clearly shows a gradual drying.
Your scientific link, by the way, does not discuss the drying of the Sahara.
-
bananabender at 22:21 PM on 16 March 2011Greenhouse effect has been falsified
John Tyndall actually measured heating in carbonic acid solutions of various concentrations (CO2 dissolved in water) illuminated by gas flames. He didn't measure the absorbance of IR in purified gases. Knut Angstrom, an expert is solar radiation, proved that Arrhenius' calculations were wildly incorrect and based on an improper methodology. The fact that the Earth is warmer than the Moon simply proves that the oceans and atmosphere of Earth have an "atmospheric warming effect". It certainly doesn't prove the existence of a "Greenhouse Effect" due to CO2 or any other gas. All the planets(except Mercury which has no atmosphere) have an atmospheric warming effect that correlates directly with the pressure of the atmosphere. This is regardless of the actual atmospheric composition. The most important source of warming on Earth is the transfer of latent heat via evaporation and condensation. This is why coastal areas have far less variation between day and night temperatures compared with deserts. This is despite the concentrations of "GHGs" being the same. The satellite data simply shows that the Earth is radiating more heat. This can be caused by the upwelling of warm ocean water. It does not prove the existence of any Greenhouse Effect.Moderator Response:[Daniel Bailey] Angstrom's error was in treating the atmosphere as a single layer. Later studies (of which they are legion) conclusively show that portion of his work to be in error. The GHG effects of CO2 are considered established fact. For a more in-depth discussion, see here, here and here.
The remainder of your comment is in error. So I recommend that you also read Newcomers, Start Here and then learn The Big Picture. I also recommend watching this video on why CO2 is the biggest climate control knob in Earth's history.
-
idunno at 22:20 PM on 16 March 2011And so castles made of sand fall in the sea, eventually
Hi all, This is something of a repost. Sorry if the previous one contravened the guidelines. Looking at the graphs on Hansen 2011, linked by Daniel@4, page 6, it seems that there is a clear relationship between temperature, levels of greenhouse gases and sea level in the geological record. The fact that sea level rises with ocean temperature may well have been an important mechanism of the self-regulation of the biosphere's temperature. A rise in sea level applies a greater amount of pressure on the submerged deposits of methane clathrates and other methane hydrates dissolved within the water column. If the current warming proceeds too rapidly, the temperature may increase far more quickly than the corresponding increase in pressure, which will perhaps lead to a dangerous erosion of the clathrate stability zone. So, and I do not claim this is an expert view, merely a subject for discussion, it may just be that the rise in sea levels is currently dangerously slow. Dangerous because it could lead to a potentially catastrophic release of methane - CH4. -
Marcus at 22:13 PM on 16 March 2011Republicans to Repeal Laws of Physics
So what you're saying Gilles is that, because we can't 100% guarantee that improving efficiency will reduce total emissions (even though nations like Germany & States like California have proven that it does) that we shouldn't even try? Wow, talk about a defeatist attitude-the fossil fuel industry loves people like you. You're the kind of person that Stalin once described as a "useful idiot". I'll give you this iron-clad guarantee: improving efficiency & reducing the amount of energy we derive from fossil fuels will-at the very least-slow down the rate at which GHG emissions rise over the next century compared to the BAU approach that you seem to keep recommending. Of course, if we take a more realistic approach to population growth & restore some of our lost carbon sinks, we might actually get GHG emissions to levels lower than the current century. "I think it's difficult only if you don't really listen to what I'm saying, but judge me with your prejudices." No its not prejudice, Gilles-you claim not to be pro-fossil fuels, yet every comment you've made has been to effectively spruik the ongoing, inefficient use of fossil fuels for many decades to come. -
Arkadiusz Semczyszak at 22:08 PM on 16 March 2011The name is Bond...Gerard Bond.
#Tom Curtis Sahara “... and dissipated slowly in the period 5000 to 3000 before the present.” That's not true. wikipedia: “A curious discovery from the marine sediments is that the transitions into and out of this wet period occurred within decades, not millennia as previously thought.” A major widespread climatic change around 5300 cal. yr BP at the time of the Alpine Iceman Magny & Haas, 2004.: “It has possible equivalents in many records from various regions in both hemispheres dating to 5600–5000 cal. yr BP and corresponds to global cooling and contrasting patterns of hydrological changes.” Sahara is the result of synchronous global cooling for the SH and NH. -
Rob Painting at 22:06 PM on 16 March 2011CO2 lags temperature
Rick G -if you are going back pre-Quaternary you need to account for paleo-geography
And orography (mountain-building), and the rise of angiosperms (flowering plants). The climate models show some pretty marked cooling when these are accounted for. -
Arkadiusz Semczyszak at 22:05 PM on 16 March 2011The name is Bond...Gerard Bond.
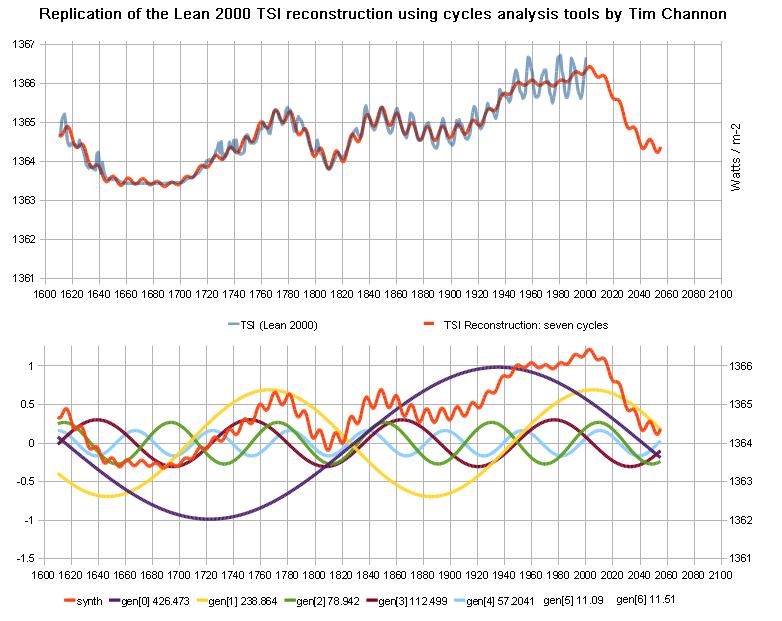
I was late to this interesting discussion. But II have to give a few remarks ... Wikipedia says: “Bond et al. (1997) argue for a climate cyclicity close to 1470 ± 500 years in the North Atlantic region.” I feel the most convincing explanation of the paper (with references the paper cited by Cambrun): Holocene climate variability in northernmost Europe, Allen et al., 2007.: “Time-series analysis of pollen analytical and sediment geochemical data indicates that each exhibits statistically significant periodic behaviour (at periods of ca 190, 410, 1050, 1650 and 1810 yr). The periods detected suggest this behaviour may reflect regional expression of climate system responses to solar variability and/or of effects upon tides and ocean circulation of periodic lunar orbital variation.” The Sun This figure (panel solar cycles) explains part of differences in the length and intensity of events Bond. I I also recommend this work: Linking solar forcing with climate and primary productivity changes in the Northeast Pacific: evidence from mid to late Holocene laminated sediments, Patterson et al., 2011. The Moon Impacts of late Holocene rapid climate changes as recorded in a macrotidal coastal setting (Mont-Saint-Michel Bay, France), Billeaud, Tessier and Lesueur, 2009.: “The sedimentary expressions of rapid climate changes vary according to the different subenvironments within Mont-Saint-Michel Bay; cycles, a few meters thick, can be correlated throughout the bay, and radiocarbon dating suggests that they have a millennial time scale. The various changes reflect an increase in wave dynamics in association with Bond cold events, possibly in conjunction with long-term (1800 year periodicity) tidal cycles.” It is worth noting that the solar cycle Hallstad - c. 2300 years - is about c. 500 years longer than the tidal cycles. The events of Bond - in the past - there asynchrony between NH and SH but in two points, however, we notice the coincidence. Both the end of the last glaciation and the optimum - the middle Holocene occur synchronously on the NH and SH (like the current warming). Here we see a periodicity of about six thousand. years. Most likely, the recently discovered solar cycle 6 thousand. years is so strong that it (through the effects of second-order?) - can be a superposition of cycles - equally affecting - globally at the same time - climate change in the SH and NH. The optimum climate synchronicity middle and late Holocene in both hemispheres-evidenced by numerous works on southern hemisphere (also shows warmth at the same time - NH): Antarctic ice cores, cave stalagmites, glaciers, alkenones in seabed cores off Chile, etc.. The latest paper I recommend: Ice core: Antarctic lakes suggest millennial reorganizations of Southern Hemisphere atmospheric and oceanic circulation, Hall et al. 2010.: “Here, we present new data from closed-basin lakes in the Dry Valleys region of East Antarctica that show high-magnitude, high-frequency oscillations in surface level during the late Pleistocene synchronous with climate fluctuations elsewhere in the Southern Hemisphere. These data suggest a coherent Southern Hemisphere pattern of climate change on millennial time scales, at least in the Pacific sector, and indicate that any hypothesis concerning the origin of these events must account for synchronous changes in both high and temperate latitudes.” Marine sediment core: Holocene Southern Ocean surface temperature variability west of the Antarctic Peninsula, Shevenell et al., 2011.: “On millennial timescales, abrupt SST fluctuations of 2–4 °C coincide with globally recognized climate variability8. Similarities between our SSTs, Southern Hemisphere westerly wind reconstructions9 and El Niño/Southern Oscillation variability10 indicate that present climate teleconnections between the tropical Pacific Ocean and the western Antarctic Peninsula11 strengthened late in the Holocene epoch.” -
Gilles at 21:56 PM on 16 March 2011Republicans to Repeal Laws of Physics
"Gilles @142, Nice try to reframe the argument, but I can only assume that those practices to which you refer (cherry-picking etc.) are those which have been engaged in by "skeptics" and contrarians, including those who have testified to Congress on behalf of the Republicans. So yes, I hope that you will join us in condemning the misinformation and distortion presented by the likes of Lindzen, Christy, Michaels, Pielke Snr and Monckton (their misinformation has been well documented here at SkS and elsewhere) to the US Congress and people of the USA. And that is before we have dealt with the so-called "post-normal science" crowd, whose scientific misconduct has been well documented and is the subject of at least one investigation." My position is that as long as scientists debate, there is a debate. Lindzen , Pielke, Curry are NOT politicians or astrologists. Even McIntyre is a real statistician who knows his stuff. They may be wrong, but I'm not qualified to say that. I'm just observing that things are not settled. " "SRES scenario have no predictive power, they are not based on known and validated laws, they have no associated probability - it is just some set of possible histories, which may all be quite unlikely." Wow, if you wish to have any credibility, at least try and back up your beliefs with some substance, citations, and science. This kind of vacuous arm waving serves no purpose. And yet you somehow feel free to accuse others of not quantifying the probability?.... " well , I suppose that IPCC is a valuable source ? http://www.ipcc.ch/ipccreports/sres/emission/index.php?idp=25 "Scenarios are images of the future, or alternative futures. They are neither predictions nor forecasts. Rather, each scenario is one alternative image of how the future might unfold. A set of scenarios assists in the understanding of possible future developments of complex systems. Some systems, those that are well understood and for which complete information is available, can be modeled with some certainty, as is frequently the case in the physical sciences, and their future states predicted. However, many physical and social systems are poorly understood, and information on the relevant variables is so incomplete that they can be appreciated only through intuition and are best communicated by images and stories. Prediction is not possible in such cases " blah, blah , blah .... " How do you reconcile this statement made by you: "Most SRES scenarios were already wrong when they were published, because the fuel consumption in the 90's was already greater than their prediction"" With your claim that "560 may be reachable in the far future - I don't think that it will be a catastrophe either." " just because there is no obvious link between a current growth rate and an ultimate integral value. " Well, it is difficult to keep track of your position on this amongst all the arm waving. OK, so we agree that the EPA should be permitted to regulate GHG emissions which will reduce FF consumption and pollution." I think it's difficult only if you don't really listen to what I'm saying, but judge me with your prejudices. Again : Improving the EFFICIENCY doesn't insure that we will reduce the total emission rate, and even limiting the RATE of GHG emission doesn't insure at all that we'll limit the INTEGRATED AMOUNT of GHG. Do you agree at least with this assertion ? -
Eric (skeptic) at 21:56 PM on 16 March 2011Maximum and minimum monthly records in global temperature databases
I don't think the three references are applicable (although they are a related topic). The first paper had a dead link, but I found a paper by Benestad in 2004 http://regclim.met.no/results/Benestad_GPC2004.pdf that may be similar. The datasets in the papers have a lot more points to derive a statistical trend. When you used only one GAT series (one reading per month) instead of many readings per month used in the papers, your result has less statistical signifigance and reflects some global biases such as ENSO popping records at a higher rate in the 90's. OTOH, the benefit of using GAT is that UHIE has been accounted for. -
RickG at 21:41 PM on 16 March 2011CO2 lags temperature
scaddenp: ...the orbital variations have probably been constant as long as there has been life on earth, yet glacial periods are exceptional in earth history.We're just lucky I guess? If you are going back pre-Quaternary you need to account for paleo-geography, i.e., continental drift. If you don't have a continental mass at the poles or at least enclosed around a pole as is present day, it is not likely an open ocean is going to freeze. Further consideration would be different ocean circulation and a dimmer sun. -
Rob Painting at 21:24 PM on 16 March 2011Maize harvest to shrink under Global Warming
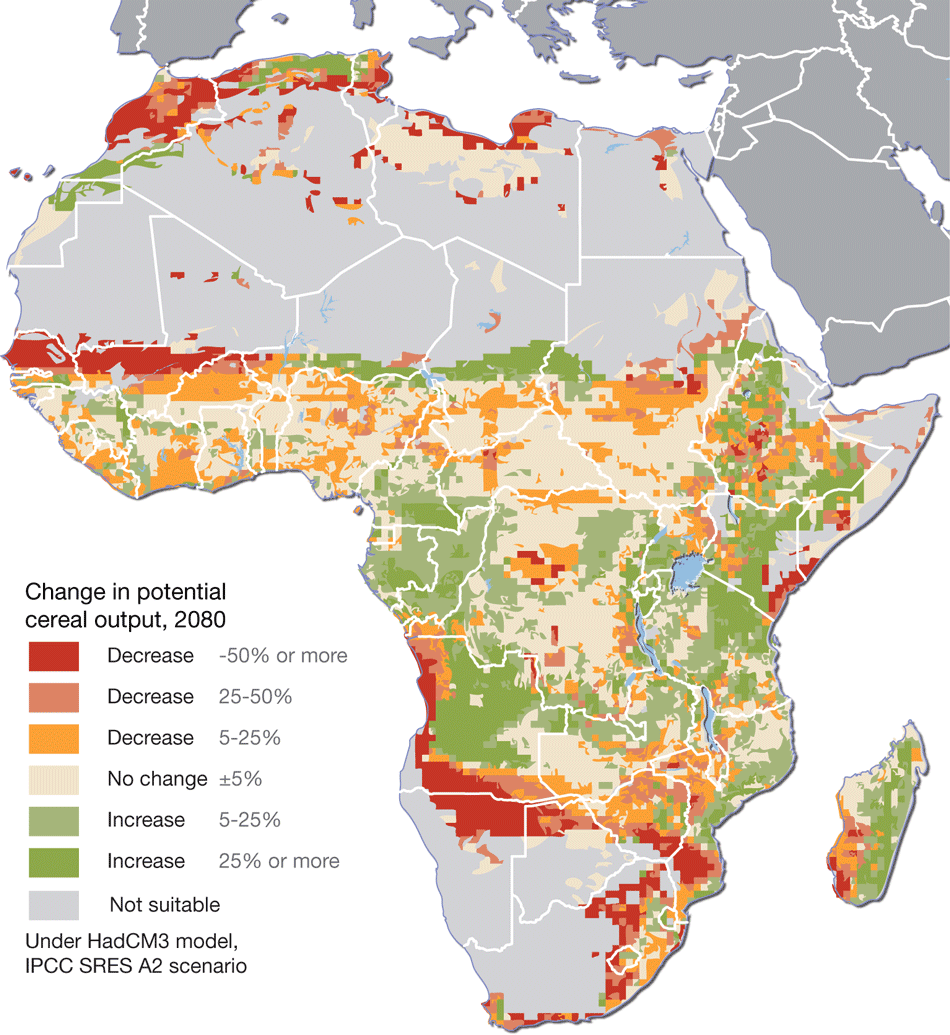
Adelady - Thanks for pointing that out. Some glitch that inserts extra characters into the link, so I can't fix it. I've deleted the link, and MichaelM has kindly provided the map I was attempting to highlight. cloa513 - Not sure what your point is. Bern - Clearly the picture will be different with changing rainfall patterns, however allowing only for temperature, yield declines and this is amplified by drought. Heat seems to affect the reproductive (flowering) process. The authors also point out the trials used artificial (nitrogen) fertilizers, whereas most African farmers don't. Under nitrogen stress (the typical African farm) the response to heat & drought is reduced. The end result being the trials slightly exaggerate the stress response. -
MichaelM at 20:44 PM on 16 March 2011Maize harvest to shrink under Global Warming
Until the 'dotted link' is fixed here it is. -
adelady at 20:36 PM on 16 March 2011Maize harvest to shrink under Global Warming
The 'dotted' link took me on a very convoluted trip to nowhere. -
MichaelM at 20:14 PM on 16 March 2011Maximum and minimum monthly records in global temperature databases
h pierce #35 I would suggest that you consider what we mean when we say that in the UK the average family had 2.4 children in 1964 and now has 1.9. By your reasoning and using your non voodoo statistics this is wrong since we cannot measure a 1/10 of a child. Implicit in discussions of global temperature changes is the term 'average' so when you see temperature I suggest you stop thinking of individual measurements and think of thousands. Have look at the wikipedia page on sampling. -
scaddenp at 19:48 PM on 16 March 2011CO2 lags temperature
Under "recent" times, CO2 levels have been much higher. Geological processes gradually remove CO2. When CO2 is above a certain level, you dont get a glacial cycle because its always warm enough to prevent ice build up and the feedbacks that amplify the glacial cycle. While the global forcing is very weak, the forcing at 65 is rather stronger. Land and altitude allow ice sheet build up in the NH. The 100,000 cycle IS a puzzle, but the problem (as with a lot of problems in paleoclimate) is not finding a solution but that there are more solutions than the data can constrain. Yes, there are missing pieces but the overall mechanism is understood. -
shoyemore at 19:09 PM on 16 March 2011Maximum and minimum monthly records in global temperature databases
From Peru #30, Alexandre #15 had the same problem but it went away. Try refreshing the page. Not sure what the cause is. I must be the only one using imageshack to store my charts. -
shoyemore at 19:07 PM on 16 March 2011Maximum and minimum monthly records in global temperature databases
#34 Charlie A, Figure 2 is the cusum plot, with expected centering and expected symmetry about 0. This is actually what happens 1880 to 1940s, giving rise to the suspicion that what was going on back then was natural variation. -
h pierce at 19:03 PM on 16 March 2011Maximum and minimum monthly records in global temperature databases
ATTN: Chris Thank you for your response! An organic chemist, I isolate, identify and synthesize insect pheromones, and I don't know much about or use stats. However I do make measurements and know the rules re significant figures. Chris says: There are thousands of thermometers each taking at least a couple of readings a day for decades; a few tenths of a degree difference is easily distinguishable from noise. If the resolution of the therometer is +/- 1 deg F and data is recored to the nearest whole degree, then any mean computed from that data is rounded to the last signicant figure of the measurement. This is what I have taught Chem 101 lab students for years Your claim that "a few tenths of degree difference is easily distinquishable from noise" is obtained by voo-doo statistics and nobody really believes this. If you want to _know_ temperature to +/- 0.1 deg C, you use a therometer that has that resolution and is properly calibrated. What is your opinion of my proposal for computing "weather noise"Moderator Response: You need to augment your knowledge of the rules re significant figures, with knowledge of the law of large numbers, which increases accuracy as the sample size grows. -
Bern at 18:58 PM on 16 March 2011Maize harvest to shrink under Global Warming
cloa513 @1: Your comment comes across as if you're just making stuff up, to be honest, to try and de-value this study. The bar to get a study into Nature is quite high, and if the authors had ignored such factors, it's unlikely the review process would have let the paper through. I think the point to take away is that this was a study of real-world conditions - it just so happens that the variety of climates where the crops were trialled allowed the researchers to estimate what would happen in the event of warming. I.e. how does the yield vary between an area with mean growing season temperature of X ºC, compared to one with mean temp of (X+1) ºC. I also assume that variances of rainfall etc were controlled as far as possible when making the comparison. Having said that, a 1ºC increase in global temps may significantly change rainfall patterns, so there are still plenty of caveats, I imagine! -
Riduna at 18:51 PM on 16 March 2011And so castles made of sand fall in the sea, eventually
Daniel @ 3 Thank you for reminding us that Dr Weiss study is on imp[act. Odd then that the impact on the New England States, particularly the New York/Jersey City conurbation, is not shown. In my article I showed that a 2.5m SLR would have the most dire effects, crippling NY and causing such dislocation as to make much of the city non-functionable and unliveable. Then there are the effects on cities such as Boston, Baltimore, DC. At 2.5m SLR they do not bear thinking about and if Hansen is right (he usually is), socio-economic destruction is inevitable. Further, there is no defence against SLR. No map, no discussion. Pity.Moderator Response: [DB] See the update section in the post at top. I'll have another post coming out in about a day similarly addressing other parts of the world. It will also include larger-scale renditions of sea level rise impacts on the cities you mention.Edit: Post available here.
-
cloa513 at 18:37 PM on 16 March 2011Maize harvest to shrink under Global Warming
What were actual conditions the crops were growing under- average temperature is useless descriptive of conditions. So you fried it under 40C and then froze under 0C so it didn't do well. Average 20C. -
Tom Curtis at 17:43 PM on 16 March 20112nd law of thermodynamics contradicts greenhouse theory
PhysSci @561, I am not in general going to respond to your comments, which I consider to be little more than spam. If you want to discuss the issue, mount an argument, don't snipe, then hide behind an as yet unpublished paper. However, in this case you are clearly only partially correct. Specifically, if back radiation tends to heat the surface beyond the temperature dictated by the lapse rate, convection will increase, cooling the surface. As a result, except for short term excursions (ie, over a few hours or in some cases days), back radiation is not very significant in determining average surface temperature. However, back radiation can lift surface temperatures up to the temperature determined by the lapse rate without the heat being dissipated by convection. This is an important effect in temperate zones and the poles where outgoing longwave radiation is greater than incoming short wave radiation. More importantly, this effect is very well known to atmospheric physicists and is part of the full explanation of the greenhouse effect as expounded in elementary textbooks (although it does get passed over in many popular science accounts). -
Bern at 17:37 PM on 16 March 2011And so castles made of sand fall in the sea, eventually
Daniel @ 5: I guess that's another one of those tipping points - although in this case, it will be a socio-economic one, when society at large starts to fully appreciate the implications of climate change. A quick google search reveals a news article claiming Australia stands to lose at least $150 billion worth of real estate value as a result of 0.9m of rise (number supposedly sourced from the insurance industry - and they note it's not covered by insurance!). That'd pay for the replacement of a whole lotta coal-fired power stations...Moderator Response: [DB] Check out the maps of Australia I include on the next post on this subject (see next comment response for teaser info). -
Tom Curtis at 17:34 PM on 16 March 20112nd law of thermodynamics contradicts greenhouse theory
Climate_Protector, you indicated that with the low concentrations involved, the GHG must have a very powerful effect. They do not have a powerful effect per molecule, but a lot of molecules are involved. As to who powerful, this is a graph of the absorption of IR by CO2 travelling through 1 meter of atmosphere at sea level at the wavelengths where it is strongest as an absorber of CO2 (courtesy of Science of Doom): And so you can see the same thing with your own eyes:
Please ignore the comment at the end of the video about "That's exactly how CO2 works in the atmosphere ..." which, as we discussed above, presents only half of the equation.
And so you can see the same thing with your own eyes:
Please ignore the comment at the end of the video about "That's exactly how CO2 works in the atmosphere ..." which, as we discussed above, presents only half of the equation.
-
Tom Curtis at 17:26 PM on 16 March 20112nd law of thermodynamics contradicts greenhouse theory
CP @552: 1) Your guess is correct. The vast majority of the GH effect is caused by CO2 and water vapour. As it happens, concentrations of water vapour fall to a level where IR radiation can escape to space in its most strongly absorbing frequencies at an altitude of about 5 km. For CO2, that altitude is about 8 km. That means the IR radiation escaping to space comes from a source about 30 degrees cooler than the surface for the frequencies where water vapour is a strong absorber of IR radiation, and about 42 degrees colder for frequencies where CO2 is a strong absorber (including in that part where it overlaps with H2O). The reason the troposphere cools with altitude is because of the rate air heats (or cools) due to compression (or expansion) as it falls (or rises) in the atmosphere. Because air is cooled as it rises by expansion, and heats as it falls through compression, this establishes a stable rate of temperature change with altitude (the lapse rate) such that, if the atmosphere lies near that rate, it will not tend to rise or fall, and if it is far from that rate, it will tend to rise or fall until it is close to it. That rate is a function of the gravitational acceleration and the specific heat capacity of the gas involved. 2) The actual enhancement is greater than 33 degrees C, but the exact amount is difficult to determine, for reasons I discussed @464 on this thread. 3)The following is a graph of the H2O concentrations in the atmosphere at 100% humidity at various temperatures: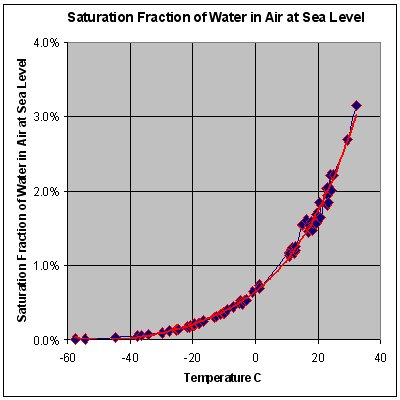 You can see that a typical concentration would be between 0.5 and 1% (approx. 33 to 66% humidity at 15 degrees C) but it can rise much higher and go much lower. You should also note that because the concentration falls sharply with falling temperature, H2O concentrations fall sharply with altitude. That is why its effective altitude for radiation to space is lower than that for CO2. It also means CO2 is relatively speaking a far more important green house gas at the poles than at the equator (where water vapour is more dominant).
-
PhysSci at 17:09 PM on 16 March 20112nd law of thermodynamics contradicts greenhouse theory
The key to understanding the GH effect is NOT radiative transfer ... -
PhysSci at 17:07 PM on 16 March 20112nd law of thermodynamics contradicts greenhouse theory
Did you know that convection can offset the potential warming by back radiation. If you try solving the radiative transfer simultaneously with convective heat exchange, you will see that convection can neutralize the entire effect of back radiation! -
PhysSci at 17:02 PM on 16 March 20112nd law of thermodynamics contradicts greenhouse theory
Gentlemen, absorption and re-emission can only redistribute available energy, but cannot produce extra heat in the atmosphere needed to explain the near-surface thermal enhancement presently called atmospheric 'greenhouse effect'. That why the key question is the one I asked in 558. -
Tom Curtis at 16:55 PM on 16 March 20112nd law of thermodynamics contradicts greenhouse theory
RW1 @553, the total IR radiation from the atmosphere to space is 199 w/m^2. Of that, 6.4 w/m^2 will have been transported to the atmosphere by thermals, 29.2 would have been absorbed SW radiation, and 29.9 would have been carried into the atmosphere by convection. -
PhysSci at 16:53 PM on 16 March 20112nd law of thermodynamics contradicts greenhouse theory
Also, think about what might be contributing to the internal energy of the atmosphere (particularly the lower troposphere) besides the Sun? In other words, is there another factor that can enhance the kinetic energy of air beyond the level supported by the absorbed solar solar radiation)? -
trunkmonkey at 16:49 PM on 16 March 2011CO2 lags temperature
scaddenp, the orbital variations have probably been constant as long as there has been life on earth, yet glacial periods are exceptional in earth history.We're just lucky I guess? The orbital insolation variation is miniscule, on the order of a tenth of a Watt per square meter, and its 100000yr signal matches only rather crudely the glacial-interglacial periodicity.I sense were working a puzzle with missing pieces. -
Tom Curtis at 16:48 PM on 16 March 20112nd law of thermodynamics contradicts greenhouse theory
RW1 @547: "All I'm saying is an increase in CO2 concentration will increase absorption in the CO2 absorbing bands, yes, but this does not necessarily mean all of the other absorbing bands will remain constant, especially at various levels of the atmosphere where their concentrations can vary (H20 in particular). That increased CO2 will decrease total transmittance through the whole atmosphere not definite by any means - just seemingly probable." Not only probable, but observed, as shown in this plot of the differences in brightness spectra for various wavelengths between 1970 and 1996: So, not only is your proposition extremely improbable, it is known to be false from observation.
-
PhysSci at 16:40 PM on 16 March 20112nd law of thermodynamics contradicts greenhouse theory
What about the strength of the 'greenhouse' effect? Anybody agree that its 133C increase of surface temperature, and not 20 or 33? -
PhysSci at 16:35 PM on 16 March 20112nd law of thermodynamics contradicts greenhouse theory
What's important to realize here is that air temperature is a direct function of the internal energy of the atmosphere at any level, and IR emission is a product (result) of that temperature, not the other way around! So in the chain of cause and effects, the sequence is: Internal energy --> temperature --> IR radiation. -
PhysSci at 16:27 PM on 16 March 20112nd law of thermodynamics contradicts greenhouse theory
II see that the focus is now on the excess internal energy in the lower troposphere. Does this mean that everyone agrees that solar input alone cannot account for that additional energy? -
dana1981 at 15:53 PM on 16 March 2011Indonesian translation of The Scientific Guide to Global Warming Skepticism
That's an impressive list of languages!Response: I forgot to say, Icelandic is also on the way... -
RW1 at 15:30 PM on 16 March 20112nd law of thermodynamics contradicts greenhouse theory
Tom Curtis (RE: 548), "As it happens, the atmosphere radiates 37.4% (199 w/m^2/532 w/m^2) of its energy to space, and 62.6% to the surface (333 w/m^2/532 w/m^2). That means it radiates 37.4% of the energy it receives by convection to space, and 37.4% of the energy it receives by evapo/transpiration to space, and 37.4% of the energy it absorbs directly from the sun to space, and 37.4% receives as IR radiation from the surface to space. It follows also that 33% (175 w/m^2/ 531 w/m^2) of back radiation comes from energy introduced to the atmosphere other than by absorbing IR radiation from the surface." What? How can the atmosphere radiate 199 W/m^2 to space from thermals and evaporation when it only moves 97 to the atmosphere? -
Climate_Protector at 15:28 PM on 16 March 20112nd law of thermodynamics contradicts greenhouse theory
Tom Curtis @ 548: Yes, thank you! This explanation is much better (for my level of understanding at least)! A couple more questions, though: 1) Why does the atmosphere radiate 67% more IR energy to the surface as it does to space? My guess is because temperature decreases with height (at least in the troposphere), but then what's causing the temperature to drop with altitude? Is is the decrease in water vapor concentration? (because I think CO2 profile is pretty uniform throughout the troposphere, correct?). Bur water vapor amounts in the air depends on temperature. So what's driving what? 2) What is the actual enhancement of the surface temperature due to presence of GH gases, i.e. the greenhouse effect? This question relates to the comment in my previous posting about the amount of absorbed solar radiation in the absence of atmosphere and clouds. About GHG concentrations, I just found a number about the average H2O vapor concentration in the air - 0.25%. Does this sound right? So that means that the mean concentration of all GH gases is about 0.5% or less, correct? ... It's amazing how this minute amount is able to warm the planet to such an extend!! This means the efficiency of redirecting of IR energy towards the surface by GH gases is quite high! -
2nd law of thermodynamics contradicts greenhouse theory
Climate_Protector - Please keep in mind that the overly simplified example I gave was a Gedankenexperiment, intended to describe the important of certain aspects of the climate system if everything else is held fixed. If the Earth were at -17C, we would have a "snowball Earth", extremely high albedo from ice sheets, and the final state would be much much colder. That doesn't matter for the point of a GHG reducing effective emissivity. Suffice it to show that we would be hugely colder without it, and that energy levels can be higher at the surface than incoming values depending on how effectively the energy leaves. As to the values I gave: 100% - 80% = 20% passing through without absorption. Half the 80% (40%) radiates up as well, so upward radiation is 20%+40% = 60% of 240, or 144. The difference between incoming and outgoing is 96, so this cannot be a stable state. Given the (toy) numbers I gave, with 60% of surface going out to space, 240 / 60% * 100% = 400. That's a stable number. Again - that was an overly simplified example to demonstrate the principle. Actual calculations are done line by line modeling 50+ layers of the atmosphere, incorporate convection and latent heat, and multiple greenhouse gases with different altitude distributions such as H2O and CO2. It's the difference between a high-school physics experiment discussing spherical frictionless objects, and a numeric integration of a complex function. --- Opacity is a straight blockage of light, which may or may not result in some thermal radiation at possibly different wavelengths - Absorption/Emission are thermal radiation terms, directly related, and absorption/emission spectra are equal at thermal equilibrium. Opacity is the wrong physical term. -
2nd law of thermodynamics contradicts greenhouse theory
Tom Curtis - You are, of course, quite correct about analogies getting pushed too far. An analogy is find for explaining some aspects of a complex system in terms the listener may understand, but overextending the analogy invariably hits the limits where the analogy no longer corresponds to the complex system. Analogies are useful for explaining forward, not reasoning/disproving backwards. That can only be done in the original, complex system with all the interactions. Still, it's a bit faster to give an analogy than to attempt a first semester thermodynamics course in a blog post... -
Climate_Protector at 14:42 PM on 16 March 20112nd law of thermodynamics contradicts greenhouse theory
KR @ 543: Sorry, for asking these additional questions, but I'm really trying to understand this. 1) I remember reading somewhere that this 240 W m-2 planetary absorbed solar flux includes the effect of a 30% albedo. This is Earth's actual reflectivity. So, if we are talking about Earth without an atmosphere (with emissivity of 0.98) as you suggest, then isn't it more appropriate to consider a much lower albedo in our calculations, because removing the atmosphere (or even only the water vapor) means getting rid of all clouds as well? And, I think clouds were contributing well over half of the earth albedo (not quite sure). So, an Earth without an atmosphere (or without water vapor in the atmosphere) would have an albedo of say 12-15%, correct? This implies a significantly higher absorption of solar radiation, hence higher 'black-body' temperature in the absence of water vapor (or an atmosphere). How would that change your calculations? 2) I did not quite understand, why the energy emitted back to space would be only 60% of the total 240 W m-2 originally absorbed by the system? I thought, in equilibrium, the amount of absorbed solar energy must equal the amount of emitted IR radiation to space. What happens with the 96 W m-2 imbalance? Where does this energy go? Also, in 545 you say that atmospheric opacity is not the same as emissivity, and opacity would stay constant while emissivity decreased with the addition of GH gases. This really cinfuses me, because I thought that emissivity/absorptivity is a measure of opacity - higher absorptivity resulting from more GH gases would cause higher opacity to long-wave radiation. What I did not understand? -
Tom Curtis at 14:33 PM on 16 March 20112nd law of thermodynamics contradicts greenhouse theory
CP @535, the atmosphere does not distinguish between the sources of energy when it radiates. As it happens, the atmosphere radiates 37.4% (199 w/m^2/532 w/m^2) of its energy to space, and 62.6% to the surface (333 w/m^2/532 w/m^2). That means it radiates 37.4% of the energy it receives by convection to space, and 37.4% of the energy it receives by evapo/transpiration to space, and 37.4% of the energy it absorbs directly from the sun to space, and 37.4% receives as IR radiation from the surface to space. It follows also that 33% (175 w/m^2/ 531 w/m^2) of back radiation comes from energy introduced to the atmosphere other than by absorbing IR radiation from the surface. The reason the GH effect is attributed to intercepting IR radiation from the surface is because simplified models are used to explain the concept. It is correct, but only provides part of the more complete explanation. The complete explanation is that GHG intercept some of the IR radiation from the surface, but replace it with their own IR radiation. Because the gases are cooler than the surface at their level of effective radiation to space, the IR radiation they produce is less energetic than that which they intercepted. The difference between the energy emitted by the atmosphere to space (composed of energy drawn from a variety of sources, as per the diagram) and the the energy from the surface makes the radiation of energy to space less efficient, thus warming the surface. So, the key terms from the diagram for the greenhouse effect are: 1) The surface IR radiation intercepted by the atmosphere (356 w/m^2); and 2) The IR radiation from the atmosphere to space (199 w/m^2). The difference between these two, a reduction of IR emission to space of 157 w/m^2, represents the loss of efficiency in reradiating energy to space, which in turn results in a warmer surface. Please note that I am not disagreeing with KR (@538 & 543). He, however is using two analogies which I dislike because they are misleading if pushed, and people always push analogies. The problem with the blanket analogy is obvious. For example, your natural push of the analogy to suggest GHG reflect IR radiation is natural given the analogy, but incorrect in fact. With regard to emissivity, increasing GHG increases the emissivity of the atmosphere, but decrease the emissivity of the Earth as a whole because the atmosphere is colder than the surface so the net radiation is initially reduced. So talking about reduced emissivity of the Earth is not wrong, but is very prone to confusion. @ 537: The proportion of GHG in the atmosphere excluding water vapour is very small. The largest proportion of it is CO2 with an atmospheric concentration of approx 0.4%, with other GHG having much smaller concentrations. Water vapour on the other hand can very between around 6% (from memory) and 0.01% of the atmosphere. Crucially, water vapour concentrations at high altitudes are very low, so at those altitudes in the frequencies in which CO2 absorbs IR, CO2 is the dominant GHG. Outside those frequencies, H2O tends to dominate.
Prev 1864 1865 1866 1867 1868 1869 1870 1871 1872 1873 1874 1875 1876 1877 1878 1879 Next


