


 Arguments


Recent Comments
Prev 1865 1866 1867 1868 1869 1870 1871 1872 1873 1874 1875 1876 1877 1878 1879 1880 Next
Comments 93601 to 93650:
-
scaddenp at 14:32 PM on 16 March 2011CO2 lags temperature
trunkmonkey, I am not sure I follow. The ice-age is driven by orbital forcings. When the forcing changing to negative, then feedbacks work the other way pulling CO2 out of atmosphere. There is no "run-away" to pre-Pleistocene atmosphere (see here for more on run away feedback). It seems to me that you are postulating an unknown in ice-age model that doesnt exist. -
RW1 at 14:28 PM on 16 March 20112nd law of thermodynamics contradicts greenhouse theory
KR (RE: 545), "Ah, but basic physics tells us that it does. Emissivity (not opacity) decreases as GHG's increase, widening and deepening absorption bands, the observed satellite emission spectra matching the physics predictions, temperature must increase in response for a stable state emitting as much power as comes in, QED." I don't really want to argue. All I'm saying is an increase in CO2 concentration will increase absorption in the CO2 absorbing bands, yes, but this does not necessarily mean all of the other absorbing bands will remain constant, especially at various levels of the atmosphere where their concentrations can vary (H20 in particular). That increased CO2 will decrease total transmittance through the whole atmosphere not definite by any means - just seemingly probable. -
RW1 at 14:14 PM on 16 March 20112nd law of thermodynamics contradicts greenhouse theory
Tom Curtis (RE: 497), "To finish, Trenberth, Khiel and Fasullo are not obfusticating by indicating some SW radiation is absorbed in the atmosphere. They are describing an indirect emperical result, and one that is more easily determined than, for example the proportion of SW light reflected from clouds, or from the surface. The method is to measure downward SWR at the Top of the Atmosphere, upward SWR at the TOA, and subtract the later from the former. You then measure downward SWR at the surface, and subtract that result from the difference; giving you the amount of SWR absorbed. (Clearly the measurements need to be made at a large number of points and times to determine a global average.) T,K, & F (2009) list a summary of such mesurements on table 2b. It is a telling indictment of your "science" that you cannot use standard definitions correctly, and have to dismiss observational results as "obfustications". Your missing the point, and that is of the 396 W/m^2 radiated from the surface, Conservation of Energy dictates that 239 W/m^2 of if has to come from the Sun because the atmosphere cannot create any energy of its own. Yes, all 239 W/m^2 does not get to the surface as direct SW, but it gets there one way or another. Ultimately, this means the remaining 157 W/m^2 of the 396 W/m^2 emitted at the surface has to come from 'back radiation' from the atmosphere. Trenberth's depiction obfuscates this, which - along with total transmittance, is the most crucial aspect of the entire greenhouse effect. The net effect of all the other components is zero. -
2nd law of thermodynamics contradicts greenhouse theory
RW1 - "You're assuming atmospheric opacity will increase and the rate at which energy can escape will decrease with rising CO2 levels. It may, but it also may not." Ah, but basic physics tells us that it does. Emissivity (not opacity) decreases as GHG's increase, widening and deepening absorption bands, the observed satellite emission spectra matching the physics predictions, temperature must increase in response for a stable state emitting as much power as comes in, QED. That's an observation, not an assumption. An unsupported statement of "...but it also may not" is not science. The level of feedbacks is another topic entirely, Climate Sensitivity. This thread is on the existence of the radiative greenhouse effect (RGE), hence the direct forcing, and the foolishness of claiming that the RGE violates thermodynamics. -
RW1 at 13:45 PM on 16 March 20112nd law of thermodynamics contradicts greenhouse theory
KR, "It's insulation, pure and simple. And the more insulation between a constant input and a cold sink, the hotter the final temperature of the heated object." Except the "insulation" is not made up of one substance or even a constant mix of all the individual substances. If one of the substances changes, it could trigger changes in the other substances - making the net effect very difficult to determine. You're assuming atmospheric opacity will increase and the rate at which energy can escape will decrease with rising CO2 levels. It may, but it also may not. -
2nd law of thermodynamics contradicts greenhouse theory
Climate_Protector - The atmosphere receives energy by convection, but that only moves energy from the warm ground to the cooler air. Here's a very simple example describing emissivity. First, start with the Stefan Bolzmann equation. Power radiated depends on temperature (to the 4th power) and emissivity. In order for the energy of the Earth to be stable, it must radiate as much energy as it receives. It receives 240 W/m^2 from the Sun. If there were no GHG's, the S-B equation indicates that the temperature of the Earth, with an emissivity of 0.98, would be about -17°C (256.15°K), or chilly. For toy purposes, assume the Earth has an emissivity of 1.0 (close enough to 0.98). Add an atmosphere of greenhouse gases. Assume the GHG's absorb (say) 80% of that, and re-radiate it. Half goes up, half goes down - only 60% total of the 240 W/m^2 goes to space, or 144. That's an imbalance of 96, an effective emissivity of 0.6 rather than 1.0. Energy builds up on the surface, emitting more IR. In order to emit 240 W/m^2 with an effective emissivity of 0.6, the surface must go to ( (256.15°K)^4 * 1.0 / 0.6 ) ^ 0.25 = 291°K, or over +17°C; a 34°C difference And the surface radiation will be about 240 / 0.6 = 400 W/m^2. Pretty close for off the cuff numbers and a zero dimensional model! Real numbers are a 33°C difference, 14°C surface temperature, 396 W/m^2. Greenhouse gases insulate by absorbing then re-emitting IR, sending half the energy back down, reducing effective emissivity to space. It doesn't take a lot of thermal mass, just absorbing/emitting in the IR. -
Daniel Bailey at 13:41 PM on 16 March 2011And so castles made of sand fall in the sea, eventually
@ Bern (4) Spot-on. We should be so lucky as to only experience 1 meter of SLR by 2100. Takeaway Seize every chance possible over the next few years to unload low-lying real estate near the sea. Once more robust data comes in to clarify the true scope of SLR with a more defined timeframe the market for affected properties will collapse. The Yooper -
RW1 at 13:34 PM on 16 March 20112nd law of thermodynamics contradicts greenhouse theory
Climate_Protector, "'d like to clarify why I thought that GH gases may also trap heat other than IR radiation: If you look at the Trenberth et al (2009) energy budget diagram (which Tom Curtis kindly linked to at 491), you'll see that the atmosphere absorbs 396-239 = 157 W m-2 of OUTGOING long-wave radiation. This flux is only 47% of the downward IR flux (333 W m-2) shown on the same diagram. So, 53% of the back radiation must be coming from other sources (solar, evapo-transpiration etc.) indicating that GH gases also trap other types of heat. Is this correct? This also makes me wonder, why the greenhouse effect is only attributed to interception of surface IR radiation, when more than 50% of the net energy input to the atmosphere comes from sources other than surface IR flux ... Is this a legitimate conclusion assuming that Trenberth's diagram is correct?" No, because all the energy emitted from (and into) the planet is radiative, which means the net effect of all the other components has to be zero. Remember also, incoming solar energy absorbed by the atmosphere and radiated down has yet to reach the surface and this energy is included in the post albedo of about 239 W/m^2. -
trunkmonkey at 13:12 PM on 16 March 2011CO2 lags temperature
SOMETHING has buffered global warming at the apex of every interglacial warm period for the last 2 million years. Otherwise we would have reverted to the so called greenhouse climates that have dominated earth history.It would be really nice to know what that SOMETHING is.The apparent lag of CO2 behind temperature for the last 800000 years may provide a clue. Temperature has led on both the rapid recoveries where CO2 positive feedback is likely and on the slower declines to ice ages where CO2 may have acted as a brake. Whatever the SOMETHING is, it prevented CO2 from taking control of climate until possibly the last few years. -
Climate_Protector at 13:11 PM on 16 March 20112nd law of thermodynamics contradicts greenhouse theory
Oops, I misspelled your name in my last posting. It was directed to KR @ 538 -
Bern at 13:08 PM on 16 March 2011And so castles made of sand fall in the sea, eventually
Very true, Daniel, didn't mean to imply that I thought that was the case. I think impact studies such as this are vitally important. I guess I should have just stuck to my final point: that science is increasingly saying these are likely to be the minimum impacts we see this century. -
Climate_Protector at 13:07 PM on 16 March 20112nd law of thermodynamics contradicts greenhouse theory
KB 538 - Thank you. I got the idea about the insulation effect of the atmosphere a while ago. I was just trying to figure out how exactly that insulation process works, and I think you gave me a clue - the analogy with the space blanket! If I remember correctly, those blankets have very low emissivity and therefore high reflectivity with respect to IR, and that's how they prevent thermal radiation from escaping and cooling the body. So, greenhouse gases must reflect thermal radiation as well, correct? But then why they say that greenhouse gases have high IR absorptivity especially water vapor. Is it that greenhouse gases have high reflectivity and high absorptivity both at the same time?. But then you mention that "the atmosphere reduces the emissivity of the planet". Do you implay that GH gases reduce the emissivity of the atmosphere, which would mean that they themselves have low emissivity. So, I guess I got confused again ... Sorry, for not being able to follow you completely. Also, from your analogy with the space blanket, does it mean that GH gases also affect (reduce) convection? That would support my earlier conclusion (suspicion) that those GH somehow trap convective heat as well. This is a very interesting discussion to me. Thank you to all for participating.Moderator Response: [DB] You couldn't pick a better place on the Interwebs for it. -
Charlie A at 12:59 PM on 16 March 2011Maximum and minimum monthly records in global temperature databases
Shoyemore, the author says at #29 "The temperatures in the mid century period were not "record", but there was a handful of second-warmest and third-warmest months, as if a warming period had been "damped" in some way." and "Fig 2 is in industrial and healthcare monitoring knows as a "Cusum" chart which is demonstrated to be the type of chart most sensitive to a process change. As you see it dates the advent of late-century warming to 1957 - earlier than any other method." Would it be possible for you to show what the Cumsum plot would look like for earlier periods, such as 1910 to 1950? It would be interesting to see how it dates the advent of warming in the first half of the 20th century. -
Charlie A at 12:51 PM on 16 March 2011Maximum and minimum monthly records in global temperature databases
An interesting analysis along this same line is to look back 10 years or 12 years and see how many of those years are records. For example, the IPCC AR4 noted that "Eleven of the last twelve years (1995–2006) rank among the 12 warmest years in the instrumental record of global surface temperature(since 1850." Below are charts that show how things would have appeared looking at the previous 10 or 12 years.
 See update 13 of Congenital Climate Abnormalities
-
adelady at 12:32 PM on 16 March 2011Maximum and minimum monthly records in global temperature databases
Bern, never overlook the truly dreadful agricultural practices of the time. The dustbowls of the 30s and 40s in USA, Australia and USSR were created by idiotic plough-every-chance-you-get approaches. More agricultural land was opened up - cleared and flattened to bare exposed soil - during this period. And many farmers continued with practices they'd become used to right into the late 50s and 60s. The changed advice from central agricultural authorities took a lot of time to percolate through the industry. I remember a 1960s school textbook telling me that it was necessary to plough =several= times before seeding because that promoted "capillary action" to bring water to the surface where it was needed. These practices created enormous dust clouds because the ruined, powdery soil blew away every time it was exposed to anything more than a gentle breeze. That effect was declining but not eliminated during the period you're concerned about. My suspicion is that the decline in proportion of farmers using these methods was offset by the large expanses of farmland being cleared. So the total dust produced didn't change as quickly as it might have. An agricultural historian would be a handy person to have right now. -
adelady at 12:12 PM on 16 March 20112nd law of thermodynamics contradicts greenhouse theory
cp#536 "There must be some sort of high energy storage in the atmosphere that is maintained by the absorption of heat by GH gases." Why does it need to be in the atmosphere? The ocean provides a handy, accessible, and huge, energy storage facility right next door. (I'm assuming that the question really does reflect some difficulty here.) -
2nd law of thermodynamics contradicts greenhouse theory
Climate_Protector - The greenhouse gases act as insulators by slowing radiant energy from reaching space. At any level half of the energy going into the atmosphere (including the GHG's) gets radiated up and half down (neglecting convective effects, which are relatively small). And hence not all of the IR leaves - the "insulator" slows it down, requiring a larger energy differential between the bottom and top of the atmosphere to drive 240 W/m^2 out to space. The atmosphere doesn't have to hold the energy in thermal mass (and it doesn't have much thermal mass to start with) - just re-emit it back down and prevent it from leaving. This is a lot like those shiny "space blankets" - they have almost no thermal mass, but via IR reflection and blocking convection they insulate quite well. Without GHG's the Earth could radiate all 240 W/m^2 out to space directly. If you look at just the atmospheric layer, ~240 reach space through various pathways, driven by the 17+80+396 coming up from Earth, the 78 incident on the atmosphere from the sun, minus the 333 going down as "backradiation" = 238 W/m^2 (239 without rounding, with a 0.9 calculated imbalance warming things). To make it clear, what matters is total energy entering and leaving the system, and a stable system will reach the temperatures and internal energy balances necessary for that. The atmosphere reduces the emissivity of the planet, and if emissivity reduces, temperature is the only free variable to return power outflow to the level of the incoming energy. And the stable state of the climate will move towards that point. Internal energy levels are a function of input/output and energy transfer rates, but if there's a narrow point in the energy flow (like the atmosphere) local energy levels will, must, go considerably higher to reach that throughput level. That's the first law of thermodynamics - conservation of energy, what goes in must come out. -
trunkmonkey at 12:09 PM on 16 March 2011Visualizing a History of CO2
The lowest estimates of Mesozioc CO2 I've ever seen (Breeker et al 2010)are on the order of 1000ppm. Maybe the music went to their heads a little towards the end. The truth is hard enough without embellishment. -
Daniel Bailey at 12:08 PM on 16 March 2011And so castles made of sand fall in the sea, eventually
Gentlemen: If you take a closer read of the post, you'll see that predicting the amount of SLR is not the intent of the research the post delineates. Instead, Weiss et al take published consensus estimates of expected SLR by 2100 (which admittedly do not reflect the non-linearities in ice sheet losses discussed in Hansen 2011) and factor those values into a high-rez dataset (electronic vector map) to visually demonstrate that SLR impact in the areas modeled. The idea is that, in order to most properly reflect the impact of future SLR, a picture is of greater value as a teaching tool than a table of numbers. What Weiss et al do not do is to predict by how much SLR will be, or when said SLR values will arrive. But note that the map in the post above shows 6 meter inundation areas that would be fully compliant with the potentialities discussed in Hansen 2011. An extremely valuable study in that context. Hope that helps, The Yooper -
Bern at 12:08 PM on 16 March 2011Maximum and minimum monthly records in global temperature databases
Regarding the mid-century "cooling" - can someone point me to a paper that discusses the aerosol load created by human activities in that period? Just off the top of my head, I can think of the following abnormal aerosol sources: - damaged caused by WW2, including large numbers of fires as cities / towns / industries were bombed; - increased industrial activity during WW2 (the 'War Effort' effect), possibly with decreased attention to pollution control; - increased industrial activity during the post-war period; - aerosols produced by atmospheric nuclear testing (from 1945 until the partial test ban treaty in 1963, although Wikipedia tells me the French continued atmospheric tests until 1974, the Chinese until 1980). It seems to me that those sources could (would?) have produced extremely high amounts of aerosols, some of which (particularly the nuke tests) would have been pushed into the stratosphere. If the effects of those have been quantified, is there need for any other factor to explain the mid-century cooling? The data in the post above that suggests there was no increase in cold records suggests it was mainly an impact on daytime maximum temperatures, with greenhouse gases keeping night / winter temperatures close to average, which would be consistent with aerosol effects.Moderator Response: See the Argument "It cooled mid-century," in the Advanced tabbed page. -
Climate_Protector at 12:03 PM on 16 March 20112nd law of thermodynamics contradicts greenhouse theory
Another (maybe silly) question. Does anyone know the exact concentration of ALL greenhouse gases in the atmosphere? I remember something like 5% but am not sure ... Thanx -
Bern at 11:45 AM on 16 March 2011And so castles made of sand fall in the sea, eventually
This article does seem to only consider the scenario of the Greenland and Antarctic ice sheets melting in place - it doesn't mention the possibility of rapid break-up of parts of those ice sheets, with rapid sea level rise (SLR) as a result. Is this just scientific reticence at work again? I think it probably is - while there are some papers that predict much higher SLR by 2100, they're still, as yet, in the minority. Unfortunately, as Agnostic points out, Hansen (who is predicting SLR of up to 5m by 2100) has a bad habit of calling it correctly. One thing seems clear, though - the sort of SLR that is discussed in this article is probably going to be the minimum we'll have to deal with this century... -
Daniel Bailey at 11:44 AM on 16 March 2011It's cooling
Nice summary, Rob! Some February info from Hansen: The Yooper
-
From Peru at 11:40 AM on 16 March 2011Maximum and minimum monthly records in global temperature databases
In the "figures" only appear drawings of a frog inside an ice cube: with below written:
"Domain unregistered, To view, register at: bit.ly/imageshack-domain"
What is wrong with the figures? I hope the glitch is solved soon.
Moderator Response: [DB] An issue with imageshack (the host of the images).
with below written:
"Domain unregistered, To view, register at: bit.ly/imageshack-domain"
What is wrong with the figures? I hope the glitch is solved soon.
Moderator Response: [DB] An issue with imageshack (the host of the images).I'll see if I can effect a workaround.Fixed. -
Climate_Protector at 11:35 AM on 16 March 20112nd law of thermodynamics contradicts greenhouse theory
To Tom Curtis 534 - Yes, I agree with you! The question is (again) how can we explain the extra kinetic energy in the lower atmosphere, i.e. the greenhouse effect? There must be some sort of high energy storage in the atmosphere that is maintained by the absorption of heat by GH gases. At least, that's the logical conclusion (in my view) from the discussion so far ... Or, there might be another source of energy we have not considered yet. Is this possible? -
Riduna at 11:34 AM on 16 March 2011And so castles made of sand fall in the sea, eventually
I think Jeremy Weiss underestimates SLR along the Atlantic and Gulf coasts this century by a factor of 2+ and that the situation confronting US coastal states is a lot more threatening than he thinks. After an admittedly crude analysis of the causes of SLR,, I concluded in a blog written last year (http://www.onlineopinion.com.au/view.asp?article=11179) that it could be expected to accelerate throughout this century, could probably rise by 0.9m. by 2050, by >2.5m. by 2100 and thereafter by about 2.8m per century. This assumes average global temperature rises by 5C by 2100 with larger polar amplification resulting in speedier melting of ice-sheet fringes and more rapid discharge from glaciers causing major embayments. Hansen (2011) predicts, (I suspect correctly) that by 2100 temperature is likely to have risen by as much as 6C. Were that to be realized, then all bets are off on SLR, other than it will be higher and faster. An estimate of 1m rise by 2100 seems very optimistic. There is no reason for confidence that major emitters of CO2 will curb their total emissions until there is irrefutable evidence of the harm caused by them. By then it will be too late. As an interim measure governments would be wise to plan on much higher SLR and an increased likelihood of them being accompanied by storm surges. -
Albatross at 11:21 AM on 16 March 2011Skeptical Science nominated for Climate Change Communicator of the Year
Ken and Rob, With respect to Ken, you clearly have little idea how science operates. My colleagues challenge every paper that I publish-- when the work is first submitted as a proposal, when it is a work in progress, when it is submitted for peer-review and even after it is published. We challenge each other (and share ideas)over coffee, over a beer, at conferences and in the literature. In fact, so deep is the passion and the curiosity of practicing scientists that it is almost impossible to put them in the same room without some or other (constructive) debate ensuing. However, unlike the partisan bickering, obfuscation and misinformation brought forth by "skeptics" (note the quotation marks), the dialogue that my colleagues and I share is almost always constructive and productive, i.e., it has value. True skeptics do contribute to the science, the same is almost always not true for self-proclaimed "skeptics" and contrarians. People who understand AGW to be a threat/concern frequently disagree and correct each other on these threads at SkS, for example-- although sadly most of our time is addressing the misinformation and obfuscation brought forward by the likes of BP. And it is my understanding that a lot of work goes on before a post is published to make sure the science is right. For the record, the true contradictions and incoherence and inconsistencies that you refer to seem to be almost exclusively the territory of "skeptics", those in denial about AGW and contrarians. Now of course you will most likely take issue with what I have said above, but I guess that is part and parcel of being a self-professed contrarian/"skeptic" ;) -
Climate_Protector at 11:10 AM on 16 March 20112nd law of thermodynamics contradicts greenhouse theory
I'd like to clarify why I thought that GH gases may also trap heat other than IR radiation: If you look at the Trenberth et al (2009) energy budget diagram (which Tom Curtis kindly linked to at 491), you'll see that the atmosphere absorbs 396-239 = 157 W m-2 of OUTGOING long-wave radiation. This flux is only 47% of the downward IR flux (333 W m-2) shown on the same diagram. So, 53% of the back radiation must be coming from other sources (solar, evapo-transpiration etc.) indicating that GH gases also trap other types of heat. Is this correct? This also makes me wonder, why the greenhouse effect is only attributed to interception of surface IR radiation, when more than 50% of the net energy input to the atmosphere comes from sources other than surface IR flux ... Is this a legitimate conclusion assuming that Trenberth's diagram is correct? -
Rob Honeycutt at 11:00 AM on 16 March 2011Skeptical Science nominated for Climate Change Communicator of the Year
Ken... Hm, so skeptics are performing a free service by challenging already well established and proven theories, and contributing to delayed action on what stands to be the most important issue that humanity faces? Not sure where the value in that is. -
Tom Curtis at 10:56 AM on 16 March 20112nd law of thermodynamics contradicts greenhouse theory
CP @531: Yes, that makes sense. But it is only another way of saying that the surface of the Earth (and hence the lowest portions of the atmosphere) have a higher temperature than you would expect from insolation alone, and ignoring any greenhouse effect. -
2nd law of thermodynamics contradicts greenhouse theory
CP @ 532 >kinetic energy of the lower atmosphere must higher than the kinetic energy corresponding to the absorbed solar flux, if the back radiation is indeed larger than absorbed solar flux. You cannot compare these quantities in the way you are attempting. Solar flux is a rate, measured as units of energy per units of time. The total kinetic energy of the atmosphere is the total amount of energy stored at a specific point in time. The total kinetic energy of our atmosphere is higher than it would be if the greenhouse effect was not present. This is because greenhouse gases slow the rate at which energy can be dissipated into space via thermal radiation (lower emissivity), resulting in more energy accumulating within the atmosphere. -
Rob Painting at 10:49 AM on 16 March 2011It's cooling
chudiburg - Further to Daniel Bailey's excellent explanation: We are in the midst of a strong La Nina event, a lot of the heat from the atmosphere is disappearing down into the oceans. See NOAA sea surface temperature map below: This is part of an ongoing warm/cool oscillation of the climate that has been going on for millenia (at least). It's part of the "natural variability" that climate scientists often refer to. The only way heat can leave Earth is via radiation at the top of the atmosphere. ENSO events (El Nino & La Nina) just shuffle the heat around between the ocean and atmosphere. See discussion here: Global warming and the El Niño Southern Oscillation
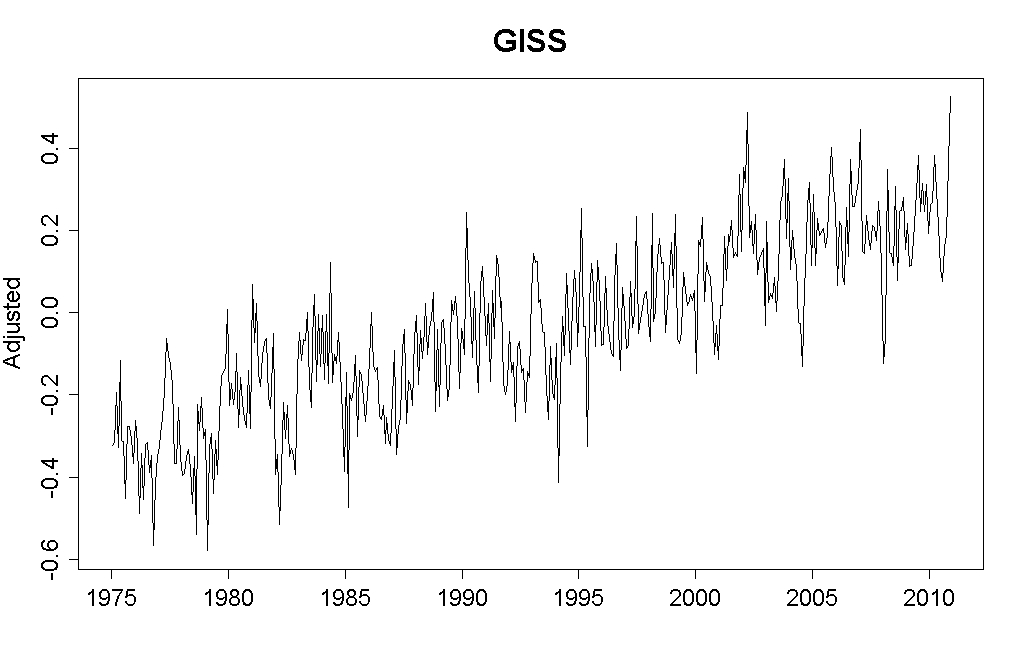
There's no expectation that each year will be warmer than the previous one, but over longer time-frames we expect the atmosphere and oceans to warm as more heat is trapped by greenhouse gases. Therefore we should see the continual warming show up in long-term records. This is what we see when all temperature records are combined into one graph.
This is part of an ongoing warm/cool oscillation of the climate that has been going on for millenia (at least). It's part of the "natural variability" that climate scientists often refer to. The only way heat can leave Earth is via radiation at the top of the atmosphere. ENSO events (El Nino & La Nina) just shuffle the heat around between the ocean and atmosphere. See discussion here: Global warming and the El Niño Southern Oscillation
There's no expectation that each year will be warmer than the previous one, but over longer time-frames we expect the atmosphere and oceans to warm as more heat is trapped by greenhouse gases. Therefore we should see the continual warming show up in long-term records. This is what we see when all temperature records are combined into one graph.
 Hope this helps too.
-
Ken Lambert at 10:48 AM on 16 March 2011Skeptical Science nominated for Climate Change Communicator of the Year
Rob Honeycutt #18 What the AGW (as opposed to GW) true believers should remember is that skeptics who point out weaknesses and contradictions in the AGW science on offer are performing a free service for everyone. If they make a good point which is not demolished in robust argument (they usually fizzle to an unanswered end thread on this site), then the proponents of the (usually) AGW science piece need to take the point on board and resolve the contradiction for all to see. This is the way of the tunneling toward the truth Alan Marshall. Without the BP's of this blogworld, the contributors to this site become spectators of a one way conversation. -
Climate_Protector at 10:45 AM on 16 March 20112nd law of thermodynamics contradicts greenhouse theory
To KR 526 - I understand your 'insulation' point. But insulation still works through increasing the kinetic energy of air. Which aspect of the atmosphere acts as an insulator? Are those the greenhouse gases? Do greenhouse gases also work to trap heat other than IR radiation? They have to in order to achieve the the significant warming of the surface above the black body ... -
Climate_Protector at 10:34 AM on 16 March 20112nd law of thermodynamics contradicts greenhouse theory
Tom Curtis 529 - I guess I did not express myself correctly. I did not mean that "Earth's atmosphere's kinetic energy is large compared to that on the sun". I wanted to say that the kinetic energy of the lower atmosphere must higher than the kinetic energy corresponding to the absorbed solar flux, if the back radiation is indeed larger than absorbed solar flux. Does this makes sense? -
Climate_Protector at 10:28 AM on 16 March 20112nd law of thermodynamics contradicts greenhouse theory
Tom Curtis, thank you. This helps ... -
Tom Curtis at 10:28 AM on 16 March 20112nd law of thermodynamics contradicts greenhouse theory
CP @523, very briefly because I am out of time: Radiation does not contain kinetic energy. However the Solar radiation is a function of kinetic energy on the surface of the Sun. That is much higher than that on the surface of the Earth, but because of our distance and the inverse square law, the portion of that energy that the Earth receives is very low. Further, because the Earth is a sphere and always half in darkness, the average energy per meter squared received on the surface of the Earth is only a quarter of that received by a flat plate perpendicular to the sun in the same orbit. So, the conclusion that the Earth's atmosphere's kinetic energy is large compared to that on the sun is unwarranted, and fails to account for the scaling factors. -
Daniel Bailey at 10:25 AM on 16 March 2011It's cooling
Re: chudiburg (145) That depends. As you note, it's too short to make any meaningful comparisons. Over a short distance, say 30 feet, a human can outrun a champion quarterhorse. Over a half-mile...not so much. Comparing temperature trends from short intervals is similar. Apples & oranges. Like comparing the weather from the last 2 days to that of the last 2 years. Sure, you can do it, but what's the point? We had the 17th-warmest combined land+sea temps in February in the instrumental record. That doesn't seem particularly cold, does it? And it wasn't hot everywhere nor cold everywhere. Here's January, normal reference baseline: Here's January, last 30 years baseline (just the lifetime of your students):
 Yeah, it was colder in the NH where most of the people live, but that would be ignoring the rest of the world that was warming.
Scientists are concerned with the long-term trend, which is up. That doesn't mean that every month is of necessity warmer than the previous. Weather, like bodily functions, happens. But over longer periods of time, it shows definite trends (let's also remove cyclical stuff like oscillations [which do not add or subtract energy from the system] and volcanoes):
Yeah, it was colder in the NH where most of the people live, but that would be ignoring the rest of the world that was warming.
Scientists are concerned with the long-term trend, which is up. That doesn't mean that every month is of necessity warmer than the previous. Weather, like bodily functions, happens. But over longer periods of time, it shows definite trends (let's also remove cyclical stuff like oscillations [which do not add or subtract energy from the system] and volcanoes):
 That's why climate scientists use 30 years or more of cumulative weather trends to make their studies of climate. Because any trends emerge from the noisy datasets. Too short of a period of time, like a month or too, will typically contain too much noise in the data for any background signal to be seen. Like asking your students how much they grew yesterday, last week, last month, etc. Eventually any growth trend will be revealed.
[ Edit:
As a footnote, GISS typically updates its online data in mid-month for the previous month, which is why the above graphics only have January data. February should be available at any time soon, here.
In Climate Science, "The trend's the thing" (apologies to the Bard).
End Edit- ]
Hope this helps,
The Yooper
That's why climate scientists use 30 years or more of cumulative weather trends to make their studies of climate. Because any trends emerge from the noisy datasets. Too short of a period of time, like a month or too, will typically contain too much noise in the data for any background signal to be seen. Like asking your students how much they grew yesterday, last week, last month, etc. Eventually any growth trend will be revealed.
[ Edit:
As a footnote, GISS typically updates its online data in mid-month for the previous month, which is why the above graphics only have January data. February should be available at any time soon, here.
In Climate Science, "The trend's the thing" (apologies to the Bard).
End Edit- ]
Hope this helps,
The Yooper
-
Tom Curtis at 10:23 AM on 16 March 20112nd law of thermodynamics contradicts greenhouse theory
Climate_Protector @524, in that case I cannot account for the low diurnal variation in back radiation. It may have something to do with your very high altitude, which means the back radiation comes from a greater thickness of atmosphere, and may have something to do with you location near the rockies (which contain a substantial storage of water). But I would be guessing if I gave any explicit explanation. (Science of Doom would probably be able to tell you why.) -
Tom Curtis at 10:18 AM on 16 March 20112nd law of thermodynamics contradicts greenhouse theory
Climate_Protector, here are two charts of back radiation from particular sites. The first shows 14 days of back radiation measurements at Billings, Omaha in October of 1993: Your will notice the range of the back radiation is around 150 w/m^2 over just a few weeks, and that on a single night it can be as much as 100 w/m^2. This is less than Mount Isa's, mostly because of differences in climate and surface cover(Mount Isa is semi-desert,Omaha is Prairie). Greater plant cover in Omaha means a high stored water content in the plants an soil, resulting in less variation in the temperature of the surface, which coupled with greater humidity in the atmosphere will account for most of the difference.
The second shows the annual variation at several sites at different latitudes:
Your will notice the range of the back radiation is around 150 w/m^2 over just a few weeks, and that on a single night it can be as much as 100 w/m^2. This is less than Mount Isa's, mostly because of differences in climate and surface cover(Mount Isa is semi-desert,Omaha is Prairie). Greater plant cover in Omaha means a high stored water content in the plants an soil, resulting in less variation in the temperature of the surface, which coupled with greater humidity in the atmosphere will account for most of the difference.
The second shows the annual variation at several sites at different latitudes:
 Again there are significant differences in the variation depending on location and climate. The stark contrast between the tropical atoll, Kwajalein (which because of its effectively non-existant land mass will vary with changes in Sea Surface Temperatures) and that for the inland, and arid Boulder Colarado, is very informative. (I would have preferred a tropical comparison, but do not know the location of Tateno.)
-
2nd law of thermodynamics contradicts greenhouse theory
Climate_Protector - You might find Science of Doom's writeup on the 1st law of thermodynamics useful. One way to really visualize this is to think of the system as left-to-right. Sunlight enters from the left, heating the surface. To maintain conservation of energy in a steady state solution, the surface must dump that heat to outer space (far right). But there's an insulating atmosphere in between. The temperature that the Earth reaches is that which is necessary to pump 240 W/m^2 through the radiatively insulating atmosphere into space. Moving this energy through the atmosphere requires an energy differential! The Earth radiates 396 W/m^2 to the atmosphere (some 40 or so going straight through), the atmosphere acquires a temperature equal to the surface at the surface and radiates a large amount back down, and the upper colder atmosphere radiates 240 W/m^2 to space. It's insulation, pure and simple. And the more insulation between a constant input and a cold sink, the hotter the final temperature of the heated object. Total flow through the system is still 240 in, 240 out. There's just a buildup of energy at the thin link through the Earth/atmosphere interface. -
Climate_Protector at 10:11 AM on 16 March 20112nd law of thermodynamics contradicts greenhouse theory
To clarify regarding the back radiation I have seen. The flux changes little between day and night ONLY if you look at any particular series of 2-3 days, but it can fluctuate more than 100 W m-2 over the coarse of a season or a year. -
Climate_Protector at 10:06 AM on 16 March 20112nd law of thermodynamics contradicts greenhouse theory
To Tom Curtis 522 - I work in Colorado (far from any coast), and the climate here is relatively dry. The diurnal temperature range in the summer is about 10-13C, and the winter might be much higher or much lower depending on the frontal weather system we get. -
Climate_Protector at 10:02 AM on 16 March 20112nd law of thermodynamics contradicts greenhouse theory
Was the air temperature proportional to the kinetic energy of air? I think Tom Curtis said that above. So, since back radiation is also proportional to temperature (somehow I think?), then would that mean that the kinetic energy of air is proportional to back radiation? If that is the case, then the lower atmosphere must contain kinetic energy that is larger than solar radiation, IF back radiation is really larger than the absorbed solar flux. This suggests that the atmosphere must be able to somehow store significant amount of energy. So, we come again to the atmospheric heat storage question. Correct? Something here does not add up - either we have a large atmospheric heat storage or the back radiation numbers must be wrong (or I'm profoundly misunderstand something). Do you agree? -
Tom Curtis at 09:57 AM on 16 March 20112nd law of thermodynamics contradicts greenhouse theory
Climate_Protector @521, to evaluate your claim that back radiation at your location varies by no more than 40 w/m^2 from day to night, I would need to know the temperature range. However, two factors may be relevant. The closer you are to the coast, the smaller the diurnal temperature range, and hence diurnal range of back radiation. And the colder the climate, the smaller range in back radiation for a given range in temperatures. For instanct, a temperture range of 27 degrees (as in Mount Isa) but with the maximum equaling Mount Isa's minimum (0 degrees C) would only result in a 107 w/m^2 range in back radiation. The reported intensities in the diagram have significant margins of error (around 5% I believe), but are the best available estimates. -
chudiburg at 09:53 AM on 16 March 2011It's cooling
A quick question for all you ladies and gents with far more knowledge than myself. January and February of this year (2011) show a combined land and ocean temperature that is cooler than the past few years. I know that two months is much too short to make claims about trends, but I am just wondering why that might be. I am about to teach a unit on Climate Change and like to give updated temperature information to my students. I foresee this being a question I get from my students and I want to be prepared. Thanks -
Climate_Protector at 09:47 AM on 16 March 20112nd law of thermodynamics contradicts greenhouse theory
I see. So, most heat is storred in the oceans. That makes sense. It sounds like you all are telling me that there is no error in the reported intensities of back radiation, and that it is larger than the absorbed solar flux. Correct? I'm an ecologist and from working with observed met data (to drive my ecosystem models), I noticed that the diurnal variation in back radiation is much smaller than solar radiation. In fact, back radiation is nearly invariant (+- 20W m-2 or so) between day and night. This is true for sites in the NH. I'm bringing this up in response to Tom Curtis's remark that back radiation varies diurnally quite a bit. I've seen the opposite in the data sets I worked with ... Anyway, I understand that the lower atmosphere, where most of the back radiation is coming from, is heavily heated by the surface through surface-atmosphere exchange of various energies. But I'm still not clear what's making the temperature of the surface to increase beyond the black-body temperature. I guess this is the chicken-and-egg question; which is heating which? -
shoyemore at 09:29 AM on 16 March 2011Maximum and minimum monthly records in global temperature databases
Chris G., The temperatures in the mid century period were not "record", but there was a handful of second-warmest and third-warmest months, as if a warming period had been "damped" in some way. The "cooling" was not reflected in any coldest-month records. This may reflect a warming period somehow modified by the presence of aerosols - the months' temperatures were in the upper rather than the lower range. I am considering how this might be converted into a rate estimate via some formal Bayesian way. Fig 2 is in industrial and healthcare monitoring knows as a "Cusum" chart which is demonstrated to be the type of chart most sensitive to a process change. As you see it dates the advent of late-century warming to 1957 - earlier than any other method. I am not over-emphasising that, as it still needs some investigation. Adelady, I think you get it. Lot of work still to be done. Thanks. -
Tom Curtis at 09:18 AM on 16 March 20112nd law of thermodynamics contradicts greenhouse theory
Climate_Protecter @522, the back radiation is a direct function of the temperature of the lowest part of the atmosphere. Because the lowest part of the atmosphere is very close in temperature to the surface, and the surface is far hotter than it would be if there were no greenhouse effect, the back radiation is also very high. Absent the greenhouse effect, the surface IR radiation would equal the incoming solar radiation. The green house effect lifts that till it is much higher, and therefore the back radiation is higher. It is as simple as that. -
Tom Curtis at 09:14 AM on 16 March 20112nd law of thermodynamics contradicts greenhouse theory
Climate_Protector @520, the atmosphere "stores" considerable heat both in the form of the kinetic energy of motion (temperature) and as the vibrational and rotational energy of molecules (specific heat). The amount stored as vibrational energy and rotational energy is always proportional to that stored as kinetic energy, ie, as temperature. The amount stored is very small, however, compared to that stored by oceans. The specific heat of dry air is 1.026 Joules per kilogram per degree Kelvin, while that of water is over four times that. Combined with the much greater mass of the ocean, this means the vast majority of thermal energy at the Earth's surface is stored in the Ocean. However, this is largely irrelevant to PhysSci's argument. The reason the atmosphere maintains a very high back radiation is because a very high energy flux into the atmosphere is maintained, both by energy transfers from the Earth (IR, convection and evapo/transpiration) and directly from the Sun. In fact, when one of those (the sun) is removed at night, the back radiation falls very rapidly unless either: 1) The surface IR flux is maintained at high levels by being over ocean; or 2) The humidity is very high (which increases the specific heat of the atmosphere) and there is a low cloud cover (which lowers significantly the average altitude from which the back radiation comes, and significantly increases the heat capacity of the source of the back radiation). Obviously, there is some regional geographic effects, with warm air over sea water at night helping maintain a higher night time back radiation on the coast than in the interior. All of this follows because the back radiation is simply the thermal (IR) emissions of the lowest kilometer or so of the atmosphere; and therefore fluctuates with the temperature of that lowest portion of the atmosphere. Because of this, back radiation can fluctuate by more than 145 watts per meter squared in a single 24 hour period (the calculated night/day variation for winter in Mount Isa, Queensland) even without major changes in weather.Moderator Response: This sounds like a good additional Argument for the Arguments list. John Cook, what do you think?
Prev 1865 1866 1867 1868 1869 1870 1871 1872 1873 1874 1875 1876 1877 1878 1879 1880 Next


