


 Arguments


Recent Comments
Prev 1879 1880 1881 1882 1883 1884 1885 1886 1887 1888 1889 1890 1891 1892 1893 1894 Next
Comments 94301 to 94350:
-
chrisd3 at 07:50 AM on 10 March 2011Examining Hansen's prediction about the West Side Highway
@NewYorkJ #6: I'm not sure how prone this particular highway is to flooding. Didn't Hansen's conversation in 1988 precede a major reconstruction of the West Side Highway? I had heard that at least part of the reason for this was that it was flood-prone. But I haven't lived in NY since the 60s, so maybe I heard wrong. -
chrisd3 at 07:46 AM on 10 March 2011Examining Hansen's prediction about the West Side Highway
Don't we have to wait 40 years after a doubling of CO2? -
Phila at 07:42 AM on 10 March 2011Examining Hansen's prediction about the West Side Highway
One climate myth found on the internet, propagated by Anthony Watts Is there a climate myth found on the Internet that isn't propagated by Anthony Watts? -
Chris G at 07:40 AM on 10 March 2011The Earth's Sixth Mass Extinction May Be Underway
RSVP, I don't know about everyone, but what I see is that humans are facing a triple threat of overpopulation, climate change, and peak oil. For instance, if there were only a couple million of us on the planet, we could consume several times as much fossil fuel energy as the average American and it would have little impact on the planet's climate. And, we could eat whatever we wanted and it would make little difference as well. My guess is that food production is pretty well optimized according to the average temperature and rain patterns that have existed for several thousand years. So, I'm guessing that if they change, and especially if there is no stabilization, and the change continues, there will be a drop in production. The earth's carrying capacity for the human population will be lowered. Looking at the trend lines, our need for food, as the population grows, is gaining on our capacity to produce food. A lot of our food production is heavily dependent on petroleum products including not just the gas to drive the tractors, but also fertilizers and pesticides. The three factors will combine to cause rises in food costs and shortages. As the price of food increases, at some point there will be an awful lot of angry, hungry people in the world, and they will blame their misery on someone else. At first it will be their own leaders, but will expand to include the ones who aren't hungry, most likely the Americans, Australians, and Russians since they most often have food surpluses. (Although there is an obvious counter-example to that this year.) Anyway, what was the quote I read, historically, when humans are faced with starvation or raiding, they raid every time. If some of the raiders have large armies or nukes, there could be a bit of an over-correction of the population versus carrying capacity ratio. It all comes down to how well a species can take energy from its environment. I should probably explain that I don't just mean energy that we use on the electric grid. To a predator, the prey is energy; to an herbivore, plants are energy; to plants, sunlight is energy. All species compete for energy. If a species is more adept at gathering energy than its competition, it has more offspring than its competition. Humans are the most successful invasive species I know of because they are so adept at consuming whatever is available. It would seem that our need to reproduce combined with our skill at utilizing whatever resources are available would lead to extinctions of many other species regardless of our impact on the climate, simply because we take to ourselves the energy resources that other species need. I am not saying we should be complacent about it, but I don't see how we can go from a few million to over 6 billion and counting without knocking off a few other species. I see climate change as a contributing factor to species extinctions as well as overpopulation, but I can make no claim is to which is more significant. I suppose what we are haggling over is the quantity of human life versus the quality of the lives that are. -
Paul D at 07:32 AM on 10 March 2011Examining Hansen's prediction about the West Side Highway
You need to take into account tides, atmospheric pressure, storms etc. Hence occasionally a small sea level rise, combined with tides etc, will result in flooding. The other point is that by not dealing with emissions now, you are offloading the cost of flood adaptation onto future generations. Increased warming means that sea levels will continue to rise, they won't stop once they reach a 'magic' number quoted in the press/media. -
actually thoughtful at 07:31 AM on 10 March 2011Climate Emergency: Time to Slam on the Brakes
Gilles - 34 "Chinese and Indians don't get it" Both of the countries mentioned are investing very heavily in renewables. The point you seem unwilling to get is that renewable energy is the economic driver of this century. The policy in the US of letting other countries take the lead is dooming the US to losing its status as the dominant power in the world. And the saddest thing is it really, truly, isn't that hard to shift policy towards innovation and leadership. Even with our perverse governmental approach towards climate change (which continues to funnel billions into the system that are causing the problem (fossil fuel industries, transportation, sub-standard (from an energy efficiency point of view (see Energy Star for a list of standards that covers 20% of what is necessary)) AND starving the innovators of the funds necessary to develop, install and profit from renewable energy technologies) some innovation still survives. If the US wants to have economic dominance in the 21st century, it must lead in renewable fuels. There is no way out of that. And so far, the government has chosen to deal with other issues: wars in far off lands, healthcare, budget deficits and a host of other short term, minor concerns, while the world continues to heat up. -
Rob Painting at 06:59 AM on 10 March 2011The Earth's Sixth Mass Extinction May Be Underway
Bern @ 19The thing is, as I saw it put recently: Evolution works by death
Well there's that, but also when environmental conditions change enough to induce a die-off, extinction isn't an instantaneous event. Oblivion for species can take a handful of generations to manifest itself. See discussion of extinction debt in the scientific literature. Even if species manage to survive, for extreme changes very few individuals will possess the necessary traits/genes for survival, so what we would expect to see is populations crash, and a very long recovery period. How any of this is of any use to a global society trying to feed (or not) 7 billion people, the AGW skeptics have yet to explain. -
Albatross at 06:58 AM on 10 March 2011Climate Emergency: Time to Slam on the Brakes
Angus @66, The moderator has directed you to go read where the misinformation that you are perpetuating here has been addressed. And the format of your post looks like portions of it may have been cut and pasted from somewhere else. Might I ask where? To stay on topic, research by James Annan and Hargreaves have demonstrated that the 95% confidence interval for climate sensitivity for doubling CO2 is +2 to +4 K, with a most likely value of +3 K. And we will easily double CO2 come 2100 under BAU. Hansen and others suggest that long-term climate sensitivity may be even higher than the +3 K estimate. But I suspect that you and other 'skeptics' believe that you know better than the overwhelming body of science....Moderator Response: Responses to this comment also need to be on that thread "Hansen’s 1988 prediction was wrong." I encourage everyone responding to then post a comment here, directing readers to your comment there. It's fine to post responses on this thread as long as they are attempting to pull the conversation back on the topic of this thread. (As Albatross has done here.) -
angusmac at 06:10 AM on 10 March 2011Climate Emergency: Time to Slam on the Brakes
James perhaps you worry too much under, re "Under business as usual, we are heading for up to 1,000 ppm by 2100, or nearly two doublings (and that's not including possible carbon feedbacks). This would surely be an unimaginable catastrophe on any timescale…The lowest CO2 target being considered is 450 ppm, which Hansen concluded would eventually melt all ice on the planet, raising sea level by 75 metres."This appears to be extremely alarming. However, Hansen's predictions have not always been proved to be close to reality as I describe below.
The global warming models presented by Hansen (2006) are shown in Figure 1. I have added the GISS Land Ocean Temperature Index (LOTI) data up to January 2011 and I have also added the Mauna Loa CO2 data.
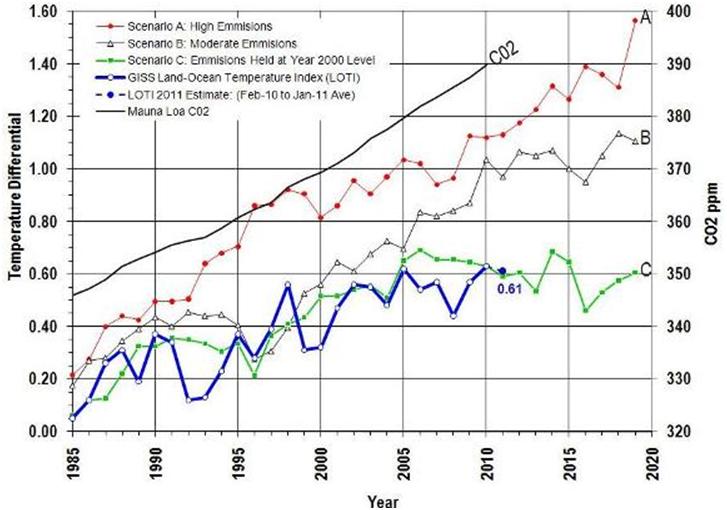 Figure 1: Scenarios A, B and C Compared with Measured GISS Land-Ocean Temperature Index (after Hansen, 2006)
The blue line in Figure 1 denotes the GISS LOTI data and the black line is the Mauna Loa CO2 data. Scenarios A, B and C describe various CO2 emission outcomes presented by Hansen (2006).
Scenario A is "on the high side of reality" with an exponential increase in emissions. Scenario C has "a drastic curtailment of emissions", with no increase in emissions after 2000. Scenario B is described as "most plausible" which is expected to be closest to reality.
Nevertheless, it is interesting to note that in his testimony to US Congress, Hansen (1988) describes Scenario A as "business as usual." This somewhat contradicts "on the high side of reality" in Hansen (2006) in which Scenario B is described as "most plausible." Don't we all have 20-20 vision with hindsight?
It is evident from Figure 1 that CO2 emissions are following Hansen's Scenario A temperatures (forcings) whilst real-world temperatures are following the "zero increase in emissions" Scenario C. What temperature do you get by doubling CO2? It would appear that we would get a lot less than predicted by Hansen (2006).
James perhaps you worry too much. "Facts are chiels that winnae ding." The real-world currently does not seem inclined to follow Hansen's (2006) predictions.Notwithstanding the above, it should be noted that time period for the comparison of actual temperature/CO2 measurements with those predicted is still relatively short. Hansen (2006) suggests that we could expect reasonable results for distinction between the scenarios and useful comparison with the real world by 2015.
Moderator Response: Responses to this comment are better placed on the thread "Hansen’s 1988 prediction was wrong." Best to read the Advanced tabbed page there first, to learn why it makes no sense to write "It is evident from Figure 1 that CO2 emissions are following Hansen's Scenario A temperatures (forcings)." -
NewYorkJ at 05:40 AM on 10 March 2011Examining Hansen's prediction about the West Side Highway
I'm not sure how prone this particular highway is to flooding. Maps of sea level rise indicate that 1 meter would put parts of the road underwater. A doubling of CO2 gets us there, but the timeframe for when we get to 560 ppm and when this occurs is probably longer than another 20 years from now. The timeframe isn't Hansen's prediction though. He was asked what a doubling of CO2 scenario would look like. It's the reporter that threw out 40 years. -
hank at 05:38 AM on 10 March 2011Examining Hansen's prediction about the West Side Highway
Videos: http://baykeeper.org/blog/video-king-tides-bay -
hank at 05:36 AM on 10 March 2011Examining Hansen's prediction about the West Side Highway
Related links: http://www.flickr.com/groups/bayareakingtides/ http://www.flickr.com/groups/bayareakingtides/discuss/72157625923761895/ (Is there a similar effort being made for New York and other coastal locations?) -
hank at 05:33 AM on 10 March 2011Examining Hansen's prediction about the West Side Highway
If the hypothetical doesn't scare you, try reality. Here's on example from San Francisco Bay, looking at real high tides that reach the levels that will be average tides as sea level rises: http://baykeeper.org/featured/king-tides-show-possible-climate-change-impacts -
NewYorkJ at 05:26 AM on 10 March 2011Examining Hansen's prediction about the West Side Highway
I won't hold my breath waiting for Watts or others to make a correction. Perhaps it will be done as an opportunity to make some other bogus politically-motivated criticism of Hansen. -
muoncounter at 05:12 AM on 10 March 2011The Earth's Sixth Mass Extinction May Be Underway
Reply to Gilles' comment here on Its too hard. -
muoncounter at 05:11 AM on 10 March 2011It's too hard
Continuing reply to Gilles' comment here. "This knowledge is not difficult to get." I asked how you knew that reducing fossil fuel use more destructive to hundreds of millions of people than global warming; you provided the above retort with a link to the World Bank's page on China's rural development. The linked page does not mention fossil fuels at all; rather, it speaks of changing land use policy, agricultural modernization and natural resource management. In addition, note this: Bank-funded projects have also increased forest plantation areas by hundreds of thousands of hectares, and improved the State Forestry Administration’s and provincial forest bureaus’ capacity to plan, develop, manage and protect forest resources. Planning is also underway for China’s first use of bio-carbon funds sequestering carbon through forest plantations ... -- emphasis added The reference you provide thus demonstrates an instance of exactly the sort of action you feel is unnecessary. So your point remains unsubstantiated; your argument weakened by your own evidence. Once again illustrating the poverty of the denialist position, wherein all arguments devolve to some variant of 'I think' or 'Everyone knows' or 'No, its not.' -
Alexandre at 05:10 AM on 10 March 2011The Climate Show Episode 8: Kevin Trenberth
ClimateWatcher Again there's the stretching of "known uncertainties" into "we don't know anything". I'm no expert, but I'm willing to go on with the debate - I can learn in the process, too. But I don't think it makes sense to continue it here. Now it's more a "it's the albedo" argument than anything about Trenberth's interview. -
Phila at 04:34 AM on 10 March 2011The Earth's Sixth Mass Extinction May Be Underway
it means that everybody is in favor of some kind of compromise between burning fossil fuels, but not too much. I'm not so sure about that. Certain people — small in number, but with a significant public influence - seem to reject any environmentally based limitation on burning fossil fuels. some think that 550 ppm or even 700 ppm maybe not that bad after all? There's virtually no belief so dangerous, silly or unsupported by evidence that you can't find "some" who accept it. However, we're really not interested in the full range of idle speculation here. We're interested in what's plausible. If you can present plausible scientific support for the view that 700 ppm is "not that bad," please do so. Otherwise, you're blowing smoke. Because who can the hell say how mankind will live in 50 or 100 years? Another strawman. If AGW will cause droughts in a given region, we can say that people in those regions will tend to live in conditions of drought, with the suffering and food insecurity that entails. If a species vanishes, we can say that people will have to do without the benefits of that species (and this would of course include species whose benefits are currently unknown). If intense heat waves will occur more regularly, we can say that this is a serious problem people will have to deal with. Appealing to ignorance in this way strikes me as a typical attempt to cling to the pleasures of irresponsibility. -
Albatross at 04:25 AM on 10 March 2011The Earth's Sixth Mass Extinction May Be Underway
"It was during the HCO that human civilization advanced!" This statement missing the mark on so many counts. So the old, warming equals diversity argument? If so, deserts should be teaming with life, more so than other more temperate eco zones. Also, we are warmer than the HCO and will continue to warm well beyond that. It is not so much what is happening now, but what is very likely to happen down the road that is an issue. also, during the HCO there were not 7 billion plus bi-pedaled primates walking around to feed. -
Albatross at 04:20 AM on 10 March 2011The Earth's Sixth Mass Extinction May Be Underway
phila@32, Have you read "Extinction" by Dr. Michael Boulter? If not, I recommend it. "It seems that the largest genomes, the most complex physiology and neurology don't guarantee a permanent place on the throne of biodiversity. What we naively saw as an evolving hierarchy does not have ourselves, the human race, in its upper branches." -
John Mason at 04:19 AM on 10 March 2011The Earth's Sixth Mass Extinction May Be Underway
Climate Watcher, Your comments about cold fronts etc are entirely missing the point. In an area (e.g. your back yard) where the existing climate has such fluctuations, the ecosystem adapts to them. The problem areas are twofold. Firstly it is the movement of climatic zones through the latitudes, including precipitation, not just temperature. Secondly, it is the rate of such transitions that is absolutely critical i.e. if the rate of change outpaces adaptation, then decimation of ecosystems occurs. You should be concerned. Those self-same ecosystems make agriculture possible! Cheers - John -
Tom Dayton at 04:17 AM on 10 March 2011CO2 effect is saturated
tjfolkerts, you are correct. In that same Advanced tabbed page, look for the paragraph "There's one more subtle effect related to increased absorption. Upon increasing CO2 concentration, the layer at which the absorption coefficient at each wavelength is low enough to let the IR light escape will be found higher in the atmosphere. The emitting layer will then have a lower temperature, at least until the tropopause is reached, and hence a lower emitting power." A good source of more info are the RealClimate posts A Saturated Gassy Argument and the followup Part II: What Angstrom Didn't Know. -
Albatross at 04:08 AM on 10 March 2011The Earth's Sixth Mass Extinction May Be Underway
Another thread, and yet more examples of 'skeptics' and contrarians talking through their hats, obfuscating, arguing strawmen and derailing the thread. The substance of their argument, if any, seems to boil down to it has happened before, it is not bad.....even the ostriches must be feeling threatened by this behaviour. How about actually making an effort to critique the methodology etc. (anything scientific) about Barnosky et al. (2011). And by critiquing i do not mean hand waiving, I mean substantive, scientific critique with supporting evidence and citations. Then, at that point you may perhaps consider submitting a comment to Nature demonstrating how they (allegedly) got it all horribly wrong. Phila@32, very insightful comments by Prof Hart. -
Gilles at 04:07 AM on 10 March 2011A Real-World Example of Carbon Pricing Benefits Outweighing Costs
JMurphy : do you call the Prius an EV ? surprising ... ANd I repeat : I do not take as granted the speculations about 2020. I'm just looking at ordinary people around me. I said a few hundreds of VE have been really delivered. There may be some thousands per year in the coming years, but it won't change anything to the CO2 world production. There are some specific uses for which electric cars may be interesting, but I bet that it will never be a majority of cars - and I maintain that the overall carbon budget is not that interesting : you'd better buy a small ,economic thermal engine car.Moderator Response: [Dikran Marsupial] JMurphy clearly indicated that the Prius was a hybrid. -
RSVP at 03:52 AM on 10 March 2011The Earth's Sixth Mass Extinction May Be Underway
nealjking #17 "Before expecting other people to come up with a recommendation, it's appropriate to recognize the problem." Paradoxically with overpopulation, as it becomes more real, you have that many more people to convince they are part of the problem. -
Phila at 03:51 AM on 10 March 2011The Earth's Sixth Mass Extinction May Be Underway
Does it mean that we should abandon our cities and let bears and wolves come back? I've asked before, and I'll ask again: what is it with "skeptics" and strawmen? I can't be the only one who's sick of this inactivist boilerplate about how addressing a given environmental problem — i.e., acting like the responsible, intelligent people we claim to be — is going to force us all to gnaw roots while shivering in caves. If you ask me, people who find it emotionally easier to forfeit biodiversity and ecosystem services than to question economic dogmas founded on a basic denial of science and logic will probably do a lot more for the cause of city abandonment than anyone who's counseling climate action now. Several of the comments in this thread remind me of a passage from Dominion by Matthew Scully, who was one of George W. Bush's speechwriters: It is the same fundamentally vulgar vision of man that conservatives elsewhere so earnestly worry about....man the all-conquering consumer facing the universe with limitless entitlements and appetites to be met no matter what the costs.... My National Review colleague Jeffrey Hart, a professor at Dartmouth College, captured the attitude nicely...."It is depressing," he writes, "to hear cigar-smoking young conservatives wearing red suspenders take a reductive view of, well, everything. They seem to contemplate with equanimity a world without lions, tigers, elephants, whales. I am appalled at the philistinism that seems to smile at a future consisting of a global Hong Kong." -
Gilles at 03:49 AM on 10 March 2011The Earth's Sixth Mass Extinction May Be Underway
DM : the fact that even you -and all climatoalarmists - do not reduce the problem to a simple minimization of CO2 production is proven by the simple observation that the minimum is very easy to compute : it's zero. But , as everybody knows , "nobody claims we should stop totally using FF just now", and "nobody claims we should go back to Dark Ages". Okaaay. If nobody claims that, it means that everybody is in favor of some kind of compromise between burning fossil fuels, but not too much. So it is NOT a simple minimization.it's a matter of compromise. Just as nobody urges to leave our cities and go back into the woods. Or stop using cars. Or kill all babies to stop demographic expansion. It's ALWAYS a matter of compromise. Now the real question is : if it is all matter of compromise, do you have a definite answer of WHERE the compromise lies exactly ? Mr J.H. says 350 ppm ? Mr XYZ says 450 ppm are ok? some think that 550 ppm or even 700 ppm maybe not that bad after all? Mr KA says that there is no risk anyway that we could reach more than 500 ? do you have a SCIENTIFIC answer ? I'm afraid not. Because who can the hell say how mankind will live in 50 or 100 years? just now, you have mainly billions of people either starving for death or just being hungry, subject to all kinds of diseases because they just don't have drinkable water, and so on. WTF do they care about who will live in 100 years nears seas they will never know ? they don't know where their children will live , or even if they will live. Mucounter : "Then you turn around and suggest "reducing the use of FF may be much more destructive for them than GW," which is either blatant speculation or the result of some detailed knowledge of the human condition now and in the future. If you have that knowledge, please share; absent that, I assume speculation is the case." This knowledge is not difficult to get. http://web.worldbank.org/WBSITE "Growth of about 9 percent per annum since the late 1970s has helped to lift several hundred million people out of absolute poverty, with the result that China alone accounted for over 75 percent of poverty reduction in the developing world over the last 20 years. Between 1990 and 2000 the number of people living on a dollar per day fell by 170 million, while total population rose by over 125 million. China's market-oriented reforms over the last two decades also dramatically improved the dynamism of both the rural and urban economies and resulted in substantial improvements in human development indicators. Official estimates of the adult illiteracy rate fell by more than half, from 37 percent in 1978 to less than 5 percent in 2002, and, indicative of health indices, the infant mortality rate fell from 41 per 1,000 live births in 1978 to 30 in 2002. China has entered the World Trade Organization, shifted its policy orientation from pure growth to overall well being (a xiaokang society), and made the historic switch from net taxation of agriculture to net subsidization."Response: This conversation has gotten far enough off topic to be moved to the thread "It’s too hard." Everybody, not just Gilles, please do so. -
Climate Emergency: Time to Slam on the Brakes
Gilles - Reply to your first question is on It's aerosols. I'm not certain what your second question actually is (as the image did not come through, and it lacked context). Perhaps you could post it on either an aerosol or PDO thread? -
It's aerosols
Gilles "was there a sudden burst of sulphate aerosols in the 40's ?" - Yes. If you were to read the article I linked to, you would have seen that as the second figure: Since such aerosols are fairly short-lived (removed by precipitation), their influence dropped off rapidly once emissions started reducing.
Not that this was the only factor, but it was a major one, and also explains hemispheric differences in the temperature anomaly record:
Since such aerosols are fairly short-lived (removed by precipitation), their influence dropped off rapidly once emissions started reducing.
Not that this was the only factor, but it was a major one, and also explains hemispheric differences in the temperature anomaly record:
 All credit goes to Tamino for these images and data.
-
Rob Honeycutt at 03:36 AM on 10 March 2011The Earth's Sixth Mass Extinction May Be Underway
ClimateWatcher @ 27... Your arguments here are essentially the same as to say, "Well, humanitarian atrocities are a normal process that humans go through once in a while, so what-the-heck." Regarding keeping temperatures below the HCO, that's not the concern here. We are currently about 1C below the HCO. If we could hold global temperatures steady at 2C over preindustrial, that's is essentially right about the danger point. The concern here is the business-as-usual scenario that puts us at 2 doublings of CO2 over preindustrial. Add in slow feedbacks and permafrost melt and that, my friend, has the ring of "game over" written on it. If you're of the DEVO generation (as I am) then you and I are going to have no problem. This is unlikely to affect us in a dramatic or catastrophic way. But my kids, who are currently 5 and 7, when they are my age this issue is going to be the only thing they are dealing with. Unless we do something about it now. -
muoncounter at 03:25 AM on 10 March 2011The Earth's Sixth Mass Extinction May Be Underway
Gilles, "many people adopt (over)simplified thoughts, reducing all the problems to a simple numbers" I suspect that if we did not discuss such numbers, you would object that since we don't know an 'average temperature' or 'co2 concentration,' we can do nothing about them. Your arguments are tending more and more to the non-scientific: 'I live in the real world,' 'who tells what the planet wants?' etc. Then you turn around and suggest "reducing the use of FF may be much more destructive for them than GW," which is either blatant speculation or the result of some detailed knowledge of the human condition now and in the future. If you have that knowledge, please share; absent that, I assume speculation is the case. Some would argue that we are an intelligent species; certainly we know how to count and therefore how to measure. Without measurement and 'indices,' we cannot make educated decisions. In the context of this post, without a count of living species, we cannot determine the ecological consequences of our actions. Because in the real world, actions have consequences; some are beneficial, others tragic. If the part of the real world in which you live does not work that way, I envy your position. -
MattJ at 03:25 AM on 10 March 2011Examining Hansen's prediction about the West Side Highway
The diffidence of the conclusion of this post typifies why we are losing this debate. Why, you make it sound like Hansen said the highway would be under water in 40 years given doubled CO2 instead of in only 20 years. That still sounds implausible, not at all helpful to getting people to take the issue and the predictions seriously. -
Rob Honeycutt at 03:24 AM on 10 March 2011The Earth's Sixth Mass Extinction May Be Underway
ClimateWatcher @ 10... Do you honestly not understand the difference between weather and climate? It's really hard to take you seriously on anything when you don't even understand such elemental aspects of climate. -
RickG at 03:13 AM on 10 March 2011Climate Emergency: Time to Slam on the Brakes
@ Gilles #63 Could you add a little context to that post? -
ClimateWatcher at 03:10 AM on 10 March 2011The Earth's Sixth Mass Extinction May Be Underway
#19 Bern, You don't seem to be all that bothered by the prospect of species extinction & natural selection. Extinction and natural selection are, of course, how we and every other creature came to be. Thing is, homo sapiens is nothing special, such evolutionary pressures apply to us, too Now you're gettin' it. What makes you so sure that your grandchildren & great-grandchildren will be in the "fit" category and not the "non-fit" one? Nothing. That's what being a life form entails. The thought that we might see that kind of evolutionary pressure on the human race again saddens me, Evolutionary pressure is what lead to human brain size and opposable thumbs! Be glad for evolution! You are probably too young to remember the rock group Devo, which was short for DE-volution - a lament that evolutionary pressures were lacking not too high. even more so that many "skeptics" don't seem to care about the hundreds of millions of people whose lives are at risk if even half of the IPCC projections come to pass. The observed trends in temperature increase are all below even the rate of the 'Low Scenario' from the IPCC. And even if temperature reached the 'Low Scenario' that's still less than the temperatures of the Holocene Climatic Optimum. It was during the HCO that human civilization advanced! Remember the Mesopotamian 'Cradle of Civilization?'.Moderator Response: [DB] You are incorrect on many counts.Firstly, current temperatures have already equaled those of the HCO, AKA the Holocene Altithermal (Hansen, 2011). Secondly, emissions are trending at the IPCC "High" emissions level. Lastly, it was exactly the climate stability of the HCO that allowed the development of agriculture. With the warming of the planet still in the pipeline, and the ensuing desertification to come as a result, all that remains is to update the following graphic with an arrow and the label "Agriculture Ends Here":

-
Gilles at 03:01 AM on 10 March 2011Climate Emergency: Time to Slam on the Brakes
2 questions, KR : 1) was there a sudden burst of sulphate aerosols in the 40's ? 2) is the PDO index sensitive to sulfate aerosols, according to actual physics ? ( -Broken image deleted- ) (source : http://jisao.washington.edu/pdo/)Moderator Response: [DB] The PHP here doesn't take kindly to TIF's; PNG or GIF is preferred. Also, your comment is too far off-topic of the post; please separate your questions and post them on the appropriate post and then place a comment here linking back to them. KR will see them there. -
JMurphy at 02:32 AM on 10 March 2011A Real-World Example of Carbon Pricing Benefits Outweighing Costs
Gilles wrote : "As I said, I live in the real world and not in the world of experts and scientific publications..." That is surprisingto read, because you seem to be missing out on all those hybrids too : As Gas Prices Rise, Toyota's Hybrid Sales Pass 3 Million As for electric cars, the article linked to above also claims that electric cars will account for 7.3% of all light vehicles sold in 2020. And how about this from last September : The good news is that the electric LEAF seems to be very hot. Nissan was expected to reach 20,000 reservations around the time of launch in December, but interest has been so high that they've reached that milestone 3 months in advance. The bad news is that if you are interested in getting a Nissan LEAF but were indecisive about reserving one, it's now too late. Nissan won't take any new reservations for the LEAF until 2011. I think everything suggests that there are quite a few more than the "few hundreds" out there (even now) than you reckon. -
Dikran Marsupial at 02:10 AM on 10 March 2011The Earth's Sixth Mass Extinction May Be Underway
Giles@24 The key issue is weighting our short term interests against our long term interests (sadly human nature generally tends to focus on our short term interests as individuals at the expense of our long term interests as a society/species, which is why we are faced with the problem under discussion). Whether you can convert that into a simple maximisation/minimisation problem depends on the level of abstraction/complexity at you need to work. Focusing on CO2 emissions, for the vast majority of us, is entirely sensible. While CO2 is not the only problem, it is the one we can control most easily as individuals; the problem of climate change can be considerably alleviated by focussing on that one issue first. It is a matter of prioritization; it is much better to take action that solves most of the problem, than doing nothing to address the problem because we spend all our time worrying about the complexity of the fine details. So, no, I don't agree - single indices are useful and have their place. -
littlerobbergirl at 02:01 AM on 10 March 2011The Earth's Sixth Mass Extinction May Be Underway
oops 'nutrient' cycling web. dana, it's possible all the extinctions are down to co2, even the impact(s); the deccan traps were opposite the k/t impact site, and there seems to be a depression in eastern antarctica that might be a truly huge crater directly opposite to where the siberian traps were at the time of the permian extinction. -
Gilles at 02:01 AM on 10 March 2011The Earth's Sixth Mass Extinction May Be Underway
DM : I can totally agree with what you're saying - the only thing we'll do is managing the planet in our own interest. Do you agree at turn that it cannot easily converted into a "simple" minimization/maximization of a single index like those I mentioned above ? -
Watson at 01:58 AM on 10 March 2011Crux of a Core, Part 2 - Addressing Dr. Bob Carter
With respect to 'legitimate' credentials of climate scientists, I attended a Monckton presentation in Noosa, Qld, in January, 2010, where Monckton was introduced by Dr Carter. Carter announced to that credulous audience that Lord Monckton's qualifications as a MA (Classics and Maths) were ideal to equip him to speak on the subject of Climate Change - so I guess that makes anyone and expert. -
Gilles at 01:55 AM on 10 March 2011A Real-World Example of Carbon Pricing Benefits Outweighing Costs
Thanks all for your answers. As I said, I live in the real world and not in the world of experts and scientific publications (which I read professionally when it is about real science, however). I do not know anybody owning an electric car. I perfectly know that many electric models are proposed on the market, and even that a few hundreds have been sold. I'm just saying it has not changed an inch in the oil consumption - the only visible reduction has been through a massive economic recession , that's all. And the next crisis is about to come with the again climbing to heaven oil prices - you know crisis because of inflation, debts, unemployment, all these dirty things that won't be solved by the nice EV you can see just above, nor by thousands of windmills. -
littlerobbergirl at 01:50 AM on 10 March 2011The Earth's Sixth Mass Extinction May Be Underway
sob! pikaia, more species means more resilience, more 'redundancy' or 'slack' in the system. a system of many species eating many others in a varied cycling web is going to be much less likely to collapse than one of just a few components. that's why i'm keeping a close eye on krill. -
Climate Emergency: Time to Slam on the Brakes
gallopingcamel - Tamino is very aware of pre-1975 temperature records. I would recommend looking at his article on Anthropogenic Global Cooling: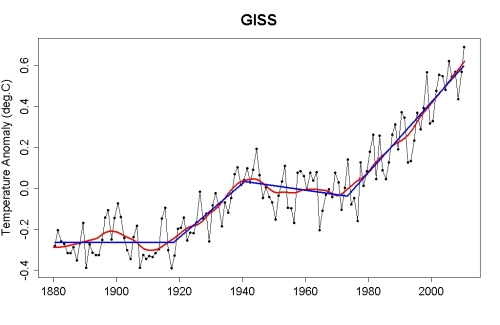 Here he discusses the sulfate aerosols in mid-century that caused a climate cooling - said aerosols being cleaned up in the early 70's due to pollution controls.
Again, accounting for the forcings on the climate, and using actual physics, it's possible to clearly identify the trend in average temperatures caused by increasing greenhouse gases.
Here he discusses the sulfate aerosols in mid-century that caused a climate cooling - said aerosols being cleaned up in the early 70's due to pollution controls.
Again, accounting for the forcings on the climate, and using actual physics, it's possible to clearly identify the trend in average temperatures caused by increasing greenhouse gases.
-
Dikran Marsupial at 01:45 AM on 10 March 2011The Earth's Sixth Mass Extinction May Be Underway
Giles@21 Yes really, we manage the planet primarily in our own interest. Who told us that? Nobody, we as a species have decided that we are in charge. Who tells us what the planet wants? Nobody, and we probably wouldn't listen anyway. However, we are managing the planet in our interest and it happens to be in our long term interest to preserve the natural environment in a state that best supports us. That happens to include avoiding mass extinctions. No "anthropomorphic projection" is required, just thoughtful self-interest (as a species rather than as individuals) will do nicely. "So how far do you think we have to go to let "nature" go back to its original state?" As far as it is prudent for our long term interests as a species. As to "simple thoughts" the underlying "simple though" is that we should avoid unnecessary change in our environment, as change requires adaption, which may not be pleasant. The numbers help focus on what we need to do to avoid unnecessary change, but that is about all. -
Gilles at 01:29 AM on 10 March 2011The Earth's Sixth Mass Extinction May Be Underway
We ARE the "management of the planet." Really? first, who told that ? and second, who tells what the planet wants ? as far as I can see, our vision of the planet is mainly our own anthropomorphic projection. We care about mammals, some birds, some other vertebrates, not so much about microorganisms for instance. But ok, let's assume we have to take care of all these species. Does it mean that we should abandon our cities and let bears and wolves come back? or not? why not ? Bern : i just notice that GW is a minor component of species extinction, and that the main reason is just demography - and the need to feed billions of people, plus all the minerals we extract from the earth to make all the gagdets of civilization. For instance, electric cars need as many roads and as oil powered ones, and a lot of metals or plastics and so on. And if you want to spare lives of hundreds of millions of people (barring the fact that reducing the use of FF may be much more destructive for them than GW), this will eventually WORSEN the demographic pressure on natural resources. So how far do you think we have to go to let "nature" go back to its original state? The whole picture for me is that many people adopt (over)simplified thoughts, reducing all the problems to a simple numbers ("average temperature", "CO2 concentration", "number of living species") and basically saying that the only thing to do is minimizing (or maximizing) these numbers, whatever the consequences are. Reality is much more complex - which explains that these people persistently complain about the fact that nobody seems to obey their simple thoughts. -
ClimateWatcher at 01:26 AM on 10 March 2011The Climate Show Episode 8: Kevin Trenberth
Alexadre, No one knows what the albedo is much less was. The entire signal of a CO2 doubling can submerge within the fuzzy noise of the albedo uncertainty or within the uncertainty of outgoing radiation. That does not mean CO2 forcing doesn't exist, just that we cannot measure it. -
pikaia at 01:19 AM on 10 March 2011The Earth's Sixth Mass Extinction May Be Underway
Don't mock mass extinctions, without the last one we wouldn't be here! I am not clear why people regard mass extinction as a bad thing. While mass extinction would make the world less interesting, with fewer of the charismatic megafauna to see on TV and in the zoos, the species that are useful to us should survive as long as we do, with our protection. So would another mass extinction do us much harm compared to all the other damage we are doing to ourselves? We don't particularly need millions of species, and neither does the Earth. -
JMurphy at 00:48 AM on 10 March 2011Crux of a Core, Part 2 - Addressing Dr. Bob Carter
Very commendable, Rob. Although you state that you're not a scientist, you obviously are scientifically competent enough to put to shame the likes of those, such as Carter (I'm loath to dignify him with his scientific title), who are willing to misuse/abuse/misinform/disinform - whatever his excuse is. -
Bern at 00:37 AM on 10 March 2011The Earth's Sixth Mass Extinction May Be Underway
To ClimateWatcher & Gilles: You don't seem to be all that bothered by the prospect of species extinction & natural selection. Thing is, homo sapiens is nothing special, such evolutionary pressures apply to us, too (although we are capable of modifying our environment somewhat to suit us). The thing is, as I saw it put recently: Evolution works by death. "Survival of the fittest" means the non-fit don't survive to breeding age - in the case of humans, that's about 12-16 years of age. What makes you so sure that your grandchildren & great-grandchildren will be in the "fit" category and not the "non-fit" one? The thought that we might see that kind of evolutionary pressure on the human race again saddens me, even more so that many "skeptics" don't seem to care about the hundreds of millions of people whose lives are at risk if even half of the IPCC projections come to pass. We've just spent the past couple of centuries battling to decrease mortality rates, especially in children. It seems more than a shame to throw that progress under the "business as usual" bus.
Prev 1879 1880 1881 1882 1883 1884 1885 1886 1887 1888 1889 1890 1891 1892 1893 1894 Next


