


 Arguments


Recent Comments
Prev 1882 1883 1884 1885 1886 1887 1888 1889 1890 1891 1892 1893 1894 1895 1896 1897 Next
Comments 94451 to 94500:
-
Arkadiusz Semczyszak at 22:34 PM on 8 March 2011Interactive animation of the climate change impact on agriculture
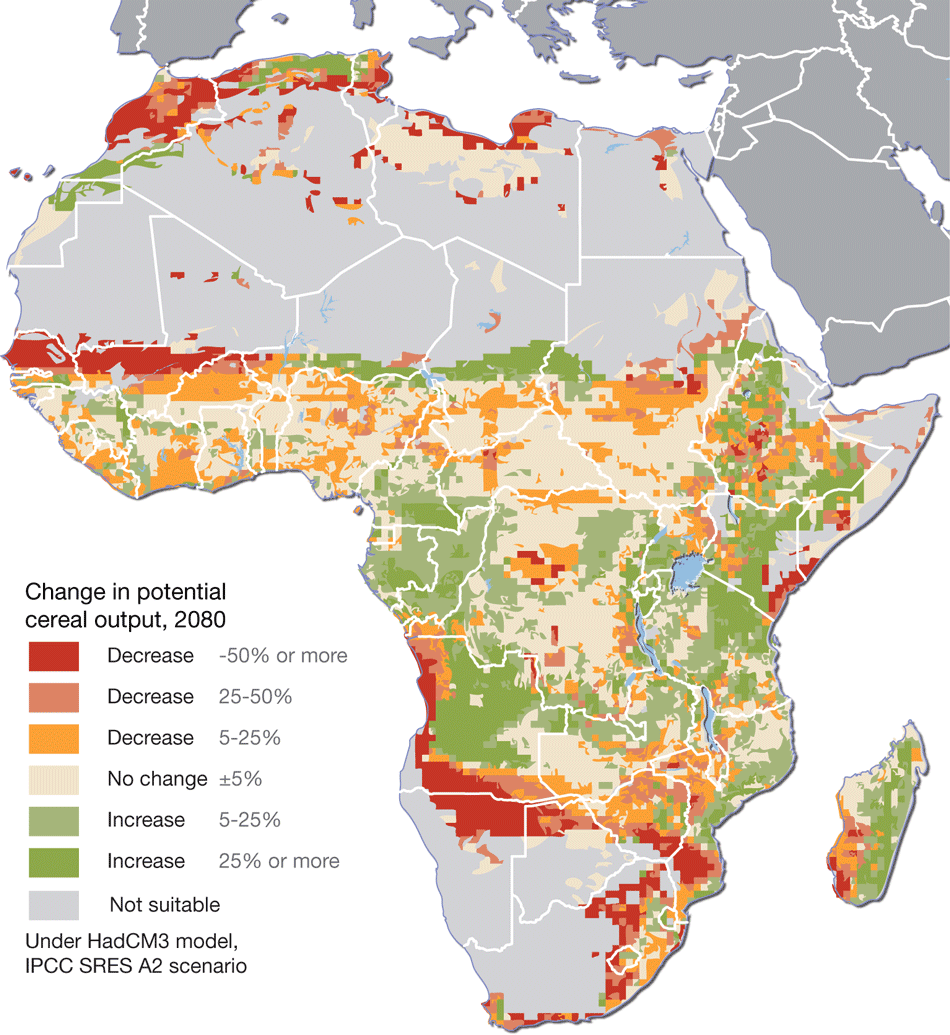
This comment is ... But first, arguments - later opinion. Once again, the drought in Eastern and Central Europe is linked to the sharp change in ENSO from LN to LN - rapid drop (June - July) in temperature of the oceans (typical for the past two decades). This phenomenon causes changes in atmospheric circulation - effects ? - such as droughts in China. Just as in 2003 and 2006 - violent La Nina (need not be a big change - as the 2007 / 8, but it must be quick - rapid change) = drought in many areas of NH. Warming = warm winters. 1. I am eng. agro-meteorologist. 2. Generally, both the higher concentration of CO2 and temperatures favor most crops. It is textbook knowledge. Any cause of climate change in some areas of decline in the growth of other cereal production. The most visible example of this in Africa. “Projected impacts relative to current production levels range from −100% to +168% in econometric, from −84% to +62% in process-based, and from −57% to +30% in statistical assessments.” (Climate change risks for African agriculture, Müller et al., 2011.) Model Mann & Babb is too simple, would be real ... -
MarkR at 21:31 PM on 8 March 2011Climate Emergency: Time to Slam on the Brakes
"I wonder if SkS should switch entirely to how we move public opinion and therefore the politicians? The scientific case is iron-clad (despite the protestations of a few posters)." I completely disagree with that... Very few sites provide SkS' level of analysis with such accessibility. IMO SkS is about using the scientific method to cut through the rubbish. That's been done very well for the physical science: SkS has clearly pointed out that it's not the Sun causing global warming, but on the other hand that 7 metres of sea level rise isn't going to happen tomorrow. In terms of actions, it's a lot harder. But taking the approach of explaining the effects of different policies based on peer reviewed work so that those with a political bent can make informed decisions is where SkS should be IMO. That's what James' article here is about: explaining the evidence behind claims of climate sensitivity and why this should be factored into any risk analysis for the future. -
johnd at 21:29 PM on 8 March 2011Interactive animation of the climate change impact on agriculture
The Ville at 21:08 PM, the claimed low rate of correlation of growth versus CO2 is very much reminiscent of trying to find trees whose tree-ring measurements reflected temperature driven growth. What percentage of trees in what percentage of sites worldwide have been able to provide suitable trees? Would it be that the same problem affects those trees as that which Briffa found with his trees and his divergence problem. -
ranyl at 21:25 PM on 8 March 2011Climate Emergency: Time to Slam on the Brakes
Not sure that paleoclimatic records support CS is 3C...they seem to point to it being somewhat higher! "Together, it is clear that during the Cretaceous and Paleogene climate sensitivity commonly exceeded 3°C per CO2 doubling." "Fossil soils constrain ancient climate sensitivity" Dana L. Royer1, PNAS | January 12, 2010 | vol. 107 | no. 2 | 517–518, Birgit Schneider and ralph Schneider "Global warmth with little extra co2" nature geoscience | VOL 3 | JANUARY 2010 |pg 6, "The conclusion of a high Earth system sensitivity5,13 is particularly worrying if there is a potential for the hitherto slow components of the climate system to respond more quickly in the face of rapidly increasing CO2 emissions." In this paper the CS long term (1000yr say) with all natural variation taken into account is ~8-12C, "If changes in carbon dioxide and associated feedbacks were the primary agents forcing climate over these timescales, and estimates of global temperatures are correct, then our results imply a very high Earth-system climate sensitivity for the middle (3.3 Myr) to early (4.2 Myr) Pliocene ranging between 7:1 +/- 1:0C and 8:7 +/-1:3 C per CO2 doubling, and 9:6=+/-1:4 C per CO2 doubling, respectively." "High Earth-system climate sensitivity determined from Pliocene carbon dioxide concentrations" Mark Pagani1*,NATURE GEOSCIENCE j VOL 3 j JANUARY 2010 "The surface in our PE control simulation is on average 297K warm and ice-free, despite a moderate atmospheric CO2 concentration of 560 ppm. Compared to a pre-industrial reference simulation (PR), low latitudes are 5 to 8K warmer, while high latitudes are up to 40K warmer." Warm Paleocene/Eocene climate as simulated in ECHAM5/MPI-OM M. Heinemann, Clim. Past, 5, 785–802, 2009 On average the PE was 9.4C hotter with large polar amplification and a CO2 basically double, so that makes CS 9.4C. It must be remembered that 1000yr CS from Paleo data is higher than the 100CS used in models, the 100CS is about 60% of the 1000yr. So for the long term 9.4C that is 5.64C and so on, "If the temperature reconstructions are correct, then feedbacks and/or forcings other than atmospheric CO2 caused a major portion of the PETM warming." "Carbon dioxide forcing alone insufficient to explain Palaeocene–Eocene Thermal Maximum warming" Richard E. Zeebe1, Nat. Geo. PUBLISHED ONLINE: 13 JULY 2009 | DOI: 10.1038/NGEO578 In this one the CS is about 9-12C again, but as in the quote the authors feel the CO2 CS is a definitive and thus say another factor is necessary rather than CS being higher. There are plenty more of these and the recent article in science again suggesting CS is underestimated and the article last year by Gavin Schmidt saying it was 30-40% down. It does seem to make no sense to me that the CS is going to a standard figure all the time, as it is dependent on multiple none-linear feedbacks the size of which varies depending on the initial conditions. How can Earth with no ice albedo feedback have the same CS to GHG as one with loads of ice? One with no permafrost have the same CS as one with ,lots melting? At present we have a polar ocean melting, and lots of permafrost to melt. It also clear form this paper that temeprature changes can be dramatic and tipping point in nature, ("Another look at climate sensitivity" I. Zaliapin1 and M. Ghil2,3 Nonlinear Processes in Geophysics), so trying to get a statistical CS from paleodata isn't going to easy as the CS is dependent on initial conditions, and many studies suggest it is higher than thought or modelled, it is more likely that the PDF of CS should be a range humps and bumps ranging long twerm from 6-12C. Which hump the world is currently at is hard ot say, but with polar sea ice to go and permaforst etc, it is likely to be on the high side of things probably. "The conclusion from this analysis—resting on data for CO2 levels, paleotemperatures, and radiative transfer knowledge—is that Earth’s sensitivity to CO2 radiative forcing may be much greater than that obtained from climate models ( 12– 14)." "Lessons from Earth’s Past " Jeffrey Kiehl;14 JANUARY 2011 VO 158 L 331 SCIENCE SO yeah things are urgent very very urgent, for a CS as high as suggested from the past means 350ppm gives a 95% probability spread of temperautre rise by 2100 of 1.8-3C. Now how are we going to get 40ppm of CO2 out of the atmopshere, especially considerign that some models suggest that the CO2 that gone into the sinks will be released and there is of course the climate warming CO2 feedback with gives out about 10-20ppm per 1C. How high can CO2 go before the accumulation of heating is too much for 2C not be a definitive, 400ppm peak, even that seems risky buisness considering. Of course the present CO2 is 390ppm, so to peak at 400ppm would mean only adding another 5 year or less carbon into the atmosphere, divide that up fairly arround the world and it means the west has 1 year of emissions to play with for a carbon budget, so not much and considering all the adaptation that will be needed not much at all. Does anyone think that this is in anyway doable? If bold plans like ZeroCarbonBritain by 2030, cause peak CO2 of 434ppm and that isn't counting all the extra carbon needed to replace everything (cars with electric cars, power infra-structure, all white goods for efficient ones, changing the face of farming etc). And also remember the biosphere basically are only hope of drawing CO2 down (carbon cpature is a ruse to keep using fossil fuels and there isn't enough energy in the world to run special CO2 exchange machines and where do we put the carbondioxide for it seems to leaking from the all sites it has been burioed at so far!!). Is a fossil fuel free society even possible anymore? For that would take changing the whole economic system as the current system has to grow and the only way for that to occur is by using fossil fuels. The only way to get CO2 out the atmosphere quickly is to stop putting in quickly and the only way to do that is stop using power. -
Paul D at 21:08 PM on 8 March 2011Interactive animation of the climate change impact on agriculture
Camburn: "Each study I have read concerning co2 and plants results in a higher level of co2 being benifical for plant growth." Then your reading is biased. Read wider. Do trees grow to infinity by continually adding CO2? http://www.uoguelph.ca/news/2010/10/forests_arent_t.html "Studying archived tree-ring measurements held by the National Oceanic and Atmospheric Administration in the United States, they found CO2 fertilization spurred faster tree growth at only about 20 per cent of sites worldwide, despite the fact that the gas typically accelerates growth in plants." -
Paul D at 21:04 PM on 8 March 2011Interactive animation of the climate change impact on agriculture
adrian smits: "As a farmer I know that you need heat units to grow crops and the corn belt in north America has been moving north for years.We consider this a blessing that allows us to grow crops with higher yield and it gives us a greater choice as to what we can grow." God bless America and screw everyone else! What sort of choices are there in deserts? As I said, humanity needs biodiversity, just as much as corn and wheat. -
johnd at 20:32 PM on 8 March 2011Interactive animation of the climate change impact on agriculture
muoncounter at 15:53 PM, the objective of the study you introduced, can first be deduced from this second sentence in Longs introduction,- "The CO2 fertilization factors used in models to project future yields were derived from enclosure studies conducted approximately 20 years ago." note the word models. This is then elaborated on in the paragraph headed- "How have CO2 fertilization factors been derived?" Which begins with "Most models used to predict future crop yields, including those within the IPCC (5), are from two families: ............" The final paragraph notes- "The FACE experiments clearly show that much lower CO2 fertilization factors should be used in model projections of future yields;....." It seems patently clear to me that the "food for thought" is really all about the adequacy or otherwise of the models being used as benchmarks. -
iana at 20:17 PM on 8 March 2011Climate Emergency: Time to Slam on the Brakes
@15 Probabilistic Forecast for 21st Century Climate Based on Uncertainties in Emissions (without Policy) and Climate Parameters maybe read first then comment -
iana at 20:11 PM on 8 March 2011Climate Emergency: Time to Slam on the Brakes
@14 CO2 lags temperature - what does it mean? -
Gilles at 20:11 PM on 8 March 2011Climate Emergency: Time to Slam on the Brakes
another remark :" CO2 is rising by 2 ppm per year as we continue to burn fossil fuels.... Under business as usual, we are heading for up to 1,000 ppm by 2100" of course a simple computation shows that 1,000 ppm by 2100 requires an average +15 ppm/yr, more than 7 times the current rate. Obviously this is only possible with an exponential growth throughout the century - exponential growth is a very useful tool to predict a lot of catastrophe since it requires only a small number of doubling times to reach any reasonable threshold. The basic question is however : how long is an exponential growth sustainable ? -
Gilles at 19:42 PM on 8 March 2011Climate Emergency: Time to Slam on the Brakes
Rob, Bern, thanks, but I still don't understand the answer : why did temperature decrease so much although CO2 remained constant during several centuries? what was the driver then ? -
Bern at 18:51 PM on 8 March 2011Climate Emergency: Time to Slam on the Brakes
Gilles @ 10: that's what climate models are for, to take into account the many disparate factors that affect climate. And there are a lot more than just two factors in this particular feedback system... In any event, the lead/lag of CO2 w.r.t. Temperature is dealt with by this SKS page. I highly suggest you read the intermediate version, and discuss it there. -
Rob Painting at 18:49 PM on 8 March 2011Climate Emergency: Time to Slam on the Brakes
Gilles @ 10- Q. maybe you could explain why temperatures often decrease BEFORE CO2 (e.g., -280 000 , -215000, -130000) A. Woolly mammoths and saber-toothed tigers didn't drive SUV's. -
Bern at 18:47 PM on 8 March 2011Climate Emergency: Time to Slam on the Brakes
Actually, Bob, while that may be the fastest response, a better approach would be: "Persuade Republicans (and other conservative groups) that climate change is real & needs to be addressed." Of course, that's likely to be a *lot* harder, particularly with the disinformation being promulgated by special interest groups who are opposed to climate action on (mostly) financial grounds. It's like farriers & stable owners lobbying to have motorcars banned on 'safety' grounds, except in this situation they're getting awfully close to succeeding... (especially as the benefits of climate action are a lot harder to see than the benefits of motor vehicle use!) alan_marshall: don't forget the polar amplification effect - a 10ºC warming at the poles may be much less on a global scale. Having said that, Hansen argues that the interglacial peaks in the proxy records are constrained by non-temperature factors, so the actual temperature may have been higher. He also argues that we might see 5 metre sea level rises by the end of the century, with another 20 metres over the next few centuries. (see here for details) So, yeah, the long-term challenge is great. It's certainly been acknowledge by the climate science side of the debate. The other side has just barely acknowledged that it's even warming... -
Gilles at 18:33 PM on 8 March 2011Climate Emergency: Time to Slam on the Brakes
Alan : If I have misinterpreted this graph, will someone please explain it to me? maybe you could explain why temperatures often decrease BEFORE CO2 (e.g., -280 000 , -215000, -130000) , after the spike ? and also explain how you can disentangle the sensitivity of temperature with respect to CO2, and the sensitivity of CO2 with respect to temperature (there are TWO factors in a feedback system)Moderator Response: This is discussed in the thread "CO2 lags temperature". - James -
Bob Guercio at 18:23 PM on 8 March 2011Climate Emergency: Time to Slam on the Brakes
actually thoughtfull at 16:24 PM on 8 March, 2011 said: "I wonder if SkS should switch entirely to how we move public opinion and therefore the politicians? The scientific case is iron-clad (despite the protestations of a few posters). We need to figure out how to move people, politicians and nations towards action." Bob Guercio's response: "Vote Democratic in the United States" -
alan_marshall at 18:09 PM on 8 March 2011Climate Emergency: Time to Slam on the Brakes
Hansen's findings confirm my worst fears. I have long been concerned that the medium-term models are understating long-term climate sensitivity. Have a fresh look at the familiar Vostok ice core data above, which plots the results through four ice ages and five interglacial periods. Notice that both CO2 and temperature spike at the start of the interglacial periods. The pattern is consistent. An increase in CO2 from 180 to 280 ppm is associated with a rise in temperature at the poles of more than 10°C. The increase in CO2 is less than double, yet the increase in temperature is greater than projected for doubled CO2 in medium-term models. I see this as evidence the estimates for climate sensitivity derived from such models are likely to be conservative.
If I have misinterpreted this graph, will someone please explain it to me? If I have correctly interpreted it, the long-term challenge is greater than has so far been acknowledged.
Moderator Response: [DB] Fixed html issue.
Have a fresh look at the familiar Vostok ice core data above, which plots the results through four ice ages and five interglacial periods. Notice that both CO2 and temperature spike at the start of the interglacial periods. The pattern is consistent. An increase in CO2 from 180 to 280 ppm is associated with a rise in temperature at the poles of more than 10°C. The increase in CO2 is less than double, yet the increase in temperature is greater than projected for doubled CO2 in medium-term models. I see this as evidence the estimates for climate sensitivity derived from such models are likely to be conservative.
If I have misinterpreted this graph, will someone please explain it to me? If I have correctly interpreted it, the long-term challenge is greater than has so far been acknowledged.
Moderator Response: [DB] Fixed html issue. -
Gilles at 18:05 PM on 8 March 2011A Real-World Example of Carbon Pricing Benefits Outweighing Costs
dana : Gilles #72 - "Oil is needed for transportation, heating" No it's not. Transportation can be accomplished with electric vehicles to a large degree, and there are alternatives to heating with oil." Dana, I'm speaking of current facts. Oil IS NOT used for electrical power in developed countries, so the "alternatives" you mentioned are simply not relevant to replace it. Oil IS used for 98 % of transportation. You may imagine that electric cars could replace it, but they don't develop even if the barrel hit 150 $ - instead, we have recessions that make simply more people poorer - which doesn't help them to buy expensive electrical cars of course (BTW , the electricity is mainly made from fossil fuels in the world, so even electric cars wouldn't change the CO2 production). I'm just living in a real world. " "mainly because climate is hotter, maybe ?" No, because California has implemented energy efficiency technologies. Our per capita energy consumption has barely increased over the past 30 years. The rest of the country's has increased significantly." I don't know the figure for all US states; I'm just noticing the "barely increased" ... " "without carbon, there is nothing but the poorest life you can imagine." First of all, nobody is saying we're going to eliminate all carbon, and secondly, claiming that we can't have a high tech lifestyle without massive carbon emissions is utterly absurd." I am saying that we're going to eliminate all fossil carbon, just because it is a finite resource, and before being exhausted, it will first decrease significantly. And there is nowhere and never a "high tech lifestyle without massive carbon emissions" : stating that it is "utterly absurd" to predict something that happens everywhere and in all times is ... surprising. There are much more facts that show the dependance of modern life on fossil fuels than on average temperature. Actually , ALL facts show that our way of life is totally dependent on FF consumption, and NO fact shows that it depends strongly on average temperature. -
Gilles at 17:53 PM on 8 March 2011Climate Emergency: Time to Slam on the Brakes
sorry a part of sentence is missing. (dC/dT)c is the variation of fossil fuel consumption necessary to get a climate change per unit T. -
Gilles at 17:51 PM on 8 March 2011Climate Emergency: Time to Slam on the Brakes
always the same strange assumptions, that the life of mankind is very sensitive to the temperature, but very insensitive to the fossil fuel consumption, whereas all objective data and facts show exactly the opposite. Try a simple exercise. Adopt a "wealth indicator" X (it can be GDP but also any fancy indicator you want). By comparing different countries, compute the "sensitivities" dX /dT and dX/dC where T is the local average temperature and C the fossil fuel consumption. Then to compare dimensionnally comparable constants, compute dX/dT and dX/dC. (dC/dT)c where the latter factor is the variation of fossil fuel consumption. Give me the result, and conclude.
Moderator Response:Climate change isn’t only about temperature. With global warming comes
• Ice sheet collapse and sea level rise, as discussed in my article.
• An intensification of the water cycle which paradoxically means both more intense rainfall and more droughts.
• Expansion of the drought-ridden subtropics.
• Glacier melt, which will cause water shortages for hundreds of millions of people.
• Amplifying feedbacks which cause more warming.
• Also, the unusually rapid rate of global warming we are causing will make it very difficult for ecosystems – not to mention humans – to adapt.
• In addition to global warming, fossil fuel burning is causing ocean acidification faster than it occurred in the Paleocene-Eocene Thermal Maximum.
• I could go on.
And of course wealth is correlated with fossil fuel consumption, because that’s currently where we get most of our energy from. The whole point is we need to change that. - James
-
Bern at 17:37 PM on 8 March 2011Climate Emergency: Time to Slam on the Brakes
rpauli: Going cold turkey on fossil fuel is nice in theory, but in practice? Economic disaster, is how I'd describe it. Which is really sad, because it's really what needs to be done. The next best thing is the "gradual phase out", which can be achieved by simply saying "no more coal-fired plants may be built or refurbished". That's a big call on it's own, but it'd certainly put the wind up the power generators to develop alternate sources of energy. Of course, in nations like Australia, where the word "nuclear" is immediately associated with "Chernobyl" in the minds of many, the options are limited somewhat. I really hope some of the promising alternate generation techniques get off the ground *fast*. There seems to be great reluctance, however, for investors to back anything other than nice, safe, predictable coal. As per my comments on the Climate Show thread, I think we're going to have to build a lot of rather large, solar and/or nuclear powered CO2 capture plants, to try to reduce atmospheric concentrations faster than natural processes will do so. That truly would be a "World War II" scale effort, but instead of building tanks & planes & bombs, those factories would be producing sequesterable carbon. This may become a requirement for the survival of human civilisation if, for example, we see significant amounts of clathrate or permafrost methane leaking out as the earth continues to warm. Even if we don't see that methane release, we'd still need to take out "extra" CO2, as the oceans would release plenty more as atmospheric concentration dropped. Herculean effort? I'll say... (Somewhat depressing, aint it?) -
r.pauli at 17:11 PM on 8 March 2011Climate Emergency: Time to Slam on the Brakes
Great posting. The " 1) phase out coal by 2030." - is carbon capitulation. Way too late; too much delay. That gives in to economic interests that caused this problem. Coal combustion should be stopped now. Instead, suggest an ASAP/PDQ approach such that ANY carbon energy is used only for the purpose of establishing clean, renewable energy systems. Starting now. No other use of coal energy shall be permitted.Moderator Response: Obviously that's not feasible - we will need power during the transition. But yes, I agree coal combustion should be stopped ASAP. - James -
mjp at 17:01 PM on 8 March 2011Climate Emergency: Time to Slam on the Brakes
galloping camel i've reviewed a lot of those "others" interpretations in following an interest in this for around 7 years some are simply wrong some are cleverly deceitful others are narrow answers to the wrong question so open your mind your touching faith in the 1% or so that deny the large majority of the scientists isn't touching it's downright dangerous and naieve -
gallopingcamel at 16:49 PM on 8 March 2011Climate Emergency: Time to Slam on the Brakes
You have touching faith in James Hansen who manages to draw "amazing" conclusions from data that others interpret quite differently. -
actually thoughtful at 16:24 PM on 8 March 2011Climate Emergency: Time to Slam on the Brakes
I wonder if SkS should switch entirely to how we move public opinion and therefore the politicians? The scientific case is iron-clad (despite the protestations of a few posters). We need to figure out how to move people, politicians and nations towards action. -
muoncounter at 15:53 PM on 8 March 2011Interactive animation of the climate change impact on agriculture
johnd, Here's how Long describes the source of what you're dismissing as 'models': ... most information about crop responses to elevated CO2 is obtained from studies in greenhouses, laboratory controlled-environment chambers, and transparent field chambers, where released CO2 may be retained and easily controlled. He then compares these artificial hot-house conditions (which are actual results, not models) to long-term real-world outdoor trials. Which result do you think will better match farm experience - for people who don't grow their crops under glass? -
muoncounter at 15:42 PM on 8 March 2011Interactive animation of the climate change impact on agriculture
From Ainsworth 2008 reports on findings with the all-important rice crop (which is not grown in greenhouse gas-enriched closed environments): The rise in atmospheric [CO2] will be accompanied by increases in tropospheric O3 and temperature. When compared with rice grown in charcoal-filtered air, rice exposed to 62 ppb O3 showed a 14% decrease in yield. Many determinants of yield, including photosynthesis, biomass, leaf area index, grain number and grain mass, were reduced by elevated [O3]. While there have been too few studies of the interaction of CO2 and O3 for meta-analysis, the interaction of temperature and CO2 has been studied more widely. Elevated temperature treatments negated any enhancement in rice yield at elevated CO2 ... -
johnd at 15:40 PM on 8 March 2011Interactive animation of the climate change impact on agriculture
muoncounter at 14:28 PM, you are putting the wrong emphasis on the results. The lower yield claim is comparing the FACE trials to those expected by modeling which was based on enclosure trials. It is basically supporting this which I had posted earlier- "Numerous free air carbon enrichment field trials are providing some such data, IIRC, the existing models generally failing to reliably forecast the increased yields many such trials produce." The FACE trials all showed positive responses to the CO2 enrichment for all 3 parameters across all 3 grains. The failure is with the modeling assumptions. Those who actually read the paper will see as much indicated near the end. One of the objectives of the FACE trials was to provide real data that would allow the models to be calibrated rather than just using assumptions. I don't think you'll find the big difference between the greenhouse and the real world, that is fairly well understood by those in the industry. As you have shown, the big difference is between the assumptions being made in the modeler's office and the real world. -
Citizen99 at 15:38 PM on 8 March 2011Human CO2 is a tiny % of CO2 emissions
mikea01 - it is also inaccurate to consider the discussion in these posts as some kind of convocation of "experts" and thus judge that there is little agreement among them. In fact, my perception is that this site tends to be flooded with ramblings from inexpert ideologically motivated denialists whose purpose is to create the exact impression of non-agreement that you are reporting. In fact, it is established beyond doubt that more than 95% of real "experts" (i.e., folks who know what they are talking about) do agree that climate change resulting from the massive combustion of fossilized hydrocarbons is becoming a serious threat to our fragile modern civilization. Please take the time to read one of the excellent books on the subject written by actual experts such as Dr. James Hansen. -
johnd at 15:11 PM on 8 March 2011Interactive animation of the climate change impact on agriculture
adrian smits at 14:18 PM, I agree also. Within agriculture, as with most fields, there is a huge pool of knowledge that has been accumulated along the way. Much of it is considered self evident amongst those who carry it. In many cases, techniques are developed without any formal scientific input, the scientists often left to produce a paper trail long after the practice had become standard procedure. -
actually thoughtful at 14:52 PM on 8 March 2011A Real-World Example of Carbon Pricing Benefits Outweighing Costs
I am not sure we need to divert 100 billion into researching this new, 24/7 non solar, non fossil, non wind, non nuclear answer. If I could control all government spending, sure I would lower spending on say, fossil fuel subsidies or war and increase on long shot total replacements. But the answers are already here. We have a long, long, long way to run before we've begun to utilize solar, wind and wave to meet our needs, as CAmburn points out, nuclear has a role. Why wouldn't every available penny be dedicated to the tested, here-and-now solutions? That is what you would do if you thought it was a critical problem. So I don't think your point hangs together as you dismiss the technologies that are already working (solar, solar for heat, wind, wave, nuclear, etc) in the search for this new holy grail. { - snip - }Moderator Response: [DB] The referenced comment was deleted. -
muoncounter at 14:28 PM on 8 March 2011Interactive animation of the climate change impact on agriculture
adrian s, "adding c02 to greenhouse air is standard practice" Ironic: Greenhouse gases are good for plants in greenhouses. But we're not necessarily talking about plants in greenhouses here. Here's one of those peer-reviewed thingies everybody talks about. Long et al 2008: Free-air concentration enrichment (FACE) technology has now facilitated large-scale trials of the major grain crops at elevated [CO2] under fully open-air field conditions. In those trials, elevated [CO2] enhanced yield by ~50% less than in enclosure studies. This casts serious doubt on projections that rising [CO2] will fully offset losses due to climate change. Apparently there's a big difference between conditions inside the greenhouse and the outside world. -
johnd at 14:26 PM on 8 March 2011Interactive animation of the climate change impact on agriculture
With at least two contributors to this thread known to be real world farmers, this allows some balance to be bought to the subject which is otherwise only about theoretical models based on a few assumptions, some perhaps not even the most relevant. Theories and formulas founded on laboratory experiments ultimately have to be validated against the knowledge accumulated by such real world farmers who operate in a infinitely more variable environment than any lab can recreate. That knowledge is very often supported by reliable data going back generations covering a wide range of variable conditions in an otherwise constant environment, one that is generally very well measured for all the relevant parameters required. As has already been pointed out, there are many more important variables that have to be taken into account, if not for the projections being made, then certainly to allow the models to be calibrated against past data. Numerous free air carbon enrichment field trials are providing some such data, IIRC, the existing models generally failing to reliably forecast the increased yields many such trials produce. Most of the debate about climate change revolve around statistics, theories and formulas, and peer reviewed papers. But there is a real place in the debate for those people, those with dirt under their fingernails, who are in the unique position to be able see whether the way the climate performs in theory is how it actually manifests itself on the ground. Talking of ground, whilst agriculture depends on conditions that exist at ground level and below, virtually none of the measurements, such as temperatures, CO2 are taken from inside the growing zone. With temperatures, especially the extremes, there is generally a great difference between what is measured 1.2m above the surface and what it actually is right in the growing zone. This in understood by the scientists who work in agriculture, but I don't see anywhere where climate scientists use this different set of data.Moderator Response: For some scientific studies of the effects of CO2 and heat, see the summary by the U.S. Dept. of Agriculture, and other studies, linked in the comments of the thread "CO2 is not a pollutant." -
adrian smits at 14:18 PM on 8 March 2011Interactive animation of the climate change impact on agriculture
Camburn is right Michael I have read similar articles.In fact adding c02 to greenhouse air is standard practice because it increases yields dramatically. -
Camburn at 14:14 PM on 8 March 2011Interactive animation of the climate change impact on agriculture
I will state this and then have to head to bed: Each study I have read concerning co2 and plants results in a higher level of co2 being benifical for plant growth. It appears that plants must have evolved during a time when co2 levels were substantially higher than present. Their growth response to co2 is almost like a growth response to nirtrogen/phosphorous etc. People who grow food in greenhouses have known this for years and elevate the level of co2 to compensate. It is not yet practical on a commercial farm scale to do so. If it was, it would have been done. -
Camburn at 14:10 PM on 8 March 2011Interactive animation of the climate change impact on agriculture
I did a quick google. Here is one result. As you can see, this is complicated. Unless you are a farmer and want to stay abreast of this, most won't care. There have been numerous studies done by universities in the US concerning co2 and growth/health/yeild etc. http://news.illinois.edu/news/09/0209co2.html -
Camburn at 14:05 PM on 8 March 2011Interactive animation of the climate change impact on agriculture
Ok....I was too low. This from an article in a farm magazine. I will have to dig to find the experiments done. "•Cereal grains including rice, wheat, barley, oats and rye average between 25 and 64 percent higher yields under elevated CO2 levels." -
HumanityRules at 14:02 PM on 8 March 2011Blaming the Pacific Decadal Oscillation
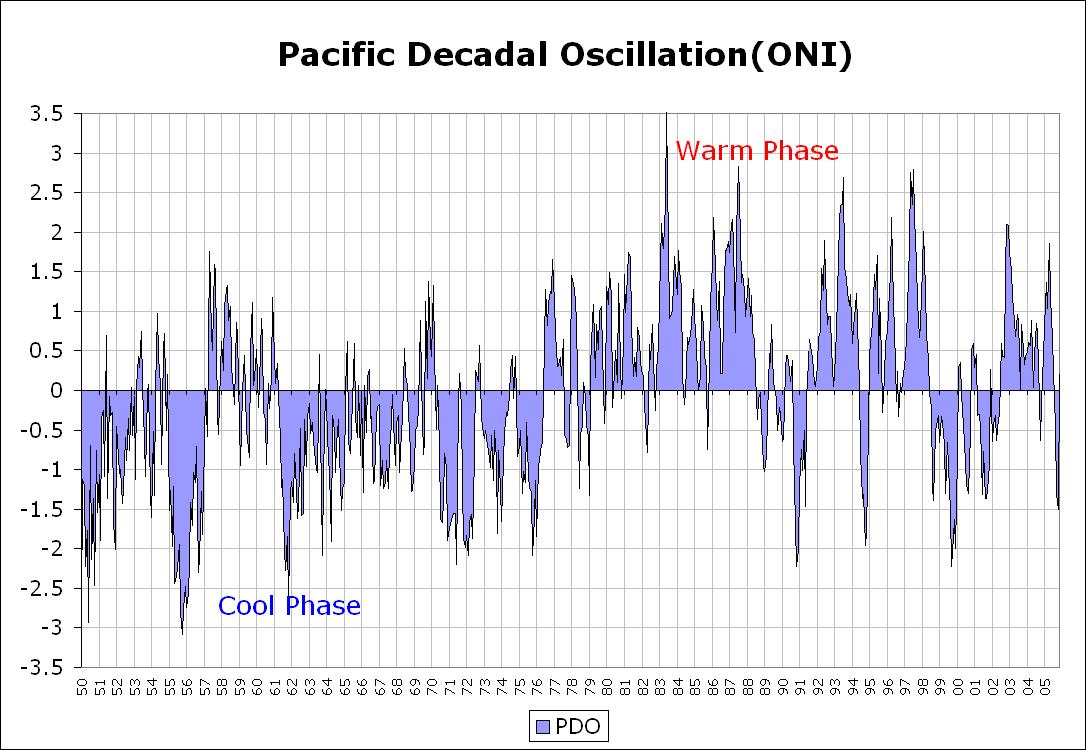
 I wonder if you could go into the relationship between PDO and ENSO a little more?
It appears that to a large extent PDO may just be a measurement of one of the impacts of ENSO in an appear outside of the 'tradional' ENSO region. Is this what you mean?
I wonder if you could go into the relationship between PDO and ENSO a little more?
It appears that to a large extent PDO may just be a measurement of one of the impacts of ENSO in an appear outside of the 'tradional' ENSO region. Is this what you mean?
-
michael sweet at 13:56 PM on 8 March 2011Interactive animation of the climate change impact on agriculture
Camburn: "If memory serves me" is not a reference. Please give a link that supports your unusual claim. Peer reviewed papers are convincing. "memory" is not. -
HumanityRules at 13:56 PM on 8 March 2011Blaming the Pacific Decadal Oscillation
Riccardo, "Thus, the PDO is a response to something else; treating it as a forcing must be taken with caution." I'm not sure the point you're trying to make with this? You think that because PDO maybe a feature or related to ENSO that this undermines it's possible role in forcing climate? I can see if we knew the whole truth about PDO that would help in understanding it's role but I don't get why we should specifically treat it with caution because it is related to ENSO? -
HumanityRules at 13:43 PM on 8 March 2011Blaming the Pacific Decadal Oscillation
"The question is, then, how to reproduce Spencer's result." Did you consider e-mailling him and asking him what he did? -
Camburn at 13:31 PM on 8 March 2011A Real-World Example of Carbon Pricing Benefits Outweighing Costs
There is an answer to building a mostly non carbon energy system. It is available, and has been tested. It is called nuclear. -
Camburn at 13:23 PM on 8 March 2011Interactive animation of the climate change impact on agriculture
muoncounter: I agree, water vapor is by far the most powerful greenhouse gas. Everything else pales against it. What research has shown is that the plants require substantially less moisture with higher co2 levels to produce the same yield. The hope is that if moisture stays somewhat constant that yields will increase by 18-22% if memory serves me.Moderator Response: [DB] Actually, CO2 is the Star Actor (the principal control knob) on the planetary thermostat stage; water vapor plays a supporting role in warming the atmosphere. If one removes the CO2 from the atmosphere, global temperatures plunge by more than 30°C in the first 10 years alone (and the resulting increase in global ice turns the planetary albedo a whiter shade of pale):
Lacis et al 2010 -
Camburn at 13:20 PM on 8 March 2011Interactive animation of the climate change impact on agriculture
But now we have drifted into agonomy rather than this application. -
muoncounter at 13:20 PM on 8 March 2011Interactive animation of the climate change impact on agriculture
adrian s, "My understanding about rising c02 levels and precipitation ... the two will largely mitigate each other" Your understanding appears to be incomplete. See the thread Water vapor is the most powerful greenhouse gas, where you will find that water vapor amplifies CO2-driven warming in a process known as 'feedback.' This is the water vapor that is the precursor to what you hope for in terms of relief from rainfall. -
Camburn at 13:19 PM on 8 March 2011Interactive animation of the climate change impact on agriculture
adrian: That is what current research shows. The higher levels of co2 result in fewer stoma which results in less transpiration. There are wild wheat grasses that have this gene that show this effect presently. Wheat and corn breeders have been trying to incorporate this gene for some years now into new hybrids. The thinking is that there should be an impressive yield response to this. -
Mike1637 at 13:17 PM on 8 March 2011The Climate Show Episode 8: Kevin Trenberth
@14. What's your point stevee? I don't think it ultimately matters if they were hacked or leaked, though hacking seems far more probable as it is known that they were downloaded from a backup server - hardly the way your average "leaker" would obtain them. In any case, none of it changes the fact that the explanation for the "hide the decline" email has not even a whiff of conspiracy about it (other than to the woefully misinformed). Nor that the "decline" is not, and never has been, a scientific secret to anyone. -
muoncounter at 13:06 PM on 8 March 2011A Real-World Example of Carbon Pricing Benefits Outweighing Costs
daisysm, "perhaps you are missing the point." That is one way to look at it. Perhaps the points made here differ in substance from the ones you are trying to make. You might consider doing some reading on warming issues. Start with the Newcomers guide then move on to Most used skeptic arguments. "what’s the thrust of the Federal response to this dire situation? …To make electricity only when the wind blows and the sun shines" Are there no renewable electric projects funded by corporate interests? Ever hear of T. Boone Pickens? "Let’s not forget that Californians are not paying the full cost for renewable energy, thanks to massive Federal subsidies." Hardly anyone in the US pays the full cost of energy. Know about massive Federal subsidies (aka tax breaks) to the oil industry? "I wondered if the threat to humanity posed by reliance on carbon fuels was real, since Government wasn’t looking for a new, full time, 24/7 energy source" I have to admit, that's a unique point of view. Because govt isn't doing something (in your view), it isn't a real problem? How about this for a reason that govt's search for replacement fuel is so slow: There is a massively funded industry lobby against that initiative! "I still insist that the “threat to humanity” is an overblown alarmist cry." Mere insistence on something doesn't qualify as evidence, scientific or otherwise. See the threads Its not bad for some examples of what 'alarmism' is trying to say. -
adrian smits at 12:30 PM on 8 March 2011Interactive animation of the climate change impact on agriculture
My understanding about rising c02 levels and precipitation is that the two will largely mitigate each other.If there is a reduction in rainfall that should be compensated for somewhat by crops that are more drought resistant because of higher c02 levels. -
RW1 at 12:20 PM on 8 March 2011Blaming the Pacific Decadal Oscillation
scaddenp (RE: 73), "Perhaps we should takes this "CO2 lags temperature" if wish to continue to argue that GHGs are unimportant for glacial/interglacial cycle." Yes, I'm arguing the evidence doesn't support that GHGs (i.e. CO2 levels) are a significant factor in the glacial/interglacial cycle. Do you wish to discuss this further over there?Moderator Response: Definitely not here.
Prev 1882 1883 1884 1885 1886 1887 1888 1889 1890 1891 1892 1893 1894 1895 1896 1897 Next


