


 Arguments


Recent Comments
Prev 1894 1895 1896 1897 1898 1899 1900 1901 1902 1903 1904 1905 1906 1907 1908 1909 Next
Comments 95051 to 95100:
-
nigelj at 19:49 PM on 2 March 2011Roy Spencer’s Great Blunder, Part 2
Im intrigued about this claim that natural causes havent been investigated. I have just waded through the summaries on sceptical.science.com of 20 odd papers on the affects of the sun, and read some of the originals, and I still have a headache from it all as my maths is rusty. Did I hallucinate all that? Isnts 20 papers enough? How many does Mr Spencer want? What planet does he live on? -
Gilles at 19:47 PM on 2 March 2011Climate Sensitivity: The Skeptic Endgame
I have some trouble with the concept of "unique" "equilibrium sensitivity" : if there were such a quantity, shouldn't the average global temperature follow very closely (within a relaxation timescale, which is supposed to be short if the current 30-years increase is supposed to be linked with an increase of radiative forcing) the global forcing ? so shouldn't we expect the temperature curve to closely follow, for instance, the milankovitch cycles? well, there is an obvious correlation with astronomical parameters, but nothing very close to them. Why ? -
Kevin C at 19:31 PM on 2 March 2011Climate Sensitivity: The Skeptic Endgame
Incovenient Skeptic: Here is a table of annual CO2 levels from 1800, with 50 year values back to 1000: Link. It also gives CH4 levels. If you need monthly values, then interpolation (with an annual profile superimposed if necessary) should give you a good estimate. I could help you in preparing such a file. However as you know if you want to attribute temperature changes over the 19th/20th century you don't just need CO2 and CH4 - you will also want to take into account the variation in insolation (and possibly aerosols). -
shoyemore at 18:56 PM on 2 March 2011Climate Sensitivity: The Skeptic Endgame
HuugyPopsBear #2, The relationship beween CO2 and global warming is not solely based on modeling. The equations connecting CO2 and IR radiation hve been well understood and dmeonstrated for many years. They form the basis for the operation of devices like CO2 lasers and air-to-air heat-seeking missiles. If the rise in CO2 in the atmosphere had NOT been accompanied by temperature rise, physicists would be questioning thir understanding of basic radiation physics. If you search the Skeptics Arguments you will find answers to your points on CO2 lagging temperature, and CO2 as a plant food. -
The Inconvenient Skeptic at 18:38 PM on 2 March 2011Climate Sensitivity: The Skeptic Endgame
Bern, If you have CO2 monthly data earlier than March of 1958 I will gladly use it, but since it was 315 ppm in March of 1958 and the previous 50 years prior to that showed little CO2 increase it is a safe to assume that the rate of CO2 increase prior to 1958 is lower than since then. As for the temperatures, if I use your same source, the period from 1908-1958 shows more warming than the years I used and clearly the CO2 was not increasing at the same rate. If you are arguing that the CO2 increase from 305 to 310 caused more warming than the jump from 310 to 360, that is a different argument though. -
RSVP at 18:31 PM on 2 March 2011Prudent Risk
Marcus #22, Dikran Marsupial #19 "the only reason viruses, bacteria & insects develop such rapid resistance is because of their extremely short life-cycles-which allows for the rapid accumulation of genetic mutations" So you are saying then that a short life span favors survival of the species. If so, animal kingdom life span is a proxy for environmental stability, and the fact that we dont live forever (and have "evolved") means the Earths environment has always been changing. I thought evolution was a good thing? Please clarify. -
Bern at 18:22 PM on 2 March 2011Climate Sensitivity: The Skeptic Endgame
Oh, and nice article, Dana - well written & clear. I think it illustrates well that the 'skeptic' position re sensitivity is a very weak one, at best. -
Bern at 18:18 PM on 2 March 2011Climate Sensitivity: The Skeptic Endgame
I'm sure others will address some of the other issues in the comments above, but I'd like to address this one: "no significant trend in global temperature from the 1958-1995" Well, TIS, this graph [woodfortrees.org] suggests there's been plenty of warming from 1958-1995. It's even more interesting when you increase the time range to 1955-2000. You get to see that 1958 was a particularly warm year, for the 1950s, and that 1995 was an average-to-cool year for the 1990s. Has there been some cherry picking going on? -
The Inconvenient Skeptic at 17:49 PM on 2 March 2011Climate Sensitivity: The Skeptic Endgame
Since CO2 levels were 310 ppm in 1950. It was only after 1960 that the CO2 levels started to significantly increase. The claim that warming prior to the increase in CO2 levels is caused by CO2 levels is incoherent. Since more than half of the warming in the past century took place before 1950 I see a flaw in your argument that CO2 has caused all the warming. There was also no significant trend in global temperature from the 1958-1995 while CO2 levels in the same period increased from 310-360ppm. The early date is used only because that is the start of reliable CO2 data. http://theinconvenientskeptic.com/wp-content/uploads/2011/03/CO2-1958-1996.png No temperature trend for almost 40 years while CO2 was climbing. There was significant warming after the 1998 El Nino and there was warming in the 1930's when CO2 was low and stable. But the period that showed the most change in CO2 did not show warming. That shows an interestingly low climate sensitivity to CO2.
Response:[dana1981] First of all, the global average surface temperature has increased 0.8°C over the past century, and almost 0.6°C since 1970. So the claim that "more than half of the warming in the past century took place before 1950" is factually incorrect. As the link above shows, the claim of "no significant trend in global temperature from the 1958-1995" is also factually incorrect.
Unfortunately these factually incorrect statements led you to an incorrect conclusion.
-
AuntSally at 17:17 PM on 2 March 2011Roy Spencer’s Great Blunder, Part 2
Responding to (3), (7), and (11)... I concur that the tone of SkepticalScience has been and continues to be exemplary -- all credit to John Cook who has created something truly valaubel here. However... I do think we need to concede something of a special case in the case of Roy Spencer and his book. Roy has -- on his blog, in numerous public talks (one of which I witnessed personally) and now in his book -- not only put forth scientific arguments, but also directly accused his colleagues of deliberate malfeasance ["I find it difficult to believe that I am the first researcher to figure out what I describe in this book. Either I am smarter than the rest of the world’s climate scientists–which seems unlikely–or there are other scientists who also have evidence that global warming could be mostly natural, but have been hiding it. That is a serious charge, I know, but it is a conclusion that is difficult for me to avoid." (p. xxvii)] I fully concur that our primary purpose here must be to improve understanding, and of course that involves taking a tone that does not immediately put off those who are resistant to the information. However, in addition to clear exposition of the science, I think it's also important to help folks understand that there are people like Roy out there exhibiting a level of obtuseness over decades. Roy's work, as I believe Dr. Bickmore and others have demonstrated, is simply not intellectually honest. If one needs to be a bit more direct in making that point, I think in this case it's warranted -- and indeed beneficial to effective communication. I think Dr. Bickmore has successfully walked a very fine line. -
gallopingcamel at 17:12 PM on 2 March 2011Visualizing a History of CO2
Loved the music. Scientifically, why not include the "Big Picture"? http://www.scotese.com/climate.htm -
HuggyPopsBear at 17:03 PM on 2 March 2011Climate Sensitivity: The Skeptic Endgame
Sorry did not finish. Or is it a fact and not a probability. I recognize pollution is a problem of mankind and something needs to be done, but CO2 is not necessarily a pollutant as it has many benefits for sustaining life and plant growth.Moderator Response: See "CO2 is not a pollutant," and comment further there, not here. -
HuggyPopsBear at 16:59 PM on 2 March 2011Climate Sensitivity: The Skeptic Endgame
Since being on this site and reading all the bits and pieces coming up, everything reads that CO2 is forcing global warming. Mostly from modeling which can only translate data put in by human effort. It cannot predict with infinite reliability future events as nothing is constant. I have always been of the belief that CO2 increase was a direct result of warming, hence why Co2 has continued to increase for a period when cooling came into operation. Once land masses were refrozen then the CO2 would drop and continue to drop even when warming again began to increase. So surely there must be another factor that is not being factored into the equation or modeling? Why can neither side come up with a definitive answer that would satisfy the masses and destroy governments greed for wanting to tax a probability.Moderator Response: Then you need to read more than "bits and pieces." Start with "Models are unreliable," "CO2 lags temperature," "There’s no correlation between CO2 and temperature," "CO2 is not the only driver of climate," and "The science isn’t settled." -
r.pauli at 16:54 PM on 2 March 2011Climate Sensitivity: The Skeptic Endgame
Thank you so much for referring to "skeptics" in quotes. They act like purposefully cultivated disinformation campaigners. But so called "skeptics" says it OK. But none-the-less, by addressing the specifics of the science issues - you do a great service. Thank you. -
Charlie A at 16:49 PM on 2 March 2011Crux of a Core, Part 1 - addressing J Storrs Hall
Rob Honeycutt -- I'm trying to understand your article. In particular, I'm trying to figure out the source of your Figure 1, with your caption of "GISP2 as presented on Watts Up With That, conflating a local record with a global record." The only source I have found for that is the link you provided, http://wattsupwiththat.files.wordpress.com/2009/12/noaa_gisp2_icecore_anim_hi-def3.gif In that link, however, the chart is clearly labeled "Data Source: GISP2 Ice Core, Central Greenland". It seems like you removed the "Central Greenland" label, and then accused Watts of conflating local and global records. Did you indeed do this? Please identify the source of your Figure 1, so your readers can judge for themselves what sort of conflation is going on. The other WUWT link you provided also very clearly talks about this being for 1 point on the earth. -
Tom Curtis at 16:24 PM on 2 March 2011Roy Spencer’s Great Blunder, Part 2
Peter Offenhartz @26, the blue plot on the graph (CO2) is just the radiance spectrum for 287 ppm CO2 - that for 584 ppm. The area under the blue curve is then change in forcing for that change in CO2 concentration. If you compare wavelengths on that diagram with the wavelengths with the diagram linked by KR, you will see that 15 microns lines up with the center of the main trough produced by CO2 in the spectrum. The two large peaks at approximately 13.5 and 16.5 microns on the diagram I posted then line up with the "wings" of the CO2 trough. Here is that KR's linked image for easy comparison. You will notice the wave lengths are marked along the top of the diagram.
-
Phila at 16:08 PM on 2 March 2011Roy Spencer’s Great Blunder, Part 2
HR: So far you have managed to skillfully avoid it. This seems uncomfortably close to an accusation of dishonesty. In some respects this is part of the problem with the plethora of recent 'skeptic bashing' articles on this website. It's more concerned with point scoring and discrediting the individuals than it is about understanding their concerns. That's an odd thing to say. Surely concerns should be based on hypotheses and data that can withstand critical scrutiny? And if they aren't, surely that says something about their validity? Some "skeptics," when confronted with errors they can't defend, resort to insinuating that their opponents are wrong in some obscure moral sense, despite being correct on the facts (e.g., they're "point scoring," which is somehow shabby and disreputable). I hope you're not trying to take that approach here. -
Peter Offenhartz at 15:16 PM on 2 March 2011Roy Spencer’s Great Blunder, Part 2
@apsmith (19) I'm afraid I have to agree with Tom Curtis (20). It is possible to assign a temperature to a specific wavelength/frequency. As for the central spike in the CO2 absorption, that simply reflects a different temperature/altitude for that particular wavelength region. One cannot assign a uniform temperature for a broad band, and the T^4 rule applies always. not just to the overall integral. But that's an awfully small point. The main point I was trying to make is that if the temperature/altitude point for the main-band CO2 upwards emission lies at an altitude that coincides with the knee of the lapse rate (as it apparently does), rising CO2 concentrations won't affect global warming. But the wings will. As for Tom Curtis (18), I will have to take a look at your references (I find the graphic you provided confusing), and I will try to find time to get back to you. But I doubt that increasing CO2 concentrations can affect the emission temperature at the center of the CO2 absorption band. But the wings (and maybe even that blip in the middle of the band) surely are important. Thanks for your help. I think I am learning! -
Charlie A at 15:07 PM on 2 March 2011Crux of a Core, Part 1 - addressing J Storrs Hall
scadenp says "Charlie A, put your serious skeptical hat on and closely read that post yourself. Spot the switch from absolute to anomaly?" OK. I followed the link in top of this Skeptical Science post over to the WUWT post Hockey Stick Observed in NOAA Ice Core Data. I see the ice core O18 isotope ratio data described as "It gives us about as close as we can come to a direct, experimental measurement of temperature at that one spot for the past 50,000 years." That sounds like a reasonable description. Hmmm. Perhaps the article here on SkepticalScience is tilting at windmills are strawmen. OK. Then there are a series of graphs for the central Greenland Ice core data. Varying lengths of record are looked at, but they are ALL in plots of estimated temperatures. The maximum length of data for that ice core is plotted. He then says "This next graph, for the longest period, we have to go to an Antarctic core (Vostok):" and shows that graph of temperatures. This one in with vertical axis being the temperature anomaly. The graph covers the entire period. Do you have some problem with using a plot of temperature anomoly when switching to another location? Why does that present a problem? Adding in a fixed offset to all of the graphs for the central greenland ice core would not, IMO, make any difference in the presentation. -
Tom Curtis at 15:03 PM on 2 March 2011Roy Spencer’s Great Blunder, Part 2
apsmith @22, great blog post, and your fourth figure illustrates very well your claim about the Planck function. As indicated, I wasn't sure you were disagreeing with anything. I was just uncertain as to why you thought it important to mention the Planck Function in this context. -
actually thoughtful at 14:45 PM on 2 March 2011Roy Spencer’s Great Blunder, Part 2
HR - I would be more inclined to agree with your criticism if Spencer didn't try to poke holes in the Milankovitch cycle theory. Given that he did, I think it is fair to critique his argument against Milankovitch cycles. I think the idea that there is a 60 year, 1,000 year, etc cycle has some problems, one of which is we are 40 years into a 60 year "cycle" - the sun is about to end its quiescence and while it is theoretically possible, it is highly doubtful that the next 20 years will show any cooling. So that blows up the 60 year cycle. The data for longer term, non-Milankovitch cycles is even weaker. I think Spencer is essentially looking for a miracle in the 5% probability that the IPCC leaves on their predictions. So in the sense that anything is possible - sure. In the sense that we have a pretty good understanding of the climate system, and at this point studies are confirming model-predicted behavior, not so much. ____________ Kevin C @ # 3 - excellent comment. Very well said and I agree. I was squirming in my chair, realizing the analysis was pretty good, but the tone is not up to SKS standards. -
michael sweet at 14:33 PM on 2 March 2011Roy Spencer’s Great Blunder, Part 2
Moderator, I agree with from Peru that Roy Spencers anti scientific ideas about Evolution and Creation cast doubt on his scientific judgement. I do not like the suggestion of ad-hominem at #6. Can you suggest what is appropriate on this site in this situation so that I know for future reference? Thank you for your help.Moderator Response: [Dikran Marsipial] The Comments policy explicitly forbids ad-hominem attacks, which are an attack on the source, rather than the content of an argument. Dr Spencers views on evolution have no bearing on whether his theories on climate are correct or not, and they should stand or fall on their own merits. Several contributors to Skeptical Science are committed Christians (and other faiths), including myself, there are plenty who would say that such views are unscientific (I would agree) and/or delusional (I don't agree there ;o). Does that mean skeptics can dismiss any of my arguments on the basis that I have religious beliefs? It is a slippery slope, and it is part of the distinctive nature of Skeptical Science that the discussion is centered on the science and logical fallacies such as the ad-hominem are discouraged, it is one of the features that makes Skeptical Science (in my view) the best of the climate discussion forums. Note that Spencer has frequently refuted other skeptic arguments, such as that CO2 is not a greenhouse gas, that the greenhouse effect contradicts the second law of thermodynamics, or demonstrating that the results of Lindzen and CHoi were substantially flawed. Are those arguments devalued by doubt on his scientific judgement? No, their value is determined by their internal consistency and support from the data and experiments. -
apsmith at 14:31 PM on 2 March 2011Roy Spencer’s Great Blunder, Part 2
Tom (@20) - I don't think we're disagreeing, I recently blogged on the subject of the temperature associated with emission to space. My only point was the Planck function for a given wavelength is not proportional to T^4, only the integral over all wavelengths is. -
scaddenp at 14:26 PM on 2 March 2011Australia's departing Chief Scientist on climate change
I hope you are wrong. I think we need to leave thermal coal in the ground and get energy elsewhere. However, making steel without coking coal is challenging. Surely the climate can cope with steel emissions provided other CO2 source are brought down? -
muoncounter at 14:24 PM on 2 March 2011CO2 lags temperature
287: Bruce, A couple of misconceptions in your comment: CO2 is not the only driver of climate. It happens to be a strong positive forcing now; that does not mean it always was. Oceans are acidifying, meaning they are absorbing CO2 from the atmosphere. At some point (or perhaps at some locations) they will warm sufficiently to release dissolved CO2. As always, the picture is more complicated than one can sum up in a sentence or two. There is a wealth of information here at SkS designed to inform and dispel some of the myths, half-truths and outright distortions that kick around the internet. Use the Search function to browse the most commonly heard 'skeptic arguments.' -
michael sweet at 14:18 PM on 2 March 2011Australia's departing Chief Scientist on climate change
In order to deal with the AGW problem the world needs to leave all the rest of the coal in the ground. When politicians realize that it is cheaper to leave the coal in the ground than to pay to rebuild after floods, like this years in Queensland, than something may be done. The developed world will have to lead before the developing world will follow. It is too bad that Australia has such a dependence on coal. They will have to find new sources of revenue. Hopefully they will not wait until AGW has destroyed their agriculture base before the change is made. If they wait that long it will be even more difficult to adjust. Right now the deniers are succeeding in delaying any action. -
muoncounter at 14:15 PM on 2 March 2011Measuring CO2 levels from the volcano at Mauna Loa
Nice non-technical summary article on the history of atmospheric CO2 measurements at climatecentral. The Mauna Loa volcano rises high above the Pacific on the Island of Hawaii. “Here, the background concentration of carbon dioxide should not be influenced by forests or soils, or an inversion or the weather,” Tans says. “All that is stripped away.” -
scaddenp at 14:15 PM on 2 March 2011CO2 lags temperature
A positive feedback does not necessarily mean runaway feedback. See run away warming -
adelady at 13:58 PM on 2 March 2011Crux of a Core, Part 1 - addressing J Storrs Hall
Thanks for that Tom. I had an unkind thought about how often certain people deign to put "Dr" before many well-known names. And "...greenhouse warming is not an unusual explanation... any change of climate needs some explanation." You're right. Far too many people of this ilk talk about global warming "theory" as if it were some discrete academic discipline. "Global warming" is just a sub-set of general climate science. Climate science shows that certain events and circumstances have predictable outcomes. The current circumstance, of releasing an unusual amount of GHGs at an unusually fast rate, is displaying fairly predictable responses. Usually called global warming. Those responses being in accordance with the general theory mean that we have a fairly high level of confidence that events in the future will unfold in accordance with the theory. More data, better technology, more experience working with the information we've already accumulated just makes it less and less likely that current evaluations of the historical record and any consequential projections for the near or distant future will turn out to be "poppycock". -
Bruce Frykman at 13:55 PM on 2 March 2011CO2 lags temperature
Since we have accepted the fact that atmospheric CO2 concentration is a primary driver of the earth's climate and also the fact the the earth has been much warmer in the past this presents a dilemma. The oceans contain about 50 times more carbon dioxide than does the atmosphere. It has been well noted that warming oceans release more of their absorbed carbon dioxide than they at the same time sink from the atmosphere. So remembering that atmospheric carbon dioxide concentrations are the primary driver of our climate any previous warming in excess of what we see in modern times should have driven a runaway warming cycle, driven by massive releases of oceanic carbon dioxide in a positive feedback loop. But somehow this didn't happen. I wonder why? -
HumanityRules at 13:30 PM on 2 March 2011Roy Spencer’s Great Blunder, Part 2
bbickmore, I think you're being a little disengenuous or atleast knit-picking here. I think you know that he thinks that multi-decadal to centennial natural variation are ignored by the IPCC. Technically your right in what you're saying, and sure you've highlighted some sloppiness in some out-of-context sentances but why use the example of millions of years cycles to criticism like this "...on time scales of thirty years or more...". I think to provide a substantive critique of Spencer you should be showing the solidity of the understanding of multi-decadal change. So far you have managed to skillfully avoid it. In some respects this is part of the problem with the plethora of recent 'skeptic bashing' articles on this website. It's more concerned with point scoring and discrediting the individuals than it is about understanding their concerns. -
Tom Curtis at 13:27 PM on 2 March 2011Crux of a Core, Part 1 - addressing J Storrs Hall
Charlie A @31, first let me second scaddenp's comment which is exactly to the point. Let me add, first, that Hall feeling slighted about not being called "Dr" is extraordinarily precious from somebody who dismisses climate scientists as "The Hockey Team" and dismisses (his straw man version of) their theories as "poppycock". More substantively, it is very noticeable that when he compares Antarctic and Greenland ice cores, he does so over the period of the Last Glacial Maximum. Unsurprisingly, there is a correlation between temperature differences between the LGM and the Holocene (the last 10 thousand years). But even during the last glacial there are clear anti-correlations between the three ice cores, even between the two Greenland ice cores on a scale of thousands of years. Therefore his failure to show a comparison of GISP2 and Vostok over the period of the Holocene with sufficient resolution is very damming. Such a comparison can be made in Figure 3 above. Vostock is shown in Dark Blue, GISP2 in light blue. If you look closely you will see that they are anti-correlated for most of the holocene. That means their average will have far fewer and smaller fluctuations then either seperately. The rapid rises and declines in the Greenland ice core during the Holocene are not global events, but the equivalently precipitous rise in late twentieth century temperatures is. Finally, he claims "The 20th-century warming was hardly unprecedented, and doesn’t call for unusual explanations." Let's leave aside that greenhouse warming is not an unusual explanation. The fact of the matter is that any change of climate needs some explanation. For global temperatures to change by up to a degree or more without explanation would violate conservation of energy. As it happens, the only substantive explanation is anthropogenic emissions of Green House Gases. (On a side note, Hall's PhD is in "computer science", which may well make him a skilled programmer, but it does not make him a scientist despite his claims.) -
Tom Curtis at 12:50 PM on 2 March 2011Roy Spencer’s Great Blunder, Part 2
apsmith @19, I'm curious as to why you bring up the Planck function. I don't doubt what you say, but it does not mean you cannot judge temperatures of gases from the relative intensity of their emission spectra at a give wavelength relative to the intensity predicted by a black body curve. Thus, in your illustration, and ignoring complexities related to emissivity, we can see the surface temperature was less than 275 K, and hence close to freezing. We can also see that the average temperature of CO2 molecules emitting to space was around 223 K at that location. That is what Peter was doing, and quite correctly. In fact, physicists often do the same thing more formally by plotting the spectrum as brightness temperature against wavelength instead of radiance against wavelength. One example (from here) is this plot, clearly from a tropical sounding:
-
Ken Lambert at 12:37 PM on 2 March 2011Australia's departing Chief Scientist on climate change
michael sweet #13 My points are simple ones. The Australian economy relies on coal and iron ore exports for a large chunk of its export income. The Federal Govt counts on this income and the taxes raised therefrom to run its budget - and so do State Govts in Qld and NSW. Our own carbon emissions are a tiny fraction of what carbon we export to China, Japan, Korea, India, Taiwan and other emitters. There is a massive contradiction in a Federal Govt imposing a carbon tax on Australians for negligible real effect on global CO2 emissions, while depending on and factoring in the income from increasing coal exports. Some would call it breathtaking hypocrisy. -
apsmith at 12:28 PM on 2 March 2011Roy Spencer’s Great Blunder, Part 2
Peter, regarding the very center of CO2 absorption, you should take a close look at a graph of the measured outgoing spectrum from Earth, for example this one posted at ScienceOfDoom here - http://scienceofdoom.com/2010/05/12/co2-an-insignificant-trace-gas-part-eight-saturation/ You'll notice that right at the center of the 15 micron dip there's a narrow spike. That higher level of emission right in the center of the absorption band is from the warmer temperatures in the stratosphere, just as you guessed. But the dependence is not the T^4 rule, that applies only to the overall integral of emission over all wavelengths. The specific law for a single wavelength is the Planck function, which is roughly linear in temperature for high temperatures, but drops very quickly to zero at low temperatures.
-
scaddenp at 12:28 PM on 2 March 2011Crux of a Core, Part 1 - addressing J Storrs Hall
Charlie A, put your serious skeptical hat on and closely read that post yourself. Spot the switch from absolute to anomaly? Perhaps read the papers instead of the quotes. As for "the only substantive point was..". Ho, ho. The zero point of 1855 isnt a substantive point? The actual temperature measurements? Does the original article still make sense when you look at the correct construction. (eg in #14 ) -
Philippe Chantreau at 12:26 PM on 2 March 2011Crux of a Core, Part 1 - addressing J Storrs Hall
"The author of the post being rebutted, J Storrs Hall, has taken exception to not being addressed as doctor and feels this is a deliberate slight upon him." Funny. I have read so many skeptic rants about appeal to authority, use of titles to suggest authority, how one does not need degrees to be qualified, what an expert is, etc. I had construed that skeptics did not care much about academic titles. Silly me. -
Tom Curtis at 12:16 PM on 2 March 2011Roy Spencer’s Great Blunder, Part 2
Peter Offenhartz @17, you may well be interested in the post on Theory and Experimant at Science of Doom. It contains (amongst other gems) this illustration of the effect of doubling CO2 on radiative forcing: As you can see, most of the effect is in the wings of the 15 micron trough, although there is a slight deepening of the trough in the center, which is the second largest effect. Some other absorption bands currently barely detectable in atmospheric spectrums also start to strengthen.
This is the non-equilibrium response. As the Earth warms to restore equilibrium, there will be an increase in radiation at all frequencies, so that in the equilbrium case, there would be more radiation from the center of the 15 micron band, not less.
Although KR has found mention of 215 K as the brightness temperature at the center of the 15 micron band, I have noticed it as being centered around 220 K, with tropical spectra above that, and polar spectra below.
As you can see, most of the effect is in the wings of the 15 micron trough, although there is a slight deepening of the trough in the center, which is the second largest effect. Some other absorption bands currently barely detectable in atmospheric spectrums also start to strengthen.
This is the non-equilibrium response. As the Earth warms to restore equilibrium, there will be an increase in radiation at all frequencies, so that in the equilbrium case, there would be more radiation from the center of the 15 micron band, not less.
Although KR has found mention of 215 K as the brightness temperature at the center of the 15 micron band, I have noticed it as being centered around 220 K, with tropical spectra above that, and polar spectra below.
-
Tom Curtis at 12:01 PM on 2 March 2011Various estimates of Greenland ice loss
Climatewatcher @15, that graph is currently being discussed on the Crux of a core thread. Essentially its problems for your use are that the most recent temperature from the ice core itself is actually 1855. The red spike at the end is supposed to show global temperature increases to the present, but they do not show global temperatures since 1855, and nor should global temperatures be compared with regional temperatures. Based on a recent analysis of Greenland temperature records, the decadal average of temperatures in Greenland has increased by approx 1.5 degrees C since the 1850's, so current tempertures on that graph should be around -30.5 degrees C, or about the peak of the MWP. 2010 temperatures are another degree warmer than that, or about equivalent to the peak of the Roman Warming. That means the current warming in Greenland is unparalleled in magnitude and abruptness in the last 6,000 years. What is more, the overall decline in Greenland temperatures evident in your graph has a well known cause, the decline in arctic summer insolation related to the Milankovitch cycles. Summer insolation is still declining. To what, then, do you attribute the sudden reversal of thousands of years of cooling? -
Peter Offenhartz at 11:57 AM on 2 March 2011Roy Spencer’s Great Blunder, Part 2
@KR (16) MANY THANKS for pointing me toward the Daniel J. Jacob reference at Harvard. His article is at once brief, comprehensive, and clear. As you note, the main CO2 effective emission temperature is about 215K, which is, I'll bet, right at the knee in the lapse rate curve, which means that rising CO2 concentrations will have little climate effect IN THE MAIN ABSORPTION PEAK. Lest anyone think I've become a global warming skeptic, the real action from changing CO2 concentrations must be taking place on the absorption wings, where the effective temperature is much higher and where rising CO2 concentrations should indeed cause a falling emission temperature. This picture clarifies my understanding considerably, but I'll have to spend more time studying Jacob's chapter. Thanks again KR. -
Charlie A at 11:35 AM on 2 March 2011Crux of a Core, Part 1 - addressing J Storrs Hall
The author of the post being rebutted has a "rebuttal to the rebuttal" posted at http://wattsupwiththat.com/2011/03/01/rebuttal-to-the-skeptical-science-crux-of-a-core/#more-35045 If you have an open mind and would like to be informed, I suggest clicking on over and taking a look. -
dorlomin at 11:08 AM on 2 March 2011Crux of a Core, Part 1 - addressing J Storrs Hall
The author of the post being rebutted, J Storrs Hall, has taken exception to not being addressed as doctor and feels this is a deliberate slight upon him. Perhaps the author would be so good as to address this as a courtisy to Dr Halls wishes? -
KR at 11:04 AM on 2 March 2011Roy Spencer’s Great Blunder, Part 2
Peter Offenhartz - From Daniel J. Jacob, Harvard, working from CO2 emission lines rather than H2O: The 15 mm blackbody temperature in Figure 7-8 is about 215 K, which we recognize as a typical tropopause temperature. It looks like the CO2 effective emission altitude is around 10km or so. -
Trueofvoice at 10:45 AM on 2 March 20112nd law of thermodynamics contradicts greenhouse theory
Damorbel is doing here exactly what he has been doing on the Wikipedia Temperature talk page. He makes repeated objections based on his flawed understanding of the subject, then accuses others who have taken the time to correct his nonsense of attempting to distort the issue. He has absolutely no interest in understanding anything you guys may say to him. He simply wants to argue. -
From Peru at 10:37 AM on 2 March 2011Roy Spencer’s Great Blunder, Part 2
Re:#6.michael sweet Thanks you for the link to the wiki article showing how deep the anti-scientific beliefs of Roy Spencer reach. Roy Spencer accuse climate scientists of a "Great Blunder" in which he blames recent warming on ocean cycles like PDO and ENSO instead of greenhouses gases. He is dead wrong because in the past, the ENSO-PDO climate connection brokes down: during the so-called Medieval Warm Period, the Tropical Pacific was in a protracted COOL state, dominated by a NEGATIVE PDO: Variations in the Pacific Decadal Oscillation over the past millennium And a LA NIÑA protracted dominance: Fossil coral snapshots of ENSO and tropical Pacific climate over the late Holocene Proving that radiative forcing (in the case of the MWP, solar + volcanic) is by far the main driver of climate, not internal oceanic oscillations like ENSO and PDO like people like Roy Spencer want us to believe. Saying all this, I can also show that Roy Spencer, not having enough with spreading nonsense about the climate science, it is an advocate of a pseudoscience far worse than climate "skepticism": intelligent design, that is just a Trojan Horse for Creationism (or as can be described better, evolution denialism). The wiki page given by michael sweet links to this "gem" written by Roy Spencer in the right-wing magazine TCS daily: Faith-Based Evolution The nonsense seen here can be quoted: "Twenty years ago, as a PhD scientist, I intensely studied the evolution versus intelligent design controversy for about two years. And finally, despite my previous acceptance of evolutionary theory as "fact," I came to the realization that intelligent design, as a theory of origins, is no more religious, and no less scientific, than evolutionism." "While similarities between different but "related" species have been attributed by evolutionism to common ancestry, intelligent design explains the similarities based upon common design. An Audi and a Ford each have four wheels, a transmission, an engine, a gas tank, fuel injection systems ... but no one would claim that they both naturally evolved from a common ancestor." Can we trust a "scientist" that wrote such a piece of disinformation? This is not a matter of religious beliefs. The problem here is that he believes that "intelligent design" is a valid scientific theory and should be teached alongside mainstream evolution. This is just crazy. Strange that many climate "skeptics" are also evolution "skeptics". I suspect an ideological, right-wing common root on both positions.Moderator Response: [DB] Fixed link. -
actually thoughtful at 10:14 AM on 2 March 2011Various estimates of Greenland ice loss
Climatewatcher- what does it mean that the temperatures go up as you go down the right axis. Is the negative sign to be believed? Or does your data show that the medieval warming period was over 1C higher than now? To what do you attribute that sharp spike in red on the right side of your graph? -
Peter Offenhartz at 09:43 AM on 2 March 2011Roy Spencer’s Great Blunder, Part 2
@hank(12) Thanks. I'll have a look at your reference when I have some time. @KR (13) I know the mean height for outgoing LW radiation is 4-5 km (that's where the H2O concentration gets very low, due to cooling), but I'm interested in the height for the CO2 band, since CO2 concentration relative to O2 and N2 doesn't change with altitude. I'll keep trying. Thanks. -
dana1981 at 09:14 AM on 2 March 2011How We Know Recent Global Warming Is Not Natural
Jesus - if climate sensitivity is 2°C (0.54 Wm-2K-1), it means the equilibrium warming from the CO2 forcing thus far is: 0.54*5.35*ln(390/280) = 0.96°C. Now certainly it's possible to come up with some convoluted argument that less than 0.4°C surface warming thus far has come from the CO2 radiative forcing that will result in 0.96°C surface warming at equilibrium. You could argue that ocean thermal inertia is huge (but "skeptics" argue that it's small). You could argue that there is a large aerosol forcing offsetting the CO2 warming, and a large unaccounted for 'natural' forcing causing more warming than CO2 (but again, "skeptics" usually argue that the aerosol forcing is small). But realistically, if sensitivity is no less than 2°C, you can't come up with a plausible argument that CO2 isn't responsible for most of the warming we've seen this century. I've got another article on a very similar subject that will be published later this week, called "Climate Sensitivity: The Skeptic Endgame". -
RickG at 08:43 AM on 2 March 20112nd law of thermodynamics contradicts greenhouse theory
@449, Agreed, especially with your last comment. -
ClimateWatcher at 08:39 AM on 2 March 2011Various estimates of Greenland ice loss
Not particularly remarkable when one considers Greenland temperatures through out the Holocene: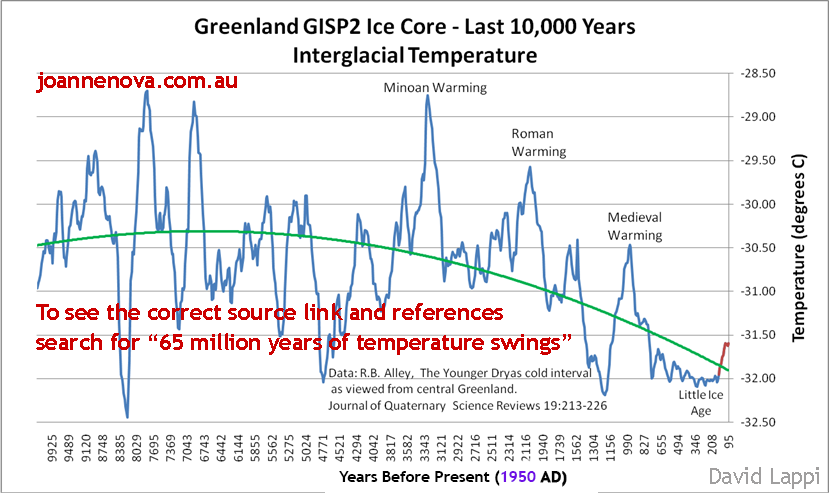
Prev 1894 1895 1896 1897 1898 1899 1900 1901 1902 1903 1904 1905 1906 1907 1908 1909 Next


