


 Arguments


Recent Comments
Prev 1950 1951 1952 1953 1954 1955 1956 1957 1958 1959 1960 1961 1962 1963 1964 1965 Next
Comments 97851 to 97900:
-
HumanityRules at 22:12 PM on 5 February 2011A Case Study of a Climate Scientist Skeptic
#6 KR "I keep seeing skeptics yelling about the "in the pipeline" heating, as if the energy discussed were somehow already here, hiding under a bush or something" I thought it was Trenberth who first started yelling about the energy hiding under a bush. If by bush you mean the abyss or arctic ocean. If Trenberth has to look under bushes to find the energy to make his calculations work then where is this fraction accounted for in Dana's calculation?Moderator Response: [Daniel Bailey] See here for context, provided by Trenberth himself, on the quote so many use out of context from the stolen emails. -
MarkR at 21:33 PM on 5 February 2011A Case Study of a Climate Scientist Skeptic
#43 Agnostic: "Why? Do feedbacks already contribute to global warming? Will that contribution increase significantly as a result of on-going global warming?" It's quite complicated. Many models (AOGMs etc) don't include a proper carbon cycle but you determine expected CO2 levels from a carbon cycle model based on expected emissions and then prescribe them in the model. New models (so called ESMs) often include a carbon cycle model. But they often don't capture features which we suspect are there but haven't managed to constrain. Most don't capture how the Amazon became a net CO2 source in '05 and '10 or tell us with good confidence if and when other stores or sinks might 'fail'. That's why we can't be sure that models are doing a good job here. And measurements of carbon cycle feedbacks now are unlikely to be representative of carbon cycle feedbacks in a world with 1200 ppm CO2 and 5 C higher temperatures. So that's why recent measurements don't capture them. -
Riccardo at 20:28 PM on 5 February 2011A Case Study of a Climate Scientist Skeptic
The heating we are experiencing now is definitely due to what happened in the past. This is the same reason why the radiative imbalance we're experiencing now will affect temperature for many decades. Just to put a number, if the response time is 50 years, what we see now is due to what happened in the last 50 years and the radiative imbalance we see still now will affect temperature for another 50 years. Reality is much more complex than my trivial example. The oceans respond on several different time scales and it's impossibile to reduce them to a single accurate response time. -
Ken Lambert at 20:08 PM on 5 February 2011A Case Study of a Climate Scientist Skeptic
KR #47 Quote "You appear to be claiming that "in the pipeline" energies are not evident, and hence GW is false". endquote. I did not claim that at all. I said in #45 that "The energy absorbed from future forcing imbalance will cause 'future' temperature rise as KR#6 correctly says." I think that the lack of understanding of the 'terms' is in your court if you can't follow plain language. My piece does not deny GW up until now - nor that the current purported imbalance of anywhere from 0.4 up 0.9W/sq.m will not cause future warming if it continues. I criticised dana1981's original piece because he made errors which finally suggested that 1.1W/sq.m of warming was lurking somewhere 'in the pipeline' IN ADDITION to the 0.4- 0.6W/sq.m already claimed to be measured in the oceans. Clearly incorrect. -
jyyh at 18:38 PM on 5 February 2011A Case Study of a Climate Scientist Skeptic
My prediction is this article will be quotemined by some. I'm not going to comment this more. -
A Case Study of a Climate Scientist Skeptic
johnd - "Unrealized heating" is my term; one of a number I proposed as a replacement for the easily mis-interpreted "In the pipeline" phrase. It's the heating required to cancel out the radiative imbalance currently seen. Nothing more, nothing less. The timeframe is primarly determined by the thermal inertia of the oceans with regard to the (rather small by comparison) radiative imbalance. No hand waving whatsoever. -
A Case Study of a Climate Scientist Skeptic
johnd - The question (are current variations due only to recent heat content changes) is reasonable. The assertion (that there are >100 year OHC changes) is unreasonable given a lack of evidence. If you have an alternate explanation, please provide it. If you have no evidence of such an alternative, why are are you asserting it's possibility? -
johnd at 17:35 PM on 5 February 2011A Case Study of a Climate Scientist Skeptic
dana1981 at 17:07 PM on 5 February, 2011, precisely, and it was the hand waving about some indeterminate "unrealised heating" "in the pipeline", two unknowns, that I was seeking to be clarified by an explanation of the mechanism involved which should include a timeframe, both looking forward, and looking back to the origins of what is supposedly yet to be expressed. -
2010: A Year of Record Warmth and Weird Weather
johnd - My apologies; I was going from a "Recent Comments" listing showing a graph of Southern Australia rainfall. That's not appearing now; I suspect an error on my part. Mea culpa. -
johnd at 17:21 PM on 5 February 2011A Case Study of a Climate Scientist Skeptic
KR at 17:09 PM on 5 February, 2011, it can't be considered both a fair question and a strawman argument. It is indeed a fair question to seek clarification as to that if "unrealised heating" has been identified as presently being "in the pipeline", what evidence is there that it hasn't always been "in the pipeline" After all, I am responding to your earlier statement "I have spent a fair bit of time point out that "in the pipeline" means unrealized heating that will occur given current circumstances, but hasn't yet." -
A Case Study of a Climate Scientist Skeptic
OK, in the absence of vertical circulation ocean warming (based on thermal conductivity) would have a time constant of 230 years. But we know there's vertical circulation, there's already benthic heating, it's on the order of 75-100 years from what we've seen. Again, johnd, please don't make assertions without evidence. It's the equivalent of "crying wolf", and does not dispose anyone towards taking subsequent statements seriously. -
johnd at 17:10 PM on 5 February 20112010: A Year of Record Warmth and Weird Weather
KR at 16:55 PM on 5 February, 2011, KR, if you go back through the thread, you will find that your questions are not relevant in the context of the matters being discussed. -
A Case Study of a Climate Scientist Skeptic
johnd - A fair question. Do you have evidence, a physical model, or other indications of a >100 year thermal inertia? After all, we do understand where global warming is going, and the cycle time is <100 years as far as anyone can tell. After all - "Assertions without evidence can be dismissed without evidence" (Christopher Hitchens) Please don't post such strawman arguments. -
dana1981 at 17:07 PM on 5 February 2011A Case Study of a Climate Scientist Skeptic
johnd #48 - warming requires a mechanism. And thermal inertia acts on timeframes of decades, not centuries. Waiving your hands around and saying "maybe global warming is just the result of a centuries-long lag due to some unknown cause" is not scientific. -
johnd at 16:57 PM on 5 February 2011A Case Study of a Climate Scientist Skeptic
KR at 16:11 PM on 5 February, 2011, regarding "in the pipeline" energies, what evidence is there that any of the warming experienced in the most recent past, say 100 years, is itself not unrealised heating from a time even further back. Given that the heat content of the ocean is yet to be adequately quantified, and that of past centuries is even less sure, how can we know that the unrealised heating anticipated looking forward, is not already constantly being expressed from some time back? -
2010: A Year of Record Warmth and Weird Weather
johnd - Two questions for you. How does the area of South Australia compare to the surface are of the globe? What are the global figures on precipitation? Given that we've had ~4% increase in specific humidity since 1970? -
johnd at 16:32 PM on 5 February 20112010: A Year of Record Warmth and Weird Weather
Tom Curtis at 10:01 AM on 31 January, 2011, Tom, the precision of definition you require may be appropriate in the world of laboratory experiments and formulas, but when applied to the real world and weather in general, then terms such as below average are well understood, as well as self evident, as is the term "similar period". Real world weather by nature is not commanded by clocks or calenders, or even precise formulations and statistics, even though some observers seem to imagine it is. Perhaps the map below courtesy of BOM will illustrate how the terms "below average" and "similar periods" express themselves in real world observations, be it over short terms in decadal time frames, or over the longer period of a century if you draw a line through at 383.32mm which is the average rainfall for the period displayed. Moderator Response: [Daniel Bailey] Fixed URL link.
 -
A Case Study of a Climate Scientist Skeptic
Ken Lambert - Nooooo, I don't agree. You appear to be claiming that "in the pipeline" energies are not evident, and hence GW is false. I have spent a fair bit of time point out that "in the pipeline" means unrealized heating that will occur given current circumstances, but hasn't yet. Your statements to the contrary seem to indicate that you don't understand the terms. I do not agree with you in any fashion regarding your post here, and disavow your claims thereof. If I agree with someone, I'll say so. I have not said that I agree with you. -
scaddenp at 15:04 PM on 5 February 2011It's Pacific Decadal Oscillation
Worth noting too, that everything we know about climate says that UAH will plummet this year (La Nina) and it will go down further than land record. However if you want to know about climate rather than weather then please compare UAH now with UAH in past periods which have La Nina index of the same magnitude. If it comes to that, compare the minimum temperature of the coming La Nina cycle with the MAXIMUM of El Nino temperature 30 or 40 years ago. Want to guess what UAH will show in the next El Nino of 1.8 or more? -
adelady at 14:54 PM on 5 February 2011A Case Study of a Climate Scientist Skeptic
protestant " there are two good guesses what causes DO's. It is either internal oscillation, where 'the earth is trying always to reach its equilibrium' ..... " Perhaps this is part of the problem. The earth doesn't, and it can't, try to do anything. The earth is just a planet. That is, it's just a biggish rock with certain features which allow biological as well as simply physical processes to influence conditions at its surface. And that is why it is entirely appropriate to discuss those various features individually. Radiative transfer equations, ocean chemistry, photosynthesis, the physics of glaciers, fossils are all part of the various processes. In this case, the interaction of several processes feed into certain calculations is the process in question. And that is what the discussion is about. It is not like throwing everything into a food processor to mix a cake. It's like carefully assembling a 20,000 piece jigsaw. When you're helping someone assemble the tree in the middle of the picture, it is *not* helpful to offer a piece from the edge. That piece should be offered to the person (thread) looking at that part of the picture. -
Ken Lambert at 12:24 PM on 5 February 2011A Case Study of a Climate Scientist Skeptic
ChrisG #13 What you (and others) might be confusing is energy conservation (first law) with temperature equilibrium. If heat energy (the warming imbalance of 0.9W/sq.m) is added to a vast mass of water from the top and sides (we are not suggesting that the 0.9W/sq.m enters from the ocean bottom yet are we?), then the thermal inertia of water means that it will take a long time for the temperature of the whole mass to reach equilibrium (if ever). There will be warmer water at the top and sides. The DeltaT x specific heat of sea water x mass subject to that DeltaT will equate to the heat energy absorbed (less that absorbed in ice melt or evaporation). Dana1981 #15: "Ken Lambert #4 - sorry, you are incorrect. See KR #6. Also I suggest you read the Lindzen E&E paper I linked in the article. He explicitly states that there is warming in the pipeline from the ocean thermal inertia. He just neglects it because he feels it's too small to make much difference in the calculation, but unlike yourself, doesn't deny that it exists" You are confusing warming temperature in the system somewhere, with external energy imbalance already absorbed. Once the ocean has absorbed heat imbalance energy up to time NOW, then complex circulations move it around - change temperatures and exchange it with the atmosphere via ENSO, AO etc. The energy is still conserved - temperature is an artifact of where that energy is showing up spacially in the system. The energy aborbed from future forcing imbalance will cause 'future' temperature rise as KR#6 correctly says. KR#6 agrees with what I have said in #4 - it is NOT incorrect. We must get this terminology right. 'Energy' is what is added or subtracted via 'external imbalance' or redistributed by internal oscillation. Broadly, 'Temperature' of water, land or air is a measure of the energy already absorbed spacially in the system. -
Steve L at 11:47 AM on 5 February 2011Monckton Myth #8: Rising sea levels
KR @47 -- thanks. Somehow I imagined it would be more than that. -
Ken Lambert at 11:40 AM on 5 February 2011A Case Study of a Climate Scientist Skeptic
KR#6 In other words you agree with what I have said in #4. -
Riduna at 10:21 AM on 5 February 2011A Case Study of a Climate Scientist Skeptic
MarkR @ 2 …. most estimates of climate sensitivity do not include carbon cycle feedbacks. Why? Do feedbacks already contribute to global warming? Will that contribution increase significantly as a result of on-going global warming? -
protestant at 09:58 AM on 5 February 2011A Case Study of a Climate Scientist Skeptic
"Since this article is about the warming from 1750 to Present, arguing that some small fraction of the warming since the 1970s could be due to natural oscillations is not relevant here. Nobody claimed otherwise." Not just a small tiny weeny fraction but a huge part, more than half. [quote]I'm also going to ignore the unsubstantiated and absurdly wrong statement that there's no correlation between CO2 and temperature. "[/quote] I never said CO2 and temperature do not correlate. Yes they do. I said CO2 doesnt correlate with the AMO index. It was maybe 5th or 6th time in this short discussion where my arguments are completely misread. So I suppose there is no reason trying to reason with you. Goodbye. -
protestant at 09:53 AM on 5 February 2011A Case Study of a Climate Scientist Skeptic
#39: Physics of radiative balance? Which physics do you mean? You mean those physics, which require a _LINEAR_ regression fit with a 2% R^2 to determine feedbacks (Dessler), right? I'd rather call those assumptions. Nature is highly nonlinear and complex. Have you _read_ the paper I linked you on my first post? Of course it is possible to build any kinda houses of cards to explain the recent observations, but the models which have these what you call 'physics' still cant replicate a) the 40's b) the MWP and LIA (dont give me a hockey stick with Mannian smoothing please). AMO (and other, even centennial cycles , who knows?) is a tricky devil for the climate modelers, for sure. Those estimates ALSO require, that the 'accelerated' (similar to 1910-1940) warming from 1970-2010 is man made. Some of it is, but most of it isnt. The effective trend is still the same as in the first part of the 19th century if the natural variables, which can be almost definitely be attributed as natural, are removed.Moderator Response: [muoncounter] You are continuing to go further and further off-topic. Find the appropriate thread(s) or your scattershot-style comments will start disappearing. Replies, please ref these comments in the appropriate thread. -
dana1981 at 09:48 AM on 5 February 2011A Case Study of a Climate Scientist Skeptic
In addition to the rather bizarre question as to why we haven't seen more warming when the article showed that we have seen as much warming as expected, I also refer you to Monckton Myth #3: Linear Warming, which also discusses how much future warming we expect to see and when. Since this article is about the warming from 1750 to Present, arguing that some small fraction of the warming since the 1970s could be due to natural oscillations is not relevant here. Nobody claimed otherwise. I'm also going to ignore the unsubstantiated and absurdly wrong statement that there's no correlation between CO2 and temperature. We're starting to get into a Gish Gallop situation here. Please restrict comments here to issues that are discussed in this article. -
A Case Study of a Climate Scientist Skeptic
protestant - "But still, 0.72K/century and we have been forecasted 4-8x more. When will the accelerated warming start?" I sincerely have to ask - have you read the article at the top of this thread? We're right along predicted temperature rises given our emissions track, thermal inertial of the oceans, and the physics of radiative balance. Your question is not even a strawman - it's nonsensical. -
protestant at 09:31 AM on 5 February 2011A Case Study of a Climate Scientist Skeptic
#37. I never said those could explain the detrended part. But they certainly explain some part of the 1970's -today at least. But still, 0.72K/century and we have been forecasted 4-8x more. When will the accelerated warming start? Any bets? -
protestant at 09:25 AM on 5 February 2011A Case Study of a Climate Scientist Skeptic
#34. I said: they dont contribute on MAX-to-MAX intervals. Which in this case is around 1940-2000's. From 1900-to2010 there is a min-max interval which means they contribute some, and at least half from 1970-today. And you dont have the necessary OHC data to make any longer comparisons than to 2003 which is a ridiculously short of a period. Even the XBT's (which are worth another discussion) dont cover a full. We havent even begun to understand how the OHC behaves during these (short and long term) oscillations. Even if what you propose (external forcing at work) about AMO is true, it would mean at least its not human forcing, since there is no correlation there can also be no causation. Human forcing makes a "hockey stick" while AMO makes not. Thus the explanation would be cloud changes, which would be the nail in the coffin for CAGW. Actually, according to a very recent study by Spielhagen et al, the N Atlantic temps they present follow the solar curve presented by Solanki et al so external forcing is definitely one plausible explanation. #35. I've read it and a load of other carbage he has written. I've even tried commenting but he just keep snipping all of the arguments and only leaving the "frustrated parts" of the messages, or even completely deleting the posts. Other skeptics and non-skeptics have had a similar fate when disagreeing with him. But: If the nonlinear GW signal is removed from the AMO with an alternative analysis (by substracting global SST without NA, from NA), the result is the same. There is no GW signal leaked in it. Tamino also doesnt give any references at all, that why the current scientific view of AMO would be wrong. I hope you both #34 and #35 take your time to look at the references (Otterå about AMO and Rial about nonlinearity, at least). -
Tom Curtis at 09:15 AM on 5 February 2011A Case Study of a Climate Scientist Skeptic
Protestant @33, I cannot help but notice that in your graphic you detrend the HadCRUT3 temperature index by 0.72 degrees K per century. If you remove that trend in order to get a correlation with your combined AMO/PDO index, then that index and the associated oscillations cannot explain the trend. It's that simple. And of course, 0.72 degrees K per century is well within the range of predicted temperatures (given uncertainties)calculated above. In other words, your argument here is a complete non-starter. Even if we allow that Tamino and others grave objections to treating the AMO and PDO as being genuine oscillators independent of various forcings are wrong, and it is not clear that we should. relative position in the AMO/PDO cycles explains at most 0.08 degrees of the trend in the short term, and because they are oscilators, none of the trend over longer periods. -
neilrieck at 09:13 AM on 5 February 2011Monckton Myths - a one-stop-shop for Monckton misinformation
How does Monckton make his money? Is it only through speaking engagements? (remember the Watergate movie titled "All The Presidents Men"? Deep Throat said "follow the money") -
muoncounter at 09:12 AM on 5 February 2011CO2 is not increasing
Reply to comment here. "is it about 40% absorbed, 5.23*(0.4) ~ 2.0?" Actually, the most recent increase is back up to 2.3 ppm/year, a sure sign that the recession is ending. And the ~40% absorption is an average; it will vary by several points from year to year. Take the world's annual CO2 emissions in Gtons, convert to ppm by volume and divide. You can't make this increase -- and the inescapable fact that we are its source -- go away by a few back-of-the-envelope calculations. -
muoncounter at 08:53 AM on 5 February 2011It's not us
#25: "The difficulty of applying atmospheric CO2 levels to the export from upper to deep ocean reservoirs ... presumably someone must have overcome this." See Physical Chemistry of CO2 Absorption for a very detailed analysis. #30: "Where we disagree is in the relative importance of the various components of anthropogenic CO2. They are unquantified ... ." This seems to be on the verge of becoming a strawman. Is what you are really questioning the reality of anthropogenic contribution to increasing atmospheric CO2? Or are you searching for a means to quantify its magnitude? In either case, data exist to resolve the questions to a reasonable degree of certainty. We can track local atmospheric CO2 concentrations against seasonal fuel use patterns (several authors have done this at various locations in Europe); we can see weekly and diurnal traffic patterns in urban environments (multiple papers on urban 'CO2 domes') and a prior thread noted that land sources of CO2 can be tracked via CO and black carbon deposits. #37: "Sum effect is meaningless in this arfgument ... ." Perhaps you should spend some time looking through EIA CO2 emissions data before making that claim. But on the whole, I must agree with KR; the sum is greater than any individual part. -
It's not us
Julian Flood - It's also well worth looking at IPCC AR4 for a collected discussion of the isotopic data. -
Albatross at 08:45 AM on 5 February 2011A Case Study of a Climate Scientist Skeptic
Protestant @33, Please read this thread which discusses the following graphic by Tamino.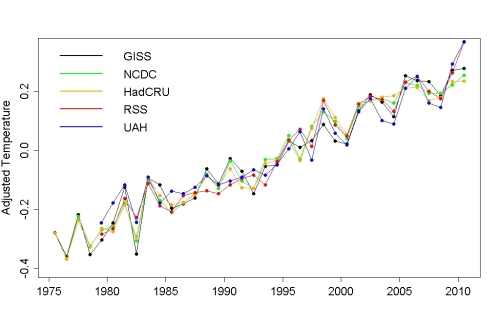 The above figure shows the underlying warming for different temperature datasets (including satellite) after "remov[ing] the estimated impact of el Nino, volcanic eruptions, solar variation, and the residual annual cycle."
And the AMO has huge issues because as it turns out, it is defined in such a way that "Variations in the forced signal do leak into the AMO definition. Correlations with the AMO index do alias effects of global warming." (Tamino), and from the same post "Of course there are better ways to do this, but it still illustrates the point: that when you look at AMO correctly, the possibility that it’s much of the cause of global warming vanishes."
These oscillations can only temporarily amplify or dampen the long-tern underlying warming trend from increased radiative forcing as GHG levels increase. They would not be referred to as oscillations if they were not transient.
That said, they are not ignored by climate scientists and have been the subject of many papers by climate scientists. Some days, like today, I wish that I could yell that fact from the roof-top...
Please read AR4 Chapter 9.4.
The above figure shows the underlying warming for different temperature datasets (including satellite) after "remov[ing] the estimated impact of el Nino, volcanic eruptions, solar variation, and the residual annual cycle."
And the AMO has huge issues because as it turns out, it is defined in such a way that "Variations in the forced signal do leak into the AMO definition. Correlations with the AMO index do alias effects of global warming." (Tamino), and from the same post "Of course there are better ways to do this, but it still illustrates the point: that when you look at AMO correctly, the possibility that it’s much of the cause of global warming vanishes."
These oscillations can only temporarily amplify or dampen the long-tern underlying warming trend from increased radiative forcing as GHG levels increase. They would not be referred to as oscillations if they were not transient.
That said, they are not ignored by climate scientists and have been the subject of many papers by climate scientists. Some days, like today, I wish that I could yell that fact from the roof-top...
Please read AR4 Chapter 9.4.
-
It's not us
Julian Flood - The earlier link I provided to How do human CO2 emissions compare to natural CO2 emissions has that information, specifically references to Ghosh 2002. That's an excellent reference with a good discussion of the isotopic balances of various sources and sinks. As to the mass balance point - we actually know the size of our contribution: 29GT/year to the list of sources. We see 15GT/year increases in the atmosphere, indicating that 14GT/year of our contribution to the CO2 balance are absorbed by natural sinks. How can our contribution possibly be clearer than that?!? How can it not be us causing the increase? If the CO2 increase was larger than our emissions, then there would be plenty room for discussion as to which part of that CO2 rise was due to us. But it's not - it's much less than our emissions. We cause all of the rise in CO2. -
dana1981 at 08:36 AM on 5 February 2011A Case Study of a Climate Scientist Skeptic
protestant #33 - it's pretty straightforward. If PDO/AMO/etc. were responsible for the long-term surface air warming trend, then there would be a long-term ocean cooling trend. The opposite is true - both air and oceans are warming, which means there must be an external forcing at work. You're effectively trying to argue that correlation equals causation. And your correlation argument is extremely sketchy. To paraphrase - "PDO and AMO correlate with global temperature as long as you remove the long-term trend". I agree - PDO and AMO cause small short-term surface temperature changes. But they don't cause the long-term trend, and I hope you're not trying to argue otherwise by comparing them to detrended data. -
Julian Flood at 08:24 AM on 5 February 2011It's not us
Re KR quote Isotope changes correlate with fossil fuel consumption. unquote At last, some facts that mean something. Where's the reference please? I've been looking for a paper which calculates that the isotope changes are caused by, and only caused by, fossil fuel emissions. Your other assertions.... could you work through the logic for me? I can see no way from the mass balance argument that you can assert anything other than very weak arguments: our emissions have contributed some increase to atmospheric CO2; if we stopped burning fossil fuel there would be some decrease in atmospheric CO2; fossil fuel burning is one contributor of unspecified size to our climate problem. Sum effect is meaningless in this arfgument because without attribution you do not know relative quantities. That's why the isotope measurements and attribution matter. Incidentally, your first post simply restates the mass balance argument which you may have noticed does not contribute anything other than the 'some of the CO2 from fossil fuel burning remains in the atmosphere.' As, of course, does some of the CO2 from all the sources. JF JF -
It's not us
Julian Flood - I think you're being rather disingenuous here. Our well known emissions represent twice the well measured atmospheric increase. Isotope changes correlate with fossil fuel consumption. It is entirely, completely irrelevant what the various sources other than fossil fuel emissions are - our emissions are making the difference in changing CO2 levels, up 115ppm since the beginning of the industrial era. CO2 levels are rising, and without our emissions they would currently be falling. The isotope evidence is no more than a supporting (albeit very interesting) character in this play. Arguing (as you continue to) about attribution, rather than sum effect, is just a pointless distraction. -
protestant at 08:03 AM on 5 February 2011A Case Study of a Climate Scientist Skeptic
#26: So what? What causes em? How do you explain nonlinear behaviour of the climate (for example see reference: http://www.biology.duke.edu/upe302/pdf%20files/jfr_nonlinear.pdf). The climate oscillates. It has always done that. And whenever you draw a line from max to max the influence will be near zero, but any other interval they contribute. Just because they "dont have a long term trend" doesnt mean they couldnt cause shorter term (<~65 years) fluctuations. Or then you also should also need to explain what causes ENSO and that why that CAN make some years colder and some warmer. Unless you have an explanation for the DO's which is also consistent with the current GHG-theory then I guess you just dont have it. I have been looking for this evidence but havent found it. We dont even have the needed OHC numbers to really see how the OHC behaves during these oscillations: None of the datasets cover a large enough period of time, and XBT compared to ARGO is mostly useless. What you also dont have an explanation for the 1940 blip, and what causes for example North Atlantic to switch to cool and warm modes. Do you know how AMO index can be calculated (hint: by removing the GW signal either by detrending or substracting the global SST anomalies, both give virtually the same result)? Here is a comparison with 'eyeballed' AMO+PDO and detrended (-0.72K/century) HadCRUT3 anomalies: Multiple regression fit gives similar results.
You also should take a peek on this Norwegian climate scientis who is an ocean modeler:
http://www.bccr.no/acdc/filer/242.i3yGAl.pdf
In short: there are two good guesses what causes DO's. It is either internal oscillation, where the earth is trying always to reach its equilirium (actually multiple equiliriums which makes it even more complex). The second good guess is cloud changes (internal or externally forced).
Btw, why is it always here people are trying to splice the discussion into multiple threads? Because everything relates to everything, or are you just trying to dodge the fact that some of us skeptics' also have a lot of coherence in our thoughts? The straw-man of #25 sums it all, first splice up the discussion and then create strawmen like that. It's a killing of a proper discussion of the climate.
This is what bothers me a lot in this site. I have been a regular reader for 2 years now. But what becomes more and more clear, is that the regular posters arent really familiar with the uncertainities and unknowns of the current climate science. "What science says" is just a meaningless oxymoron, just the way YOU see it, but only a little to do with the truth.
(and yes, the most foil-hatted 'skeptic' arguments are properly refuted but who needs that? It is the proper questions which needs answers, and this site does NOT answer to them properly, comprehensively nor properly.)
Response: [muoncounter] You're going wildly off-topic with this scattergun approach. As requested above, please use the appropriate threads for subject-specific discussion - and refer to the Comments Policy.
Multiple regression fit gives similar results.
You also should take a peek on this Norwegian climate scientis who is an ocean modeler:
http://www.bccr.no/acdc/filer/242.i3yGAl.pdf
In short: there are two good guesses what causes DO's. It is either internal oscillation, where the earth is trying always to reach its equilirium (actually multiple equiliriums which makes it even more complex). The second good guess is cloud changes (internal or externally forced).
Btw, why is it always here people are trying to splice the discussion into multiple threads? Because everything relates to everything, or are you just trying to dodge the fact that some of us skeptics' also have a lot of coherence in our thoughts? The straw-man of #25 sums it all, first splice up the discussion and then create strawmen like that. It's a killing of a proper discussion of the climate.
This is what bothers me a lot in this site. I have been a regular reader for 2 years now. But what becomes more and more clear, is that the regular posters arent really familiar with the uncertainities and unknowns of the current climate science. "What science says" is just a meaningless oxymoron, just the way YOU see it, but only a little to do with the truth.
(and yes, the most foil-hatted 'skeptic' arguments are properly refuted but who needs that? It is the proper questions which needs answers, and this site does NOT answer to them properly, comprehensively nor properly.)
Response: [muoncounter] You're going wildly off-topic with this scattergun approach. As requested above, please use the appropriate threads for subject-specific discussion - and refer to the Comments Policy. -
Julian Flood at 07:58 AM on 5 February 2011It's not us
quote If enough calthrate deposits were released that the natural environment became a net source of CO2 into the atmosphere, the annual rise would be greater than anthropogenic emissions. But we know this is not the case. unquote No, you can't assume that. All you can say is that the sources are greater than the sinks by .45 of the fossil fuel emissions: this says nothing about the amounts released by the various sources because you have not quantified the sinks. Which is why the mass balance argument gets you no further than the fact that anthropogenic CO2 is a contributor to atmospheric CO2 rise. The proportion due to fossil fuels is unquantified. The sinks are unquantified. Many of the sources are unquantified. You do not have enough data to say anything other than 'fossil fuel CO2 contributes to atmospheric CO2 rise, proportion unquantified.' quote I've not done the calculations myself, but if they didn't match there would be a paper demonstrating that they didn't match, and I'm pretty sure we would have heard about it. unquote Nice try! Argument from absence is a new one on me. "Raupach et al." Thanks. JF -
It's Pacific Decadal Oscillation
thepoodlebites - I saw that item about the UAH January temperature. It hasn't shown such a monthly low since, lets see, 2009, much of 2008, 2006, 2005, or 2001. All part of the warmest decade on record. Are you trying to make a climate related point from a single month's data? You haven't indicated in your post as to why you consider that datum important. It has been said time and again, by lots and lots of people - you cannot make a climate estimate (~30 year trend) from short term (in this case, one month) data. There's too much short term variation to consider trend extraction from the short data set; you're talking about roughly 1/360th the data needed. -
thepoodlebites at 07:34 AM on 5 February 2011It's Pacific Decadal Oscillation
This just in, Jan. 2011 UAH, -0.01 C. -
Marco at 07:18 AM on 5 February 2011A Case Study of a Climate Scientist Skeptic
Alexandre #25: it's not mine, though! Please do not attribute it to me, and I'm afraid I do not know the author either.Moderator Response: [Daniel Bailey] AFAIK, it's paternity is here. -
villabolo at 07:13 AM on 5 February 2011A Case Study of a Climate Scientist Skeptic
KR: I would propose describing it as "expected warming", rather than "in the pipeline". Perhaps "delayed warming" would be a better term. The word "expected" gives the subtle impression in the layman's mind that perhaps it may not happen since not all things held in expectation happen. -
Dikran Marsupial at 06:20 AM on 5 February 2011It's not us
Julian, if you want a peer reviewed paper with the mass balance argument, try Raupach et al., it is on section 2.1 on the first column of page 2. -
actually thoughtful at 06:02 AM on 5 February 2011Follow-Up Case Study in Skepticism
The poodlebites @58, (continued in 62). I didn't realize you were replying to me. You seem to be continuing the misguided notion that the null hypothesis in climate science is something like this: "If we dump 26.7 billion tons of CO2 into the atmosphere annually, natural variability will cover our tracks." What a bizarre way to think about the climate! In what legitimate school of scientific method do you take the control knob for what you are testing (temperature sensitivity to greenhouse gases) and twist it as hard as you can and call THAT your null hypothesis?! No, the null hypothesis for climate and climate is this: Climate variability explains climate in the absence of climate forcings. If you could get the word to Dr. Spencer about this basic aspect of posing scientific questions I am sure the level of debate will be greatly elevated. It is a shame to see so much effort spent on pretending this isn't an issue (and there are many legitimate scientific areas for learning, not the least of which is solving Trenberth's tragedy.) (That you respond by attacking the number/weight/amount of CO2 (which, sure is probably NOT 26.7 billion. Let's say there is a 10% error bar on either side) speaks volumes about the quality of your argument) -
dana1981 at 05:33 AM on 5 February 2011A Case Study of a Climate Scientist Skeptic
Badgersouth #28 - I added this:The amount of unrealized warming is dependent upon the amount of CO2 in the atmosphere (or other radiative forcing causing the energy imbalance) and the thermal inertia of the oceans (which causes a lag before the warming is realized).
-
Daniel Bailey at 05:30 AM on 5 February 2011Monckton Myths - a one-stop-shop for Monckton misinformation
I think that this bit by Moth Incarnate kinda sums up TVMOB: The Yooper
Prev 1950 1951 1952 1953 1954 1955 1956 1957 1958 1959 1960 1961 1962 1963 1964 1965 Next


