


 Arguments


Recent Comments
Prev 1960 1961 1962 1963 1964 1965 1966 1967 1968 1969 1970 1971 1972 1973 1974 1975 Next
Comments 98351 to 98400:
-
jyyh at 14:27 PM on 28 January 20112010: A Year of Record Warmth and Weird Weather
Great graph the last one. Have you done further analysis on that? F.e. checked regular legnth periods to see whether the amount of record temps vs. low temps have been increasing? I planned to do that once for monthly data but I guess there should be some correction for the differing legnhts of prior data that I couldn't figure out, plus it's a process that could be programmed to be automatic and I do not do analyses like that, all too easy to get something wrong. -
Tom Curtis at 14:17 PM on 28 January 2011Monckton Myth #8: Rising sea levels
Anthony @42 and KR @44, letting readers know that Morner has dabbled in dowsing seems to me more of a notice on Morner's well that he has poisoned it himself rather than actually poisoning the well. I would not ever cite as a scientific authority a young earth creationist, a dabbler in astrology, or a dabbler in dowsing. IMO that they are irrational in one area shows that their "rationality" in the area of their expertise is accidental - that they are not making mistakes (if indeed they are not) simply because they were taught which mistakes to avoid rather than because they are capable of correcting their misakes through rational analysis. I know that in the past, some giants of science have dabbled in pursuits now seen as irrational dead ends. Newton's interest in alchemy is the most famous example. The difference is that while Newton could draw on, there is no area of science that has now not been extensively elaborated. Belief in alchemy for Newton was based on inadequate information to demonstrate the error - belief in dowsing today is the deliberate choice of irrationality. Finally, Lord Monckton introduced Morner's claims by specifying that he was a professor with experience studying sea levels. He did not show the basis for those views, he merely apealed to authority. When an opponent argues by simple appeal to authority (and incosistently in that he is denying the more substantial authority of a large number of other experts in the field), it is certainly OK to impeach that authority. As Monckton's argument was no more than that this is a good well to drink from, pointing out that the owner of the well has poisoned it is no falacy. -
RW1 at 13:51 PM on 28 January 2011It's albedo
KR, "A 3.7 W/m^2 imbalance at the TOA results in about 1C of surface warming (5.9 or so W/m^2 higher IR at the surface, although backradiation also increases with atmospheric warming, so that's not a direct imbalance). And then feedbacks occur, changing levels of water vapor, long term albedo from ice melt, CO2 balance with the ocean, etc., each of which induce additional TOA imbalances and subsequent warming. Once feedbacks kick in their TOA imbalances are in addition to the original 3.7 W/m^2 forcing from doubling CO2." Why don't the same feedbacks occur (excluding the surface albedo) on the 239 W/m^2 from the Sun? -
RW1 at 13:48 PM on 28 January 2011It's albedo
scaddenp, "RW1 - the increase in "gain" (which certainly does include feedback) is 406/239 from model results. Again it seems you are trying to predict feedback (the increase in "gain"). Its a bogus procedure to say that "gain" * increase in CO2 will be the increase backradiation. You have to calculate it properly." The 406 W/m^2 you quote isn't from any measurement but from model predictions from numerous assumptions that only exist in a computer. The 3.7 W/m^2 from 2xCO2 is from empirical measurement, so is the gain of about 1.6, which represents the amplification at the surface for each 1 W/m^2 of energy from the Sun. If 3.7 W/m^2 of additional infrared from 2xCO2 is amplified to 16+ W/m^2 at the surface, why isn't the 239 W/m^2 from the Sun amplified by proportionally the same amount to over 1000 W/m^2? -
HumanityRules at 13:09 PM on 28 January 20112010: A Year of Record Warmth and Weird Weather
"We also saw the fourth largest swing in the Southern Oscillation during a single year, beginning with a moderate-to-strong El Niño but ending with a moderate-to-strong La Niña." Isn't it possible that this fact could account for some of the phenomenon you describe here? For example the Queensland floods and the fact that the mid 2010 months broke records. There is some evidence that increased temperature leads to increased water vapour but there is conflicting evidence as to whether this is translating into increased precipitation (try the recorded presentation here.) I'm not denying that 2010 is at the end of a long term warming trend so there is an obvious reason why the impressive final figure looks the way it does but there seems to be an awful lot of speculation (and unfortunately opportunism) in connecting many of last years natural disasters to AGW. I also just wanted to raise something about the effect of El Nino and La Nina on the 2010 global temp. It worried me with NASA GISS interpretation of this earlier last year and I've got the same problem with the way it's presented here. Here's what you say "We also saw the fourth largest swing in the Southern Oscillation during a single year, beginning with a moderate-to-strong El Niño but ending with a moderate-to-strong La Niña. The latter tends to mean cooler global temperatures, yet the Earth remained hot as late as November." Just like NASA GISS you speculate about what should be the impact of La Nina towards the end of the year while not expanding on the real impact of ElNino in the first 2/3's of the year. What should have been the impact of the La Nina in 2010? I'm going to speculate almost nothing. The lag between Nino3.4 and global temp is generally described as 3 months but this is not set in stone. Below you can see the lag after the 1998/1999 El Nino/La Nina transition is fairly large (~6 month's) whereas there appears to be little lag in the 2008 La Nina (this is closer to the 3 months). What do we see with the 2009/2010 transition? It looks a lot like the 1998/1999 transition. That's 5-6 month's. The La Nina didn't kick in until June/July 2010 so it wouldn't be surprising if this didn't impact on global temp until December 2010. And that is probably what we are seeing. Meanwhile it's obvious to see the short term effect of the 2009/2010 El Nino in the 2010 record in the form of the final blue peak on the graph. Why not dwell on this fact a while in your article? It seems like an important feature of the 2010 record. It would help to explain the record breaking temps in the mid month's. (Larger version here. NINO3.4 and CRUTEM3+HadSST2)
As I said earlier all this doesn't take away the fact that 2010 is at the end of a long term warming trend and nothing of the basic facts you present are incorrect. This is an error of omission, that has an impact on the implications and attribution of the phenomena you describe.
I'm left with a few issues. How do we attribute the extreme precipitation events when over the passed few decades when there may have been no trend in global precipitation despite the water vapour trend. 2010 is here presented as wierd, the CO2 atmospheric concentration isn't that weird compared with the past two decades. Trying to pin all this on CO2 in the atmospere seems like a stretch. I know John's favorite analogy in this regard is that AGW is training the weather to punch harder. To extend the analogy I just want to know what is the evidence the training has been effective?
(Larger version here. NINO3.4 and CRUTEM3+HadSST2)
As I said earlier all this doesn't take away the fact that 2010 is at the end of a long term warming trend and nothing of the basic facts you present are incorrect. This is an error of omission, that has an impact on the implications and attribution of the phenomena you describe.
I'm left with a few issues. How do we attribute the extreme precipitation events when over the passed few decades when there may have been no trend in global precipitation despite the water vapour trend. 2010 is here presented as wierd, the CO2 atmospheric concentration isn't that weird compared with the past two decades. Trying to pin all this on CO2 in the atmospere seems like a stretch. I know John's favorite analogy in this regard is that AGW is training the weather to punch harder. To extend the analogy I just want to know what is the evidence the training has been effective?
-
archiesteel at 12:46 PM on 28 January 2011Ten temperature records in a single graphic
@Pirate: "How dare you accuse anyone of "misteaching or misleading" just because they don't agree with you?" Well, if they disagree with the current state of Climate Science without any evidence to support their position while in a science class, I think it's safe to say they have in fact been mistaught. Of course, it is also entirely possible they agree with you because you are an authority figure to them, and you apparently do not accept AGW theory. Like someone already remarked, they are likely to be telling you what you want to hear. In any case, anecdotal evidence offered online is worthless. We have no way of knowing you're telling the truth, after all. I suggest you stick to science and not try to bring such appeals to popularity. Anyway, I think if we were to poll young people on AGW theory we'd find they are more likely to accept it than the general population. -
Albatross at 12:31 PM on 28 January 2011A Flanner in the Works for Snow and Ice
Gordon @38, "May I just suggest the terms "pro-science" and "anti-science"? Seconded :) -
scaddenp at 12:23 PM on 28 January 2011It's albedo
Of course, the importance of water vapour is common (misunderstand) skeptic argument. See Water vapour for more detail. -
scaddenp at 12:19 PM on 28 January 2011It's albedo
As for sudden increase in gain... Gain for 0ppm of CO2 = 1 (no amplification) " 360ppm " = 1.63 (1997 value of CO2) " 580ppm " = 1.69 (doubling of CO2) using your definition of "gain" as surface OLR/(solar-albedo) and my calculation of Trenberth using values for models with sensitivity of 3 from above. -
Gordon1368 at 12:14 PM on 28 January 2011A Flanner in the Works for Snow and Ice
@28: Jim, I am quite grown up, thank you. That was a bit of fun. We see the terms "warmist," "alarmist," and "pro-AGW" (as if anyone is rooting for an overheated planet) a lot here, and maybe I took your terminology the wrong way. No personal offense intended. May I just suggest the terms "pro-science" and "anti-science"? It is difficult to find any serious scientist, scientific institution or scientific research that casts doubt on the theory of AGW after all. -
scaddenp at 12:12 PM on 28 January 2011It's albedo
RW1 - the increase in "gain" (which certainly does include feedback) is 406/239 from model results. Again it seems you are trying to predict feedback (the increase in "gain"). Its a bogus procedure to say that "gain" * increase in CO2 will be the increase backradiation. You have to calculate it properly. -
Colin Bridge at 11:25 AM on 28 January 2011CO2 effect is saturated
Thank you Daniel Bailey, it certainly helps my understanding. If no more warming was available with increased CO2, it is hard to see how Snowball Earth could have ended where my reading is that a trigger was reached sending earth into a transient super-greenhouse. -
villabolo at 11:17 AM on 28 January 20112010: A Year of Record Warmth and Weird Weather
"...eastern Russia, and southern Asia; and cooler than average temperatures in central Russia..." Shouldn't that be eastern Siberia and west Siberia? -
villabolo at 10:00 AM on 28 January 20112010: A Year of Record Warmth and Weird Weather
There are natural precedents for the blocking and negative AO patterns (e.g. the 70's). It could be that the effects of the pattern could be exacerbated by sea ice loss, but we are in new territory and it will take time to see if the pattern holds and if the effects are worse." Do you realize the irony of saying that we are in new territory? -
Monckton Myth #8: Rising sea levels
Steve L - I understand that the added 4% is roughly the volume of Lake Erie, or 484 km^3. Surface area of the oceans (skipping rivers and lakes) is ~3.61x10^8 km^2. Quick math (hope I have this right) 484/(3.61x10^8) = 1.34x10^-6 km thickness or 1.34 millimeters drop in the oceans since 1970. That's less than half a single year's 3 mm rise. -
It's cooling
Chris - Lubos Motl does indeed have extensive string theory experience (I won't claim to be an expert in that; I have no real opinion about how good he is). He was at Harvard until a couple of years ago - he left that institution in mid-semester for some reason. He is also a frequent commenter on climate change - his blog apparently seems to alternate between physics and climate change posts. Keep in mind that expertise in one field does not automatically grant expertise in another! I frequently have to deal with PhD's or MD's who make that mistake. I would suggest trying a quick Google search on his name, and read the top 10 or so results. He tends to provoke strong opinions from everyone - he's a less than polite commenter. -
Steve L at 09:03 AM on 28 January 2011Monckton Myth #8: Rising sea levels
Here's a probably unimportant question, but potentially interesting: How much water has/will evaporate (to become stored in the atmosphere) relative to the amount of sea level increase? Or, with a different focus, how much higher would sea level be if water vapour hadn't increased since 1970? -
citizenschallenge at 08:54 AM on 28 January 2011Monckton Myth #8: Rising sea levels
This graph makes a good juxtoposition for Monckton's claim: "Past, current and future sea level rise" "What’s there to worry about sea level rise; it’s going very slowly, right? Let’s put current sea level rise in a historical perspective." From: Bart Verheggen’s weblog of climate change issues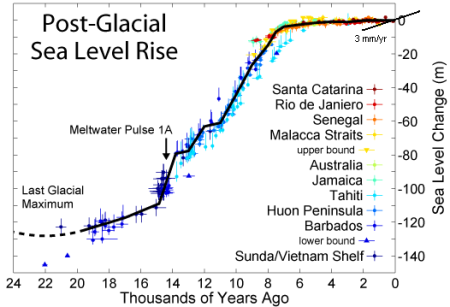
-
It's albedo
RW1 - The "gain" isn't the correct way to treat the issue, since the relative value is an output of the models, not a simplification you can use for input purposes. A 3.7 W/m^2 imbalance at the TOA results in about 1C of surface warming (5.9 or so W/m^2 higher IR at the surface, although backradiation also increases with atmospheric warming, so that's not a direct imbalance). And then feedbacks occur, changing levels of water vapor, long term albedo from ice melt, CO2 balance with the ocean, etc., each of which induce additional TOA imbalances and subsequent warming. Once feedbacks kick in their TOA imbalances are in addition to the original 3.7 W/m^2 forcing from doubling CO2. As I recall, we had a ~450 post discussion, primarily on these issues with you and George White (who apparently originated this "gain" idea) - I don't believe a single person on the thread agreed with you two, for a lot of very good reasons. You might want to take that into consideration... -
Chris3699 at 08:48 AM on 28 January 2011It's cooling
Someone asked me to name one of the scientists that my skeptic friend was citing to support his position and this morning he named a guy called Lubos Motl. Apparently Motl is a “Theoretical physicist, a graduate of Charles University in Prague, Rutgers University and has been a Harvard Junior Fellow and assistant professor. He’s worked on such common problems as the pp-wave limit of AdS/CFT correspondence, twistor theory and its application to gauge theory with supersymmetry, black hole thermodynamics and the conjectured relevance of quasinormal modes for loop quantum gravity, deconstruction, and other topics.” This is his latest comment on his blog where he seems rather upbeat about the UN and US moving away from tackling climate change: -
Monckton Myth #8: Rising sea levels
Rob Painting - Regarding Mörner, I would have to agree with other posters that bringing up the dowsing smacks of poisoning the well, a form of argumentum ad hominem, and as such is inappropriate. Mörner makes enough errors in his climate-related science to be a poor source, but I think it would be more valid to leave his other (even the rather curious ones) interests out of the discussion. -
RW1 at 08:36 AM on 28 January 2011It's albedo
A rise of about 1 C or 5.9 W/m^2 results in a new gain of only about 1.66 from 1.63 (396/239 = 1.66), which is a negligible increase. More importantly, it is still much less than the over 4x needed to get 16+ W/m^2 for a 3 C rise. More importantly If the effects of the 'feedbacks'(including specifically water vapor) are not embodied in the gain, then explain why it doesn't take over 975 W/m^2 at the surface to offset the 239 W/m^2 coming in from the Sun? Then also explain why the response of 'feedbacks' on next 3.7 W/m^2 at the surface will all of the sudden be nearly 3 times greater than the response of 'feedbacks' acting on the original 98+%? -
citizenschallenge at 08:00 AM on 28 January 2011Monckton Myth #8: Rising sea levels
I’m embarrassed to bring this up but I was disappointed in the last section of the initial post. The explanation seemed to side step the given quote: "SEA LEVEL ACCELERATION - HISTORY REPEATS?" Monckton - "In the 11,400 years since the end of the last Ice Age, sea level has risen at an average of 4 feet/century, though it is now rising much more slowly because very nearly all of the land-based ice that is at low enough latitudes and altitudes to melt has long since gone." Sea levels have been rising 4feet/century... what? Even the implication that there has been steady significant rise occurring these past few thousand years seems questionable from my limited knowledge. ~ ~ ~ ~ ~ ~ ~ Quoting: http://www.giss.nasa.gov/research/briefs/gornitz_09/ . . . A fourth interval of rapid sea level rise 8200-7600 years ago was first identified by a hiatus in coral growth in the Caribbean about 7600 years ago {...} This spurt... apparently resulted from the catastrophic drainage of glacial Lakes Agassiz and Ojibway around 8400 yrs ago, releasing a volume of about 105 cubic kilometers within a few years or even less. But it only produced about 1 meter of global sea level rise, assuming an even spread of this volume spread across the world's oceans. Yet even this minor increase in sea level left an imprint in the stratigraphic record. By the mid-Holocene period, 6000-5000 years ago, glacial melting had essentially ceased, while ongoing adjustments of Earth's lithosphere due to removal of the ice sheets gradually decreased over time. {...} Over the past few thousand years, the rate of sea level rise remained fairly low, probably not exceeding a few tenths of a millimeter per year.{...} Since 1993, an even higher sea level trend of about 2.8 mm/yr has been measured from the TOPEX/POSEIDON satellite altimeter. Analysis of longer tide-gauge records (1870-2004) also suggests a possible late 20th century acceleration in global sea level. -
Anthony G. Warming at 07:57 AM on 28 January 2011Monckton Myth #8: Rising sea levels
Thanks, BillyJoe, 21! "Poisoning the well" certainly seems to be the term to use, when Mörner is first presented as having "extensively dabbled in dowsing". This sets the scene, sort of, so that we will know that nothing he says is worth listening to, (quote from Wiki): "A poisoned-well "argument" has the following form: 1. Unfavorable information (be it true or false, relevant or irrelevant) about person A (the target) is presented by another. (e.g., "Before you listen to my opponent, may I remind you that he has been in jail.") 2. Any claims person A then makes will be regarded as false, or taken less seriously." My point is that this is only done to a person you disagree with, and whom you want to discredit, as in the top post. You would not spread any such irrelevant information concerning those you trust. -
Albatross at 07:50 AM on 28 January 2011Rescue Climate Data
Neat project, thanks for bringing this to our attention. I was vaguely aware of the ships' log project, but had no idea about the upper-air data. Something to do on a quiet day... -
RW1 at 07:41 AM on 28 January 2011It's albedo
"To see why idea of fixed gain doesnt work" I don't claim the gain is fixed. I know it isn't. -
Eric (skeptic) at 07:28 AM on 28 January 20112010: A Year of Record Warmth and Weird Weather
#6 RickG, good point, I should not have implied there was dishonesty in other circumstances. Thanks for the link, I see the speculation is clearly labeled in that article. -
citizenschallenge at 07:25 AM on 28 January 2011Monckton Myth #8: Rising sea levels
@37 "We know the cure, it's the apathetic nature of politicians and the political process to implement change that is throwing a monkey wrench into the mix." Let us not forget who owns those 'apathetic' politicians and that the real impediment to facing humanities AGW situation is a well organized, strategic corporate funded propaganda attack campaign based not on understanding new things science has to offer, but on demolishing anything threatening their business as usual. -
cynicus at 07:25 AM on 28 January 2011Monckton Myth #8: Rising sea levels
@29 Tom Curtis, I'm watching Charlie Veron's presentation again and he really says the corals went extinct during the Permian event (skip to slide 22): Every coral on this planet went extinct. No coral alive today lived during the Permian or lived through that extinction event. He then continues: And so we have a new group of corals evolving out of Actinia and that's the start of modern corals. And they are fairly different from their predecessors. Actinia are sponges, btw. So, trusting the expert on his word, during only this Permian event (not so for the other events) every coral literaly went extinct. -
scaddenp at 07:20 AM on 28 January 2011It's albedo
RW1 - let me expand here a bit. To see why idea of fixed gain doesnt work, consider what happens if there is no CO2. If it gets cold enough from loss of DLR and increasing albedo, then all water vapour is condensed out of atmosphere and there is no GHG effect. There is then no "gain". Likewise increasing the GHG increases your "gain". It seems to be that you are trying to use some heuristics and the Trenberth diagram to predict what the Trenberth diagram would look like with 2xCO2 from pre-industrial. You have to use the models to do this. Assuming models are correct then the changes would be like this: No change to TOA inputs. The 3.7W/m2 for increased is CO2 is "effective" not a real change to TOA flux. You could get change in cloud and surface albedo from model results but for simplicity assume increases in one are cancelled by decrease in other. Evaporation etc also change but are minor players. Surface OLR changes to from 390 to 406 and DLR increases from 324 to 340. Your "gain" as you have defined it, increases from 1.63 to 1.69. What is your "gain" when you put two blankets on your bed at night instead of one? -
Rob Painting at 06:04 AM on 28 January 20112010: A Year of Record Warmth and Weird Weather
John Brookes - Hopefully with the La Nina this year will be milder. Well, that depends here you live. Here, Downunder, La Nina means warm conditions and lots of rain and cyclones. -
Rob Painting at 06:01 AM on 28 January 20112010: A Year of Record Warmth and Weird Weather
Albatross @ 5 - And let us not forget the north island of New Zealand, which could be in the path of post tropical cyclone Yup, looks like we're going to take a direct hit!.
-
Ron Crouch at 05:53 AM on 28 January 2011Monckton Myth #7: Snowjob
I'm putting this here because it relates to snowfall. Just to show some contrast between the way the media reports scientific findings. In the Telegraph the headline reads "Himalayan glaciers not melting because of climate change, report finds, but yet in other media where there is a greater sense of responsibility to report the news accurately the headline would read like this one from IRIN, CLIMATE CHANGE: Not all Himalayan glaciers are melting. What is striking is the way the Telegraph (which supports the skeptic view) cherry-pick the data that suits their purpose and ignore reporting the rest. So a word to the wise, choose your sources of information carefully. -
Ron Crouch at 05:07 AM on 28 January 2011Monckton Myth #8: Rising sea levels
#25 Phil263 Yes there is more on that here on the ESA site. -
Albatross at 05:05 AM on 28 January 2011Ten temperature records in a single graphic
Arkadiusz @75, Not so fast. From NOAA, "In summary, the mid-Holocene, roughly 6,000 years ago, was generally warmer than today, but only in summer and only in the northern hemisphere. More over, we clearly know the cause of this natural warming, and know without doubt that this proven "astronomical" climate forcing mechanism cannot be responsible for the warming over the last 100 years." Also, look at this (and that 2004 data point can be moved from +0.48 K to +0.63 K for 2010): [Source: here]
Regarding the Arctic:
Miller et al. (2010, QSR):
"Solar energy reached a summer maximum (9% higher than at present) 223c.gif ¨11 ka ago and has been decreasing since then, primarily in response to the precession of the equinoxes. The extra energy elevated early Holocene summer temperatures throughout the Arctic 1–3 °C above 20th century averages, enough to completely melt many small glaciers throughout the Arctic, although the Greenland Ice Sheet was only slightly smaller than at present."
Jakobsson et al. (2010, QSR):
"The combined sea ice data suggest that the seasonal Arctic sea ice cover was strongly reduced during most of the early Holocene and there appear to have been periods of ice free summers in the central Arctic Ocean."
Also from Polyak et al. (2010, QSR):
"The current reduction in Arctic ice cover started in the late 19th century, consistent with the rapidly warming climate, and became very pronounced over the last three decades. This ice loss appears to be unmatched over at least the last few thousand years and unexplainable by any of the known natural variabilities."
So in the early Holocene, when temperatures were likely 1-3 K above 20th Century values, the Arctic may have been ice free during the summer. Now consider that The Arctic has already warmed by 1-2 K relative to temperatures in the early to mid 20th century, and recently has been warming at almost three times the global rate (about 0.5 K per decade since 1979). These data suggest that the Arctic is already very close to temperatures experienced there in the early Holocene, and will very likely exceed them around circa 2040. That is also when we will likely see the Arctic briefly ice free in the summer, although it is not impossible that the Arctic could be largely ice free before then.
By 2100 warming of annual temperatures by +5 K predicted by the IPCC for the Arctic (range 3-8 K). Our current emissions path (SRES A2) suggests a warming of almost +6 K with respect to early 20th century temperatures, way above anything seen over the Arctic during the Holocene.
[Source: here]
Regarding the Arctic:
Miller et al. (2010, QSR):
"Solar energy reached a summer maximum (9% higher than at present) 223c.gif ¨11 ka ago and has been decreasing since then, primarily in response to the precession of the equinoxes. The extra energy elevated early Holocene summer temperatures throughout the Arctic 1–3 °C above 20th century averages, enough to completely melt many small glaciers throughout the Arctic, although the Greenland Ice Sheet was only slightly smaller than at present."
Jakobsson et al. (2010, QSR):
"The combined sea ice data suggest that the seasonal Arctic sea ice cover was strongly reduced during most of the early Holocene and there appear to have been periods of ice free summers in the central Arctic Ocean."
Also from Polyak et al. (2010, QSR):
"The current reduction in Arctic ice cover started in the late 19th century, consistent with the rapidly warming climate, and became very pronounced over the last three decades. This ice loss appears to be unmatched over at least the last few thousand years and unexplainable by any of the known natural variabilities."
So in the early Holocene, when temperatures were likely 1-3 K above 20th Century values, the Arctic may have been ice free during the summer. Now consider that The Arctic has already warmed by 1-2 K relative to temperatures in the early to mid 20th century, and recently has been warming at almost three times the global rate (about 0.5 K per decade since 1979). These data suggest that the Arctic is already very close to temperatures experienced there in the early Holocene, and will very likely exceed them around circa 2040. That is also when we will likely see the Arctic briefly ice free in the summer, although it is not impossible that the Arctic could be largely ice free before then.
By 2100 warming of annual temperatures by +5 K predicted by the IPCC for the Arctic (range 3-8 K). Our current emissions path (SRES A2) suggests a warming of almost +6 K with respect to early 20th century temperatures, way above anything seen over the Arctic during the Holocene.
-
Riccardo at 05:02 AM on 28 January 2011A Flanner in the Works for Snow and Ice calculations
Ken Lambert the response time τ in a simple zero-dimensional model is given by τ=C/λ whre C is the heat capacity and λ-1 is the climate sensitivity. Howver, this model is a bit crude. Indeed, there are several response times relative to the various parts of the climate system. As a grossly aproximated single "effective" response time you can take something like 40-50 years. To have the time dependence of forcings and feedbacks you need to run a climate model, better if many runs of many models; something I have never seen either. -
michael sweet at 04:00 AM on 28 January 2011Ten temperature records in a single graphic
I teach AP CHemistry in an American High School. The students will often respond to a teacher with what they think the teacher wants to hear. The students would know Pirate feels strongly that AGW is not correct so they will not argue with him in class. If their regular teaher was present they would likely support AGW. The split of students is generally the same as the general public. If all of them are against AGW you must have influenced them by your questioning. In order to find out what the students really feel you have to get to know them for a long time. Even then some will say what they think you want to hear. -
Tom Curtis at 03:58 AM on 28 January 2011Monckton Myth #8: Rising sea levels
mr duget @33, according to the IPCC Assesment Report 4, between 1993 and 2003 thermal expansion caused Mean Seal Level to rise by 1.6 mm per year, melting of glaciers and ice caps caused it to rise 0.77 mm/yr, and melting of the Greenland and Antarctic ice sheets caused it to rise by 0.21 mm/yr each, for a total combined sea level rise due to the warming climate of 2.8 mm/yr of the 3.1 mm/yr observed. There is a small contribution to sea level rise from the drying lakes (such as the Aral Sea, and Lake Chad), depletion of ground water, which is partially compensated by the filling of artificial lakes. This may contribute to the 0.3 mm difference between prediction and observation; but that 0.3 mm is well within the margin of error, and so may not be significant. Durring that same period, net natural climate forcings were constant, or slightly declining. 1993 is sufficiently after any significant increase in natural forcings that we can ignore any lag effects. Therefore, 28 mm of the 31 mm rise in Mean Sea Level in that period is due to climate changes as a result of human activities, which is within margin of error of 100%. Prior to 1993 natural causes may have contributed some of the rise, and prior to 1950, it certainly contributed some of the rise. But is that really relevant given that our concern is about the future? -
mspelto at 02:56 AM on 28 January 20112010: A Year of Record Warmth and Weird Weather
Another weird aspect was the record snowmelt in the Northern Hemisphere. We went from nearly the most extensive snowcover in February to the least extensive snowcover in May. -
RickG at 02:47 AM on 28 January 20112010: A Year of Record Warmth and Weird Weather
(1) Eric (skeptic): Thanks for being honest about that. That's a common trait of the vast majority of "actual" climate scientists, which conversely is quite questionable for the vast majority of climate changeskepticsdeniers. At least the ones I've encountered. Also note that the statement you quoted concerning speculation is also linked to a NASA news release which is here. The speculation is not without merit. -
Ron Crouch at 02:46 AM on 28 January 2011Monckton Myth #8: Rising sea levels
Tom & Rob I agree that the speed at which change is taking place may be one defining factor in the survival of corals, and as we have discussed both temperature and pH also play important roles. It would appear though that some corals have the ability to produce a natural sunblock in the form of fluorescent pigments, and it is likely that these coral species stand a much better chance of survival than non-fluorescent species. We know the cure, it's the apathetic nature of politicians and the political process to implement change that is throwing a monkey wrench into the mix. -
Albatross at 02:43 AM on 28 January 20112010: A Year of Record Warmth and Weird Weather
I too like that last Figure. And note too how well the model projections are tracking. Wild weather indeed, it certainly seems that we are shifting the probability distribution functions (and tails) for temperature and precipitation into new territory. It is shifts in the tails of the distributions that are going to hurt. I wonder whether or not the general public are finally getting the message that the planet is very likely experiencing more extreme weather events? The media in the USA is slowly picking up on all this weather weirdness. Just to make maters worse for Queensland, after a brief reprieve, ECMWF is indicating that a tropical storm could make landfall near 20 S (coastline near Townsville) on Sunday evening into Monday, with a much stronger tropical cyclone projected to make landfall in the the same region next Thursday. This one-two punch could be devastating, especially given the saturated soils and full dams. Also on Sunday, Perth could be affected by the much weakened remnants of tropical cyclone Bianca currently located near the northwestern tip of Oz. And let us not forget the north island of New Zealand, which could be in the path of post tropical cyclone (i.e., undergoing extra-tropical transition) Wilma late on Friday night into Saturday. Fingers crossed that ECMWF is wrong.... -
JMurphy at 01:53 AM on 28 January 2011Ten temperature records in a single graphic
HuggyPopsBear, as well as the other suggestions given, why don't you look at this RealClimate page for further information. -
MarkR at 01:49 AM on 28 January 2011A Flanner in the Works for Snow and Ice calculations
ΔF is not your imbalance, ΔQ is. ΔF is radiative forcing; heat flow that doesn't react to the climate state on the timescales we're considering. Changes in CO2, volcanism and solar activity are examples. YΔT is the feedback sum that responds to the state of the climate. We have estimates of sensitivity (and therefore net Y in the past) from palaeoclimate. We have direct measurements of Y from the past few decades and climate models implicitly calculate it So far climate models have generally been in agreement, or underestimated observational values. -
Arkadiusz Semczyszak at 01:31 AM on 28 January 2011Ten temperature records in a single graphic
@Daniel Bailey “Looking at all the data we have, we are now at a temperature point equivalent to that in the Holocene Optimum ...” There are no regional data (not combining "apples with oranges"), indicating that current temperatures are in any way for the Holocene a record. Quite the opposite. Also in the Arctic. (Marsz 2009, page 62 - figure - ryc.1.) “Of 140 sites across the western Arctic, there is clear evidence for warmer-than-present conditions at 120 sites. At 16 sites where quantitative estimates have been obtained, local HTM temperatures were on average 1.6±0.8 °C higher than present.” “Along the Arctic Coastal Plain in Alaska, there are indications of summer temperatures 2–3C warmer than present.” Wiki: “Since there is no scientific consensus on how to reconstruct global temperature variations during the Holocene, the average shown here should be understood as only a rough, quasi-global approximation to the temperature history of the Holocene. In particular, higher resolution data and better spatial coverage could signicantly alter the apparent long-term behavior (see below for further caveats).[...]” Previous attempts to create global Holocene temperature reconstructions are inconsistent with the fundamental principles applicable to the statistics (excessive variance and too large range of standard deviation). -
JMurphy at 01:27 AM on 28 January 2011Monckton Myth #8: Rising sea levels
mr.duget, the last IPCC Report is always a good place to start for such questions. The link I give (via the red 'IPCC Report' text) is to 'Sea Level Variations Over the Last Glacial-Interglacial Cycle'. -
Neven at 01:27 AM on 28 January 2011Monckton Myth #6: Global Sea Ice
Albatross, Yooper, thanks. :-) Global sea ice area has dropped to 14.412 million square km and is just 20K above the 2006 minimum record. -
Monckton Myth #8: Rising sea levels
Ah - reading through a couple more posts and recent comments, "BAU" is the "Business As Usual" scenario. I have seen that term before (but not the acronym); I just was not connecting it directly to coral discussion. -
Monckton Myth #8: Rising sea levels
Tom Curtis - Pardon the question, but what is the origin of the "BAU" you have referred to? Is this an organization, a particular warming scenario, or what? Do you have links for it? Note to everyone - please expand the first use of your acronyms. Terms like "AO" and "TOA" may be perfectly comprehensible to someone used to such discussions, but if it's not explained somewhere we may prevent new-comers from understanding the threads. -
Daniel Bailey at 00:58 AM on 28 January 20112010: A Year of Record Warmth and Weird Weather
A Mohenjo-Daro sighting! One of the world's oldest settlements in an SkS post! Sorry, geeked on that a bit. Nice summary, James. The Yooper
Prev 1960 1961 1962 1963 1964 1965 1966 1967 1968 1969 1970 1971 1972 1973 1974 1975 Next


