


 Arguments


Recent Comments
Prev 1961 1962 1963 1964 1965 1966 1967 1968 1969 1970 1971 1972 1973 1974 1975 1976 Next
Comments 98401 to 98450:
-
John Brookes at 00:55 AM on 28 January 20112010: A Year of Record Warmth and Weird Weather
Hopefully with the La Nina this year will be milder. The cost, both economic and in human lives, of extreme weather events is too high. -
MartinS at 00:49 AM on 28 January 2011Rescue Climate Data
@Mila: Yes you are right, thanks for that. The project sites are now reachable. -
Paul D at 00:42 AM on 28 January 20112010: A Year of Record Warmth and Weird Weather
I like the last graph. That sort of graphic has impact. -
mr.duget at 00:39 AM on 28 January 2011Monckton Myth #8: Rising sea levels
Thanks Tom. Interesting. Are you aware of any data that isolates the sea level rise/accelerations purely due to anthropogenic causes vs. natural causes? That would make the case clearer (for me at least). It is not really possible to interpret (anthropomorphically speaking) the graph of Global Mean Sea Level or Acceleration data without the natural contributions removed. -
Eric (skeptic) at 00:37 AM on 28 January 20112010: A Year of Record Warmth and Weird Weather
It's been speculated that this unusual weather pattern might be connected to Arctic sea ice melt. Thanks for being honest about that. There are natural precedents for the blocking and negative AO patterns (e.g. the 70's). It could be that the effects of the pattern could be exacerbated by sea ice loss, but we are in new territory and it will take time to see if the pattern holds and if the effects are worse. -
Tom Curtis at 00:20 AM on 28 January 2011Monckton Myth #8: Rising sea levels
mr duget @30 First, most of the initial rise in sea levels is associated with the end of the Little Ice Age in the period from 1800 to 1850. There were natural causes for most of that, as also a significant part of the further warming in the early twentieth century. Of course,the identified natural causes for both those warmings have not been trending in favour of further warmth since about 1950, so that is no solace to any reasonable sceptic of global warming. Second, only most of that warming was natural. A significant portion of it was anthropogenic, a fact often forgotten. People often operate under the illusion that significant anthropogenic emmissions only began when coal started being burnt in steam engines (or boilers) in large amounts. But in fact, CO2 concentrations have been climbing for the last 8,000 years in large part due to deforestation, the expansion of rice paddies, and the expansion of cattle due to human farming techniques. From about 1600, anthropogenic emissions significantly accelerated due to the need for timber to build ships, and the use of coal for domestic heating. London was black from coal soot by about 1600 AD, and England denuded of forests (except the King's hunting forests) within a century of that from the demand for timber for ships. The emmissions of that period pale into insignificance compared to modern emmissions, but were still large enough to already be influencing climate. The difference in modern times is that anthropogenic emissions have changed from an influence, to the main driver of long term trends. -
Ken Lambert at 00:09 AM on 28 January 2011A Flanner in the Works for Snow and Ice calculations
MarkR #23 and Riccardo #22 So how large does time 't' become in order for equilibrium to be reached given the non-linear multi-factored components of Delta F (presumably equal to my F.imbalance), and your assumed value (or function) for Y? Given that my current F.imbalance = F.CO2GHG + F.otherGHG - F.cloud albedo - F.direct albedo + F.solar - F.radiative feedbackSB + F.WVIA feedback..........= 0.9W/sq.m Ref; Trenberth Fig 4 "Tracking the Earth's Global Energy" Aug09. (WVIA - water vapour + ice albedo feedbacks). To know where the above sum will go into the future; one would need a function for each - something I have never seen for F.cloud albedo or F.WVIA feedback). -
Tom Curtis at 00:08 AM on 28 January 2011Monckton Myth #8: Rising sea levels
LandyJim @27, it is fairly easy to make an approximate attribution for sea level rise. The vast majority of sea level rise is due to expansion of sea water due to increased water temperatures, and to glacial melt. As both of these correlate reasonably well with increase in Global Mean Temperature, the attribution of those factors can simply follow that of changes in GMT. That means humans are responsible for between 20 and 50% of sea level rise in the first part of the 20th century, and nearly all of it in the second half. Further, simply comparing land gained due to melting permafrost with land lost to sea level rise is simplistic. Any such comparison must also include land lost to basic cereals and other crops due to increased warmth. You should also include the marginal loss in the utility of land which has reduced frequency of harvests due to droughts, floods and other GW induced disasters. Considering all factors, for low temperature rises (up to 2 degrees C) there may (or may not) be a net gain; but for large temperature rises as projected for BAU at the end of the century, there is a significant net loss. For very large temperature rises such as may arise with BAU in 2 to 3 centuries, or in one if climate sensitivity is in the high end of the rain, as much as half of the Earth's surface will be seasonally uninhabitable for large mammals. Of course, none of that adresses questions of equity. Bangladesh can take no solace in the prospect of wealthy Siberian farmers. -
mr.duget at 00:08 AM on 28 January 2011Monckton Myth #8: Rising sea levels
It pains me to write anything which agrees with Lord M, but doesn't the section of the article "...another study (Jevrejeva 2008) shows that the acceleration began as far back as the 18th century" raise some questions? What is the correlation between accelerating rises in sea level in the 18th century and anthropogenic warming? 'None' seems the only answer. Given that the data shows acceleration well before human activity could be having any impact, surely the scientific case needs to be made that the current acceleration rate is greater (or less) than it would otherwise be without human activity? What am I missing here? -
Tom Curtis at 23:45 PM on 27 January 2011Monckton Myth #8: Rising sea levels
Cynicus @24, it is important to remember that "new" here just means new to the fossil record. The "new" species may just be former niche players that have taken advantage of relatively empty seas to expand to dominance. They may also be species evolved from previously dominant ancestors in refuges. In terms of human life spans, the difference is largely irrelevant. There will be no sudden recovery if the worlds major reefs are destroyed. In that event, we will face thousands, and maybe tens of thousands of years with out major living reefs, and hence with relatively barren tropical seas. -
Berényi Péter at 23:20 PM on 27 January 2011Hurricanes aren't linked to global warming
#26 muoncounter at 13:48 PM on 21 January, 2011 But here's how the folks who gather the Accumulated Cyclone Energy data forecast the 2010 storm season I don't think it does much good to your cause to cherry pick an old North Atlantic ACE forecast for 2010 when we are already well into 2011, so we have got facts. According to them, North Atlantic ACE was indeed somewhat above average, even if at the lower end of the forecast you have cited. More importantly, we are talking about global warming here, not about some North Atlantic Warming. And global ACE for 2010 was way below average, close to an all time low. -
Bart Verheggen at 23:18 PM on 27 January 2011Monckton Myth #8: Rising sea levels
Some more relevant graphs and info in this blog post: Past, current and future sea level rise I.e. also compared to the past thousands of years, it is blatantly obvious that sea level rise has accalerated in the past decades/century. -
LandyJim at 23:16 PM on 27 January 2011Monckton Myth #8: Rising sea levels
Clearly, regardless of ones position on AGW, there is evidence of average mean sea level rises going back a long way. Clearly some is directly related to natural processes and clearly some is directly related to the reduction in ice cover of the Northern Ocean, and glacial melt. As has been pointed out, there is a combination of factors at play that alter the localised picture due to forces that are clearly beyond human control, and likely always will be. It is a very difficult matter I think to truly attribute a given percentage to melt at this time because, sadly, the accuracy and the data sets are not there as all the articles do not differentiate between natural and perceived AGW causes of the rises, and this is important if the "human" factor is to be proven to the point of silencing any doubt. One thing I am curious about, and sorry if this sounds really harsh, but has anyone actually looked at the amount of land lost against the amount of land gained? If global air and sea temps rise as much as is predicted by 2100, then about 8 times as much land will be available for human use as will be lost to the sea. Clearly some of this land will be useless for sometime, but a lot, such as the vast wildernesses of Siberia and northern Canada will be usable. Now before I get seriously flamed for that comment, I would like to simply point out that regardless of what action man takes, if nature does not respond or we are wrong and many aspects are natural or simply under-estimated, then we still have a problem to deal with, one that is not going away and so we must face it head on. Putting sticking plasters on the broken leg may stop dirt getting into the wound, but it doesn't heal the broken leg..we must also look at long term solutions outside the box too. -
Riccardo at 23:02 PM on 27 January 2011Monckton Myth #8: Rising sea levels
Phil263 the last sentence of the Dailymail article reads: "Despite their findings, however, the researchers were keen to emphasise that the ice sheet is 'not safe from climate change'" Anyway, Daniel Bailey did a much better job than the Dailymail. -
Phil263 at 22:29 PM on 27 January 2011Monckton Myth #8: Rising sea levels
Talking about rise in sea level, I don't know if any of you has come across this paper about the Greenland ice sheet which was recently published in "Nature". The gist of it is that contrary to expectations, hot summer temperatures may actually slow down the flow of glaciers towards the sea, as the melting causes the internal drainage system to adapt to the warmer temperatures. I don't know whether the slowing down effect has been modelised or quantified, but apparently, the same thing had been previously noticed about mountain glaciers. The "news" was broken on ABC radio at 5 pm with the message that we should not be worried too much about climate change since the Greenland ice cap is not really melting then sea levels will not rise ! -
cynicus at 22:06 PM on 27 January 2011Monckton Myth #8: Rising sea levels
@16 It's possible that few corals species survive an extinction event in isolated places. But iirc Charlie Veron noted in his Royal Society presentation that the species found after an extinction are completely different/new. @17 Different evolutions of coral during different environments are therefore more or less susceptible of ocean acidification. The species that have evolved since the last extinction never experienced acidification levels expected this century. (Again, iirc re Veron's presentation. It's been a while since I watched it.) -
JMurphy at 22:01 PM on 27 January 2011Monckton Myth #8: Rising sea levels
Anthony G. Warming wrote : "Dowsing is certainly humbug, but would it also have been mentioned that Vermeer and Rahmsorf both are ardent astrologists, if that had been true? I doubt it. The purpose is solely to lessen his credibility. What is the term? Guilt by association?" If Vermeer and Rahmsorf were ardent astrologists I would certainly want to know about it and would certainly view them in a different light. Who wouldn't ? Who wouldn't also have doubts about scientists who believe that Creationism is a better explanation than Evolution ? And Morner's credibility is adequately lessened by his blind faith in his own abilities over and above the vast majority of scientists currently working in the field he is retired from. -
Mila at 21:51 PM on 27 January 2011Rescue Climate Data
I have put an advert for the projects at Zvon.org guide to RealClimate.org and Zvon.org.guide to Skeptic Arguments from SkepticalScience.com. I hope it helps to find a few people. -
Tom Curtis at 21:50 PM on 27 January 2011Monckton Myth #8: Rising sea levels
Rob Painting @20, speed of change is definitely the kicker here. A similar change over 10 thousand years would be nothing much to worry about, ecologically speaking. But compressed into one or two centuries ... These are probably very interesting times to be a coral scientist. They are no doubt learning new things very fast at the moment, at the same time that they risk being left without a subject matter. -
BillyJoe at 21:47 PM on 27 January 2011Monckton Myth #8: Rising sea levels
Anthony Warming post #18 "I also wonder in what way it is relevant, in respect to his authority on sea level matters, that he has dabbled in dowsing" Would you hire someone to a position of authority in a scientific field who believes in dowsing? Surely it says something about that person's scientific thinking - or lack of it - that he believes in dowsing. "Dowsing is certainly humbug, but would it also have been mentioned that Vermeer and Rahmsorf both are ardent astrologists, if that had been true?" Oops! "The purpose is solely to lessen his credibility. What is the term? Guilt by association?" Poisoning the well. http://en.wikipedia.org/wiki/Poisoning_the_well -
adelady at 21:34 PM on 27 January 2011Rescue Climate Data
Yeah I've done a few of these. It's not thrilling, but you can see why people are needed for this. -
Mila at 21:21 PM on 27 January 2011Rescue Climate Data
should be: at the end of link addresses -
Mila at 21:20 PM on 27 January 2011Rescue Climate Data
links to both projects as given in the article are unreachable, try these: Data Rescue and Old Weather - at least from Google Chrome in Linux; the extra space at the link addresses causes problems -
Rob Painting at 21:10 PM on 27 January 2011Monckton Myth #8: Rising sea levels
Tom Curtis - I understand what you mean about the coral dispersal. It's why some have dubbed them the "cockroaches of the sea". And yes, earlier generations of coral became extinct. New species evolved to re-colonize the oceans millions of years later. See Mass extinctions and ocean acidification - Veron 2008 These "reef gaps" in the geological record indicate we may not be understanding the whole picture. Warming oceans are causing more frequent and severe bleaching events, but they also stratify the oceans, which will impact coral through the reduction in nutrient upwelling (very important in many lower latitude reefs where the elevated nutrient load helps to offset lower ocean pH). Coral do after all live in a "marine desert". Some recent work suggests that some coral are literally "swimming for their lives" to escape too warm waters Coral marches to the poles. But escaping to cooler waters is only a temporary respite because they will acidify more quickly. As far as where we're headed - it's the speed of change that is the killer, for acidification it means the natural calcium carbonate buffering process can't keep up (it operates on millenial timescales to lower pH) and the upper ocean will greatly acidify. Now I'm relying on recollection here, but I seem to remember reading a paper where they estimated ocean pH expected later this century has not occurred for 8 million years?. Might have that wrong, but certainly lower pH than existed during the Pliocene (2-5 million yrs ago). Conditions the current generation of coral have not experienced. Which is of course another matter, modern day coral are composed of aragonite, which is more soluble than the calcite skeletons of ancient coral. There should be a couple of more "coral" posts in the next couple of weeks. But the overall picture is that it's not a happy time to be a coral scientist, that's for sure. -
Rob Painting at 21:01 PM on 27 January 2011Monckton Myth #8: Rising sea levels
Anthony - The purpose is solely to lessen his credibility If you actually read some of Axel-Morner's claims, you will find he has done far more damage to his own credibility than I possibly could. -
MarkR at 21:00 PM on 27 January 2011A Flanner in the Works for Snow and Ice calculations
#21: Ken, I think I got confused when you used different conventions to 'standard', and you switched definitions as well! I've added a note to the main body that derives the original ΔT = ΔF/Y equilibrium equation by considering the heat flow through time like you wanted to do. This includes both forcings and feedbacks and considers the net heat flow at any point in what I'm pretty sure is the correct manner. As you see, it's messier than just considering the fluxes at equilibrium and since both approaches are valid, they give the same answer! Hopefully this will be interesting. :) -
JMurphy at 20:58 PM on 27 January 2011IPCC were wrong about Himalayan glaciers
From the Telegraph report : Their report, published in the journal Nature Geoscience, found the key factor affecting their advance or retreat is the amount of debris – rocks and mud – strewn on their surface, not the general nature of climate change. Glaciers surrounded by high mountains and covered with more than two centimetres of debris are protected from melting. Debris-covered glaciers are common in the rugged central Himalaya, but they are almost absent in subdued landscapes on the Tibetan Plateau, where retreat rates are higher. From the report itself : More than 65% of the monsoon-influenced glaciers that we observed are retreating, but heavily debris-covered glaciers with stagnant low-gradient terminus regions typically have stable fronts. Our study shows that there is no uniform response of Himalayan glaciers to climate change and highlights the importance of debris cover for understanding glacier retreat, an effect that has so far been neglected in predictions of future water availability,or global sea level. Interesting contribution which provides more detail. Hardly "they are not retreating because of climate-change" ! -
Paul D at 20:51 PM on 27 January 2011Ten temperature records in a single graphic
I would really like to know what school pirate is at. But in any case, I wouldn't trust the opinions of a few (American) teenagers! In fact I wouldn't trust my own beliefs as a teenager. I believed Eric Von Danikens extraterrestrial ideas when I was a teenager. There are a lot of things I believed then or which drove my imagination, that were in retrospect complete garbage. I think Marcus has made the definitive comment regarding pirate and his students. Science isn't a democracy, whether students believe something different, eg. creationism, it doesn't have any relevance to scientific truth and reality. I guess some of the problem is political correctness, all beliefs are accepted, even if the subject has nothing to do with 'belief'. -
Anthony G. Warming at 20:22 PM on 27 January 2011Monckton Myth #8: Rising sea levels
Just a comment to the Mörner-paragraph: Niklas is a perfectly valid first name in Sweden, but his real name is Nils-Axel Mörner. I also wonder in what way it is relevant, in respect to his authority on sea level matters, that he has "dabbled in dowsing". Dowsing is certainly humbug, but would it also have been mentioned that Vermeer and Rahmsorf both are ardent astrologists, if that had been true? I doubt it. The purpose is solely to lessen his credibility. What is the term? Guilt by association?Response: [John Cook] Apologies to Rob Painting but I have removed the reference to dowsing in the article. The reference is ad hominem which is not appropriate at Skeptical Science, nor is it required. All that's needed is to examine the scientific veracity of Axel-Morner. His claim that "it is physically impossible for sea level to rise at much above its present rate" clearly contradicts many lines of evidence. -
Matthew at 20:18 PM on 27 January 2011IPCC were wrong about Himalayan glaciers
This says they are not retreating because of climate-change. http://www.telegraph.co.uk/earth/environment/climatechange/8284223/Himalayan-glaciers-not-melting-because-of-climate-change-report-finds.html -
scaddenp at 20:02 PM on 27 January 2011It's albedo
RW1 - I am very concerned about this use of "gain" and "amplification". It suggests you are thinking about this via a very inappropriate electronic analogy. There is no "fixed gain" controlling how incoming flux translates to surface heat flux. That depends on GHG gas composition and surface temperature and a host of other elements. Your translation of 3.7 to 5.9 is plain wrong. Science of Doom has a series of lengthy articles with a lot of discussion on the actual mechanisms. I can only suggest a detailed study and throw out the "gain" concept. As to model output. The real physics, not simplistic analogy, including the role of water vapour as a feedback are calculated in the models. The output from the model is surface temperature through time given the actual forcings of solar, GHG concentration, volcanoes etc. From the output, you work backwards from temperature to determine the value of sensitivity - which comes to about 3. The validity of the model is tested by comparing forecast surface temperature actual observed surface temperature. If the sensitivity - which involves all those feedbacks is wrong- then temperature prediction would be too. I thought this was plain in the article. -
Tom Curtis at 19:20 PM on 27 January 2011Monckton Myth #8: Rising sea levels
Addendum to @16, corals have definitely survived through oceans at least as acid as those expected as a result of BAU by the end of this century, ie, with CO2 contents as high as is expected by then. That does not mean current living species of coral can do so without stress, for they will have adapted to the low CO2 levels over the last 50 million years. Ocean acidification will be another stress on corals. -
Tom Curtis at 19:13 PM on 27 January 2011Monckton Myth #8: Rising sea levels
Rob Painting @14, very interesting. I knew it had happened at the Permian extinction event, but not in so many extinction events. By disappear, you of course mean disappear from the fossil record, and artifact of a limited number of survivors in remote refuges. I would be surprised by the complete extinction of all corals. This is not because I do not think the stresses are sufficient. With global warming causing coral bleaching, ocean acidification, increased sedimentation due to greater river run offs, and increased storm damage - not to mention dynamiting of reefs as a fishing technique (as is done in Indonesia) and the stresses of ecosystem collapse; there are certainly likely to be enough stresses to cause it. However, the manner of coral dispersal implicit in their reproductive cycle suggests that if there are any suitable refuges for corals in the world (almost inevitable given the worlds size and complexity), some corals will find their way to those refuges. Of course, even so, it will be many thousands of years before corals would again be able to become major reef builders in BAU scenarios. -
Glenn Tamblyn at 19:11 PM on 27 January 2011Ten temperature records in a single graphic
apiratelooksat50 #68 Then here is a proposition. Conduct some in depth polling with this class to find out 'why' they don't accept AGW and bring the results back here. Is it a lack of knowledge that they have based an opinion on? Detailed knowledge that they have based an opinion on? Are the views based on an evaluation of the data or their opinions about who is saying it? Are their opinions influenced by their outlook on life. What are the demographics of this group? Religious orientations, economic background etc. Get something more than anecdotal and then we can discuss it. -
Tom Curtis at 19:02 PM on 27 January 2011Monckton Myth #8: Rising sea levels
Everett Rowdy @13, that is an even rise of all tide levels, but first not all tide levels will be the same on a local basis because the effects of change in barometric pressures and onshore of of shore breezes. A high pressure system, for example will lower tide levesls, while a low pressure system will raise them. Consequently a 2mm or even a 2 cm rise in SL will probably not be detectable as a straightforward rise, but rather as an average effect. More importantly, many parts of the world are either rising or sinking due to the motion of the continental plates. Much of south east asia is rising, for example, because of the slow northerly advance of the Australian continental plate. Further, some parts of the world are still rebounding from the loss of mass resulting from the melting of ice sheets at the end of the last glacial. That is true of scandinavian countries, for example. These motions are generally significantly larger than current changes in sea level. The effect of Mean Sea Level rise in those areas will be to make the areas that are sinking to have a more rapid sea level rise; and the areas that are rising to have a slower sea level fall. So absent more information, I cannot tell you whether the relative sea level on your section of the coast is rising or falling. -
Rob Painting at 18:51 PM on 27 January 2011Monckton Myth #8: Rising sea levels
Tom Curtis & Ron Crouch - 4 of the 5 major extinction events lead to the complete disappearance of coral, for many millions of years at a time. The current rate of ocean acidification is unprecedented, outside of an asteroid impact. I wouldn't bet against them being eliminated altogether, but I certainly hope not!. Everett - click on the link provided with figure 1. Whole lot of information there from an authority on the topic. The 3mm SLR is a global average. It can vary from place to place for a number of reasons (see CMAR CSIRO link), but no, it's not simply a matter of adding 3mm to each phase of the tide. -
Kevin Hood at 17:34 PM on 27 January 2011Monckton Myth #8: Rising sea levels
As someone who lives on the coast, I have a question regarding sea level rise: If sea level is rising, say 2mm per year, is that a uniform rise throughout the tide cycle or is it nonuniform? For instance, would I simply add 2mm to the lowest tide level, the mid-tide level and the highest tide of the day or would it be nonuniform with the average equaling 2mm? If it is the latter, would that mean that I should add something more than 2mm to the high tide level? Thanks in advance for any enlightenment! -
adelady at 17:02 PM on 27 January 2011The Queensland floods
John, don't know about calculating costs in government policy, but cost will certainly figure in your next premium on your insurance policy. -
John Brookes at 16:44 PM on 27 January 2011Ten temperature records in a single graphic
Hmm, apiratelooksat50@68: Reminds me of when my niece was little. You could ask her if she wanted vegemite or peanut butter (but you had to say, "mite or butter?"). If you asked "mite or butter?", she would answer "butter", but if you asked "butter or mite?", she would answer "mite". Anyway, if you have that class again, why not get them to read this website for a while, and then go and read WUWT, then have a discussion led by someone who understands climate science. After that their opinion might mean a bit more. -
RW1 at 16:31 PM on 27 January 2011It's albedo
scaddenp, "Its not clear to me where you get your 1.6 from? Geometric correction? Why do you assume the solar number includes water vapour feedback when the CO2 value explicitly does not." How could the roughly 239 W/m^2 of post albedo power from the Sun (amplified to about 390 W/m^2 at the surface) not include the effects of water vapor 'feedback'? In other words, how could the effects of water vapor not have fully manifested over decades or even centuries? Even over a hundred years ago, the gain was still about 1.6. For what physical or logical reason would the water vapor response be radically different from each W/m^2 of power from the Sun? "There is little value in talking about TOA forcings if there is a feedback value included. The extent of feedback for a given forcing is the key to calculating climate sensitivity. (how many degrees of temp rise for a doubling of CO2)." I'm not referencing just "TOA forcings" - but the intrinsic forcing of 3.7 W/m^2 plus gain, which is about 5.9 W/m^2. "There is no back of the envelope way to do this - its an output from full GCM - and, yes the greatest uncertainty in the system. However, if you look at Realclimate's latest model/data comparison , you will see that AR4 values of about 3 fit well with data." I know what the models are outputting, but fit well with what data, specifically? I don't see anything in that link about water vapor, which you claim is a big 'feedback' I'm not accounting for. -
caerbannog at 16:28 PM on 27 January 2011Ten temperature records in a single graphic
A Pirate said... Of the 30 students in this room, 28 of them are already accepted to college and half of them are going on scholarships. Not one single student supports the AGW theory. They think human activities have effect on the climate and contribute to temperature changes, but they do not think CO2 is the driver. Let's see.... those here who accept AGW can cite the world's leading scientists (including Nobel Laureates and National Academy members), *all* of the world's leading research laboratories and universities (ranging from Lawrence-Livermore National Laboratory, to the Scripps Institution of Oceanography, to the Max Planck Institute, to CalTech, the University of California, MIT, Harvard U., Oxford, etc., etc., as well as every single professional scientific association of any stature on this planet. And who does a vocal skeptic here have to cite? High-school students??? HIGH-SCHOOL STUDENTS???? (sorry for the caps-lock action here.) apiratelooksat50, is that all you've got??? -
pbjamm at 16:24 PM on 27 January 2011Ten temperature records in a single graphic
@65 apiratelooksat50 Why should the opinions of some HS students (no matter how smart) matter? I certainly would not be interested in their opinions on subjects in my field of expertise. Not until they showed them to be more than opinion anyway. -
John Brookes at 16:22 PM on 27 January 2011The Queensland floods
It is of course difficult to say just how much worse this particular flood was than it would have been without global warming. But it does raise an important point. When calculating the cost of climate change, is this sort of event factored in? -
Marcus at 16:05 PM on 27 January 2011Ten temperature records in a single graphic
Ahhh, Pirate, you still haven't clued into the fact that Science is *not* a Democracy. Either your opinions are backed by the Scientific Evidence, or they're *not*. How many people agree with you-even if they are bright, college bound types-is really besides the point if those same people can't provide *proof* for why they agree with you! Of course, the "oh, but look at all these people who agree with me" anecdotal "evidence" is a fairly typical ploy on the part of the Skeptics. In the absence of *scientific evidence*, just run around saying that all of these bright, collage bound types agree with your opinion-so that must make you *right*. Newsflash, it *doesn't*!!! -
apiratelooksat50 at 15:45 PM on 27 January 2011Ten temperature records in a single graphic
Sphaerica at 47 Did you not read my post? Their teacher buys in to the AGW hypothesis. And, he is the most titled educator in the department. Today was the first time I've ever had contact with any of them in 4 years of their schooling. I teach different Jr. and Sr. level courses. These are bright, educated, college scholarship worthy students. How dare you accuse anyone of "misteaching or misleading" just because they don't agree with you? Their primary teacher over their high school career is in your camp! -
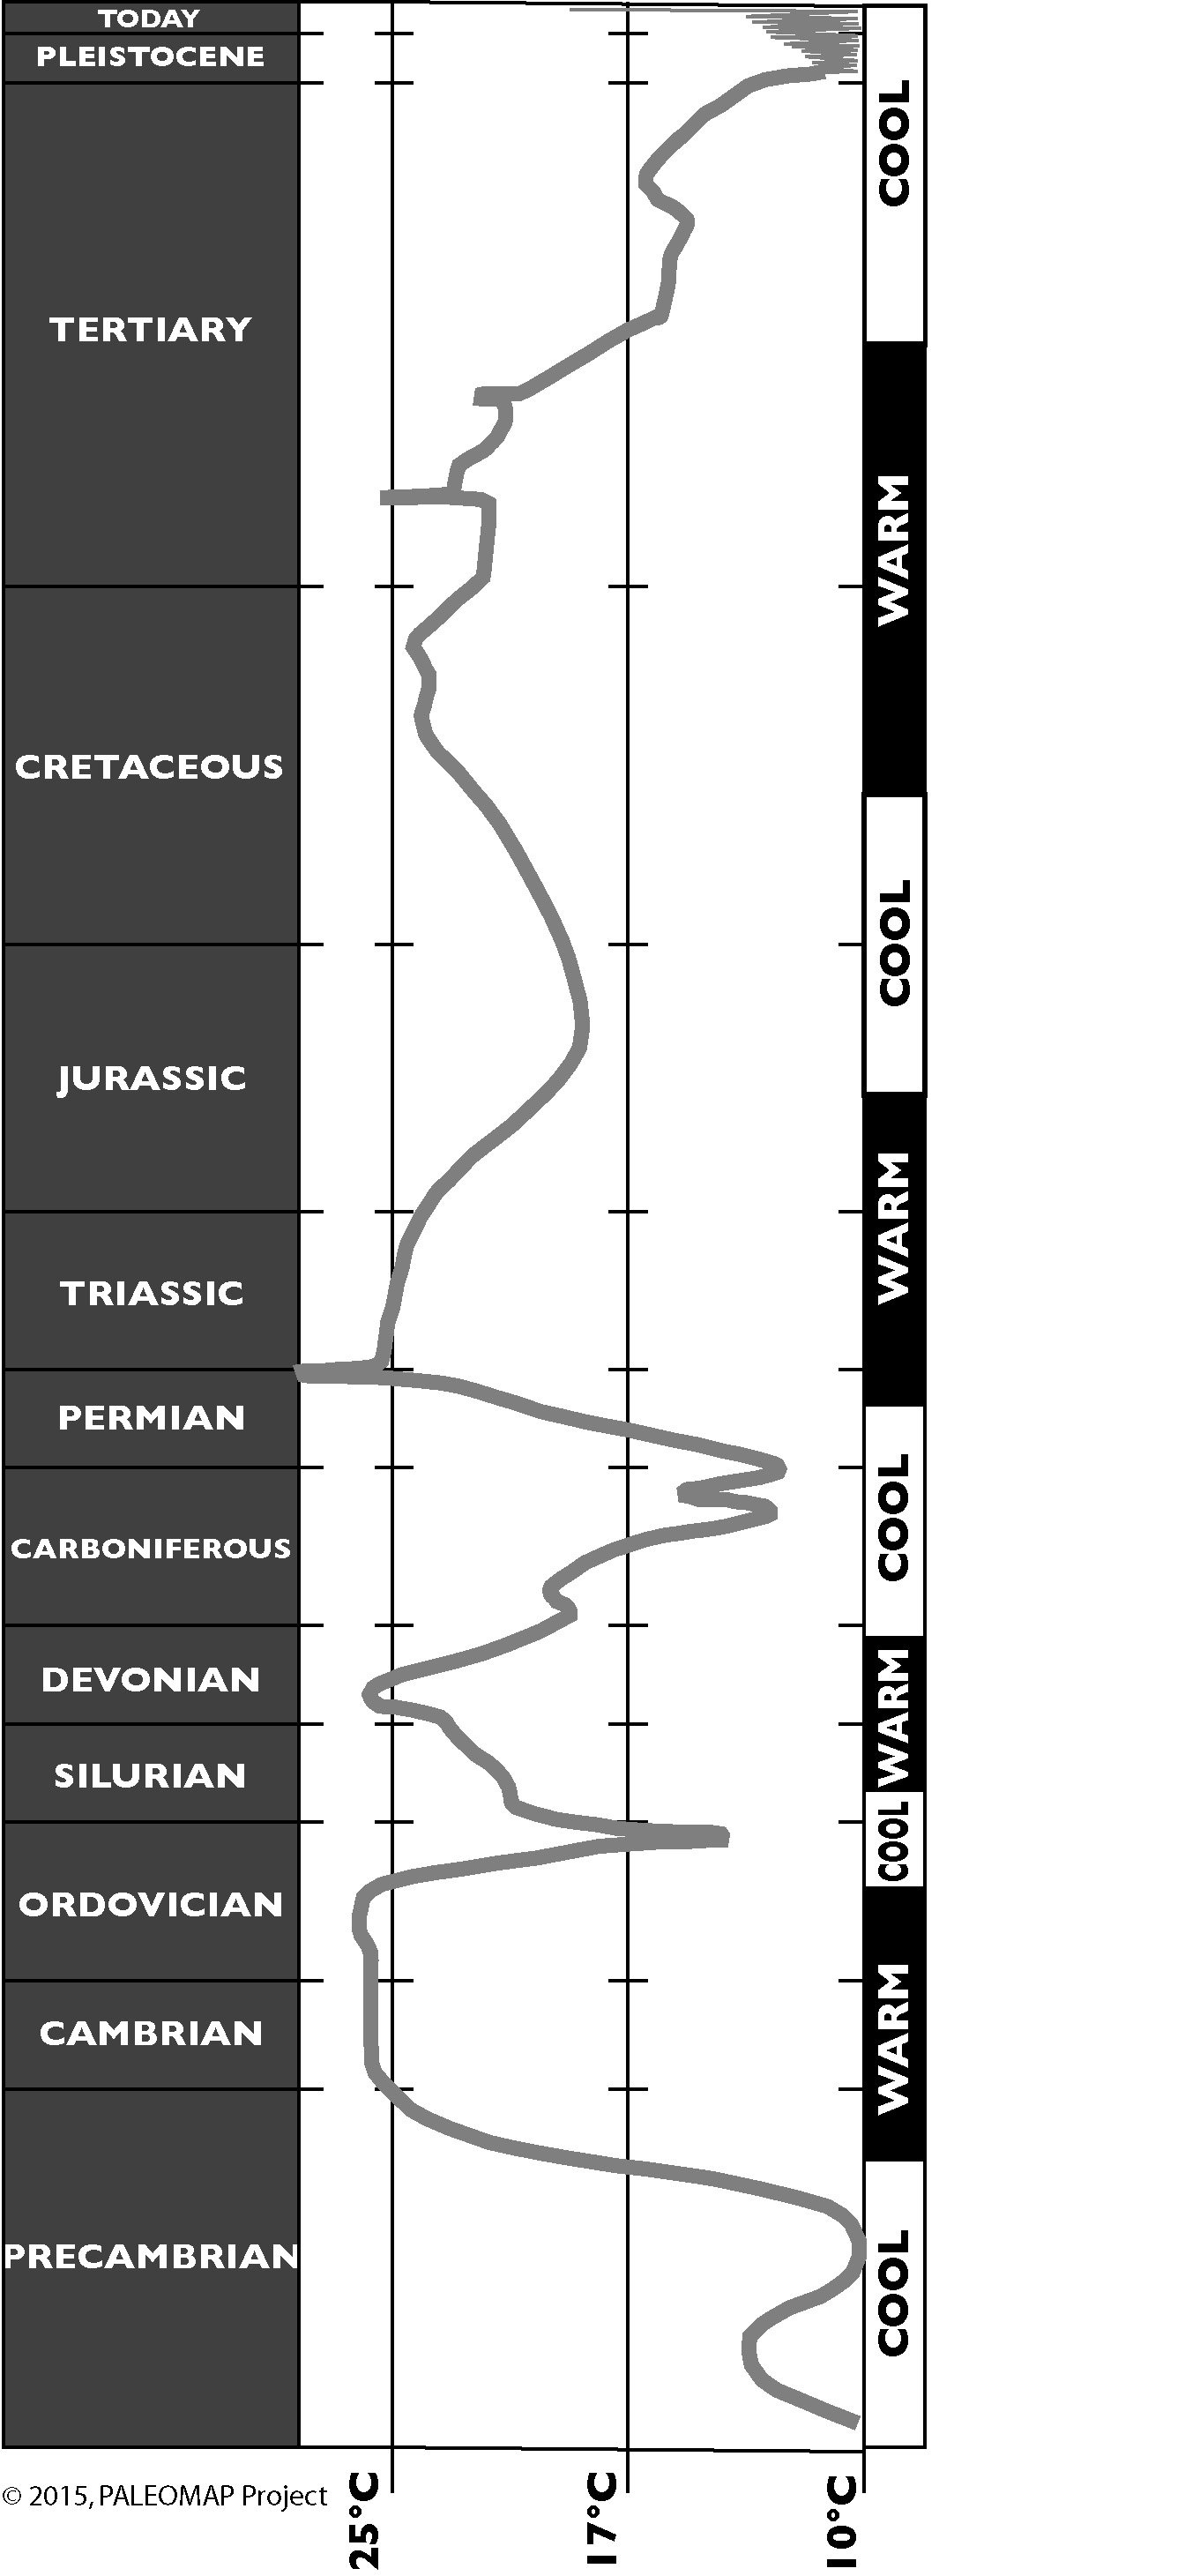
Ron Crouch at 15:26 PM on 27 January 2011Monckton Myth #8: Rising sea levels
Thanks for elaborating Tom. I'm not going to say that some coral species might not go extinct, some might, but in the long term I don't see all coral species disappearing either. Even since the end of the Permian coral species have managed to weather many storms (glacials/interglacials, Chicxalub, etc). I agree that 10oC more may be stretching the limits that corals can tolerate, and then there's also the question of pH tolerance. As far as the role that corals might play in the future, I would prefer not to speculate. If we compare the temperature record here with the extinction intensity here it would tend to indicate that we're not currently to badly off (yet) in comparison to Earth's historical past, but then the Earth's population wasn't pushing 7 billion either, and that presents a whole new wrinkle. The bottom line being that it's not too late to avoid dangerous climate change, but it will take a massive commitment on the part of all this planets inhabitants to avoid it. -
scaddenp at 15:18 PM on 27 January 2011It's albedo
Its not clear to me where you get your 1.6 from? Geometric correction? Why do you assume the solar number includes water vapour feedback when the CO2 value explicitly does not. There is little value in talking about TOA forcings if there is a feedback value included. The extent of feedback for a given forcing is the key to calculating climate sensitivity. (how many degrees of temp rise for a doubling of CO2). There is no back of the envelope way to do this - its an output from full GCM - and, yes the greatest uncertainty in the system. However, if you look at Realclimate's latest model/data comparison , you will see that AR4 values of about 3 fit well with data. -
muoncounter at 14:15 PM on 27 January 2011There is no consensus
Interesting news, identifying how some of those non-consensus scientists get their funding. Waxman Asks Upton to Examine Dr. Patrick Michaels’s Testimony Dr. Patrick Michaels of the Cato Institute testified that widely accepted scientific data had “overestimated” global warming and that regulation enacted in response to that data could have “a very counterproductive effect.” ... In its “Morning Energy” column, Politico described a CNN appearance by Dr. Michaels in which he gave “40%” as his estimate of how much of his funding comes from the petroleum industry. But that would never compromise their opinions. -
scaddenp at 14:05 PM on 27 January 2011CO2 is not a pollutant
The variation in CO2 that reinforces the ice-age cycle is biogenic - Ocean effects, swamp methane, vegetation change. The CO2 that is causing current warming comes from burning fossil fuels. The biogenic feedbacks that come with increased temperatures are slow and make hardly any contribution yet. How do we know where the CO2 comes from (both in atmosphere today and in the past)? Isotopes of carbon. Fossil and biogenic have different signature. -
RW1 at 14:00 PM on 27 January 2011It's albedo
scaddenp, "First, 3.7W/m2 is "effective top of troposphere forcing", so this is effectively the same as 3.7W/m2 of downward. Talking "even if all directed at surface" is misunderstanding how the forcing is calculated." For the purposes of my question, I'm willing to accept this. "Second, sensitivity would be much lower as you suggest if there were no feedbacks. Albedo plays big role when ice sheets large, now, not so much. The other big feedback is GHG effect of water vapour." Why is the water vapor 'feedback' not embodied in the gain of about 1.6?
Prev 1961 1962 1963 1964 1965 1966 1967 1968 1969 1970 1971 1972 1973 1974 1975 1976 Next


