


 Arguments


Recent Comments
Prev 1978 1979 1980 1981 1982 1983 1984 1985 1986 1987 1988 1989 1990 1991 1992 1993 Next
Comments 99251 to 99300:
-
robert way at 02:45 AM on 7 January 2011Graphs from the Zombie Wars
Keithpickering, Dual scales can be used on Excel (called secondary axis). Another thing you could potentially do is take both datasets and standardize them using the following formula (function called standardize in excel) Zvalue = Xvalue - Mean of Series / Stdev of Series -
Yvan Dutil at 02:45 AM on 7 January 2011Graphs from the Zombie Wars
I have a friend who is a zombie. He has a BSc in Physics and a BSc in Physical engineering as a master in Physics. You should think he would understand the scientific arguments. No even, because it is totally blind to them. He hates government and has an absolute belief in free market. Each time, you provides him adequate information, he will stop converse with you. -
Todd F at 02:42 AM on 7 January 2011Graphs from the Zombie Wars
In calculating co2 sensitivity, the methodology in the post would understate it because it does not account for thermal inertia in the oceans, which produce a significant lag in global temperatures in response to increased co2. Thus further warming is in the pipeline, even if co2 concentrations were to remain constant. I think this commitment is estimated at around 0.3C to 0.8C. http://www.realclimate.org/index.php/archives/2010/03/climate-change-commitments/ I think non-co2 greenhouse gases largely offset the expected cooling impact of aerosols, which is why modeling just co2 works fairly well, even though the other forcings are significant on their own. -
Spaceman Spiff at 02:40 AM on 7 January 2011Graphs from the Zombie Wars
fydijkstra @13 Soon you'll be able to add a point on your graph for 2010. A preliminary measurement (NASA GISSTEMP) can be found at Jim Hansen's website. He and his collaborators regularly update this page as the processed data come in. -
skywatcher at 02:37 AM on 7 January 2011Graphs from the Zombie Wars
#31, funny you say that, considering the charts purport to show different things. Keith Pickering's charts show the rather good relationship between CO2 concentration and temperature over the past 160 years. Snide comments about dodgy scales are not necessary as he explains his methodology and the results are reproducible. This methodology highlights how dominant the response of temperature is to CO2 forcing over other factors, such as solar etc, especially in the last 40 years, and as shown by the research. fydijkstra's chart incorrectly assumes a logarithmic profile for the future global temperature, when the logarithmic relationship he refers to only applies to the radiative forcing specifically by CO2 (and a different logarithmic profile for methane radiative forcing). The resulting temperature change does not only depend on the radiative forcing. When you add in feedbacks such as water vapour feedback, CO2 feedback and albedo feedback, there is no guarantee that a logarithmic relationship is the outcome. In fact, with reference to the shape of glacial terminations, such a shape seems extremely unlikely if you do things like lose shiny surfaces you can't easily grow back... -
les at 02:29 AM on 7 January 2011Understanding the CO2 lag in past climate change
regarding #73, could someone please explain to me how, because humans account for 15% (or what ever) of the total CO2 in the atmosphere, we're only responsible for 15% (or what ever) of the increase in temperature. I've heard this argument before and can't quite make sense of it. I had kind of assumed that if the system was in balance and we come along and unbalance it, we're responsible for it tipping over... 100% -
keithpickering at 02:28 AM on 7 January 2011Graphs from the Zombie Wars
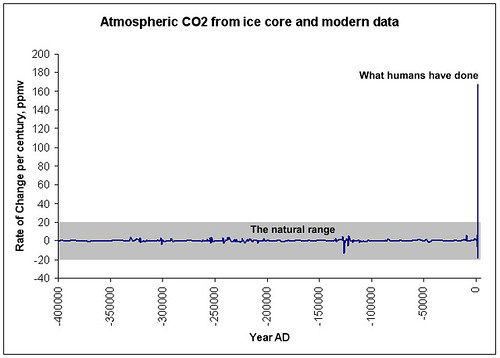
#miekol: Is this natural?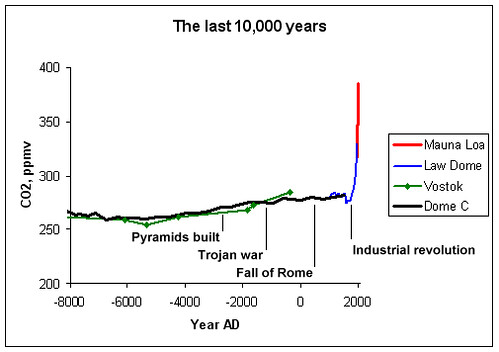 Is this natural?
-
keithpickering at 02:24 AM on 7 January 2011Graphs from the Zombie Wars
#Ian Love, Toby Joyce, et. al. -- Yeah, well I'm still using Excel 2000 cause I'm too cheap to get anything newer in the open-source age. #Ken Lambert -- I like fydijstra's chart too, but it's exactly the same as mine except for the use of a logarithmic trendline instead of a linear trendline. In what sense are my scales "dodgy"? -
Joel-Snape at 02:11 AM on 7 January 2011Understanding the CO2 lag in past climate change
That's meant to be "discernable", not "desirable". -
Joel-Snape at 02:08 AM on 7 January 2011Understanding the CO2 lag in past climate change
@Sout There are problems with using ice-core proxies to determine past CO2 concentrations because it's likely that CO2 would have leeched out of the trapped air-bubbles, albeit very gradually, giving the appearance of stable CO2 concentrations over millennia. Stomata proxies show much more variability, although I am sure they come with uncertainties too. Just about every aspect of paleoclimate reconstruction seems extremely conjectural and uncertain to me. On topic, the hypothesis that positive feedback was the main cause of the earth's climate switching between glacial and inter-glacial states is one that sounds reasonable to me on the face of it, although I have seen nothing as yet to convince me that it definitely was the main cause. I have still yet to come across convincing evidence that CO2 is having (or can have) any desirable effect on global temperatures, and until I see some, I’ll remain sceptical on the idea of CO2-positive feedback. Orbital cycles seem a tad more plausible to me. -
les at 01:54 AM on 7 January 2011What's in a Name?
@14 A facts based argument, eh? Oh no you don't! You must be being paid $millions to cover up the truth! -
apiratelooksat50 at 01:47 AM on 7 January 2011Understanding the CO2 lag in past climate change
This article and subsequent threads have been very informative and do a good job of linking orbital changes to warming and cooling phases in Earth's history. The AGW theory failed to explain historically-known phenomena. The earth has experienced many periods of cooling and warming without the help of mankind. While it does appear that increasing CO2 levels, whether from anthropogenic sources or not, are having a documentable affect on the climate, it is also not clear how great these affects are, or may be. Label me a skeptic or denier, but I am not convinced that anything we are experiencing now cannot be explained by historical scientific observations that are completely validated (El Nino, La Nina, orbital variations, solar activity, PDO, volcanic eruptions, etc...). And, before you say I am "just a teacher", I have a B.S. degree in Biology and an M.S. degree in Environmental Engineering, and worked for 20 years in research, consulting, industry and environmental enforcement/compliance. Initially I was pro-AGW, but over the years as I've witnessed the shouting down and negative labeling of legitimate scientific inquiry that questioned components of the AGW theory, my position changed. Real science is always open to refutation and revision. In addressing man-made global warming, it is far more prudent and cost-effective to adopt a wait-and-see approach than to spend trillions now on what may or may not be a problem. Even if global warming becomes a problem, it’s going to be a problem regardless of how much we spend. Man-made contributions to atmospheric CO2 concentration total 15 percent and natural sources the remaining 85 percent, according to the U.S. Department of Energy. According to data from the National Oceanic and Atmospheric Administration’s Earth System Research Laboratory, between 1980 and 2006, the average global temperature increased 0.7 degrees F while atmospheric CO2 levels rose 48 parts per million by volume (ppmv). Fifteen percent of 0.7 degrees F equals 0.11 degrees F from man-made sources. Using United Nations climate-panel numbers, the atmosphere gains 2 ppmv a year of CO2 annually. After 10 years of a “do-nothing” approach, there would be an increase of 20 ppmv correlating to 0.3 degrees F. Of that increase, 0.05 degrees F would be man-made. To avert a miniscule amount of potential man-made global warming, according to some research, it would be necessary to shut down the entire global economy for a decade. By adopting a wait-and-see approach, we still have plenty of time to address even the worst-case predictions of climate change. Since it’s unlikely that we could do much to avert it, why not spend that money fighting the changes? Or, we could feed and educate everyone in the world.Moderator Response: [muoncounter] Please avoid blanket statements like 'AGW theory failed to explain,' 'according to some research', etc. Document 'shouting down' of legitimate science and 'shut down the entire global economy' or such overt generalities cannot be taken seriously. There are multiple pages here at SkS that address your opinions; please use Search to find the appropriate threads. There is a lot to read and come to understand; you might want to see if your opinions and cursory research bear up to what the actual science has to say. -
Ken Lambert at 01:32 AM on 7 January 2011Graphs from the Zombie Wars
Original Post #keithpickering You should have a look at the excellent chart by fydijkstra #18. It puts your charts with dodgy scales and simplistic linear fits in the shade. The time integral of the net forcing from all sources (CO2GHG, Solar, S-B, Cloud cooling etc)is the energy applied to warming the planet - I would like to see this plotted against the temperature response. -
Paul D at 01:27 AM on 7 January 2011What's in a Name?
Using Google scholar and searching for Svante Arrhenius gives a number of references, including 'Worlds in the Making'. -
Paul D at 01:25 AM on 7 January 2011What's in a Name?
@13 and spike. I haven't investigated but maybe this is an explanation: 1896 was the year that Svante Arrhenius proposed the theory of greenhouse gases and climate change. One would expect some activity around then. In 1900 Knut Ångström launched a critique and in 1901 Arrhenius replied. http://en.wikipedia.org/wiki/Svante_Arrhenius#Greenhouse_effect -
Bob Lacatena at 01:14 AM on 7 January 2011Understanding the CO2 lag in past climate change
66, gallopingcamel,While correlation does not imply causation it is clear that CO2 is not driving temperature changes on Vostok timescales. Does CO2 affect temperature at other timescales? I have no doubt that it does through all kinds of mechanisms
Okay, at this point you are purposely simply ignoring the OP and the logic of the whole situation to blow smoke and present inaccurate information, while trying to make your position seem palatable and reasoned with faux skepticism. Go back and read the post, and think about it enough to understand it. There is a perfectly logical reason why CO2 would affect temperatures on long time scales, and also be influenced by temperatures on long time scales (feedback loop). Trumpeting one effect while ignoring the other is either using childishly simplistic thinking, or else presenting such childishly simplistic thinking in an effort to score points with the gullible that can't be bothered to think it through themselves to that degree. There are also perfectly good, obvious, and difficult to refute reasons (without just making stuff up, or purposely ignoring facts and logic) why CO2 is currently driving temperatures to unheard of levels at an unheard of rate. Saying "I'm reasonable, but..." followed by a lie and misrepresentation is still lying. -
Bob Lacatena at 01:08 AM on 7 January 2011Understanding the CO2 lag in past climate change
56, Lurgee,I have taken time to read comments and papers published by the experts you refer to. They bear out what I said - that interpreting ice core data is fraught
No, actually, they don't. They detail all of the considerations, how they should be handled, and what the margins of error are. You're simply choosing to interpret and portray it as such for your own purposes.Can you point to a paper published by someone with suitable credentials, stating...
Clearly I can't, because you say you've already read the papers, and you're willfully choosing to misinterpret and misrepresent what you've read. If I give you a paper, you'll just come back and say you've read it, and that black is white....my doubt about the wisdom of relying on a single core...
If you compare different ice cores, you'll see significant variation between them.
Um... which is it? I thought you said there was only one? Obviously you know enough to know that there are different cores from different sites, in both the Antarctic and Greenland -- even though you seem to like implying otherwise (to fool the casual reader?). But that getting such cores is a very expensive operation, so there still aren't many. What makes you think people look at one to the exclusion of others?...or trying to 'refudiate' AGW on the basis of CO2 lagging temperature on the way down.
But that's not the issue. It makes sense that CO2 would lag temperature in that situation. It should. The problem with that argument against AGW isn't that CO2 doesn't or wouldn't or shouldn't lag temperature. The problem is that the mechanisms and interplay of events means it's comparing apples to oranges. It's like saying that you've always seen bullfighters kill bulls, so there's no way that a bull could ever kill a bullfighter. Sorry, but the ice cores are exactly what they are. They aren't perfect, but their imperfections are well understood and recognized, and they are perfectly acceptable and accurate proxies for CO2 levels and temperatures on the timescales in question. Saying anything else, with so much hand waving and "I've read..." is just blowing smoke to try to make skeptic arguments seem viable. -
JMurphy at 01:07 AM on 7 January 2011Graphs from the Zombie Wars
The ultimate problem with the climate zombies and their beliefs, is that we can end up stating : "Alright, you're not convinced and no-one can ever convince you if you are not prepared to accept the vast number of scientific studies available, but would rather cling to the very few contrary reports that exist or would rather take a 'wait and see' attitude. So, why not let the scientists give their advice to governments and let the decisions be made based on what the science says." The response from them varies from "I'm not letting my tax dollars be 'wasted' on blah, blah, blah" to "Let's have a big debate and then the public can decide" to "I don't trust the government" to "It's all a big left-wing, green, elitist, UN conspiracy anyway !" Rationality can make little headway against irrationality, especially when the latter is basically naked ideology searching for even the tiniest fig leaf of (usually pseudo-)scientific cover. -
les at 00:57 AM on 7 January 2011What's in a Name?
Hiding the Spike!
I notice that the above Ngrams only start in 1979. Looking at the full scale I found a spike at round 1900! Now that's clearly before the industrial revolution and this must prove that both GW and CC and not caused by CO2.warmists might try to look at the books at the books in this selection and will probably suggest that it's largely a glitch in the google but wouldn't this just prove that science is unreliable?
I've looked at some of the book and notice that many entries are due to sentences like: "be subjected to wet and cold, change of climate, change in occupation, increased or decreased work"... now "climate, change" happens quite often in this spike... to often to be coincidence... this, I believe, is the work of aliens, or the New World Order, or aliens working with the NWO...
Apologies, I'm feeling quite flippant these days, please feel free to delete this post as being off-hominem.
-
muoncounter at 00:42 AM on 7 January 2011Graphs from the Zombie Wars
#18: "To say that the CO2 is coming from nature involves you inventing a magical way for 30 billion tons of human CO2 to disappear... " Magic seems to be the basis of Miekol's (and others) 'arguments': 'CO2 is coming from nature' - source unknown, so presto! 'Oceans giving up CO2 as earth warms' - yet oceans are acidifying, so presto! It must be a magic trick that ~50% of fossil fuel CO2 emissions consistently equates to the observed annual atmospheric CO2 concentration change. A magic trick that cities have peaks in CO2 concentration that match daily, weekly and seasonal traffic patterns. The actual magic is that they can cling to the hope that as long as 'it might be anything else', then it can't be AGW. -
skywatcher at 00:40 AM on 7 January 2011What's in a Name?
Jim Simpson - that's the whole point surely, that in the scientific literature both terms are old (in fact 'climate change' is older), and both have a specific meaning. Skeptics have indeed twisted the meaning by suggesting that there has been a deliberate change, but there has not been such a change. "Global Warming" applies very nicely to graphs of global or hemispheric temperatures, but not to very much else predicted to happen within a warmer world - floods, droughts, sea level rise, ocean acidification, unusual winter weather patterns etc. Actually, I prefer terms such as global climate disruption/destabilisation, as they begin to get across the concept of unusual and perhaps destructive weather patterns and weather events that are the inevitable result of more energy and water vapour in the atmosphere. Politically at least, "warming" was fine for what happened in the '80s and '90s, but it doesn't cover what is happening now, which includes both warming and the emergence of consequent events. As long as the general public only think it's about 'warming' they have the wrong idea about what is happening and is going to happen. As a result, in Britain, very few connections are being made between unusual winter weather and warming, and some talk of poor summers indicating cooling - of course the global picture is unmistakeable, but the local expression may be a different form of climate disruption than rising temperatures. Many in Britain would like 'warming', but they naively don't comprehend what comes with it, and even worse when the global warming isn't expressed across the British Isles! -
Dennis at 00:39 AM on 7 January 2011Graphs from the Zombie Wars
I'll add my agreement to the emerging consensus here about the difficulties when trying to discuss science with the Zombies. The different ways the data are presented here is excellent. And the analysis has been great. Yes, there are issues to deal with which makes this, like every other branch of natural science, imperfect. The chart with the correlation coefficient r = .89 is a persuasive tool. The author is correct in pointing out the imperfections of this -- it's not appropriate for prime time in a peer-reviewed journal -- but it does make a compelling visual. But when a Zombie comes along as says "I'm not convinced," the natural inclination of the scientific community is to move deeper. We make a good faith effort to convince him/her. I.e., we say, read this and this and this and so on. We stick with the science and attempt to build on the knowledge. But the Zombie typically just repeats "I'm not convinced." At this point, it would be enough to say we're just not getting through to you. Unfortunately, the Zombies typically apply a double standard. Zombie sites like WUWT regularly put up flawed analyses and the Zombies are silent on all the errors that are easy to spot up there. If the Zombies were genuine in applying their "I'm not convinced" statement to science, they'd be all over a site like WUWT pointing out the flaws. But they're not. I'd like to hear them explain why not. -
skywatcher at 00:25 AM on 7 January 2011Graphs from the Zombie Wars
sorry Keith, your name isn't 'The Numerate Historian'! major oops... -
skywatcher at 00:23 AM on 7 January 2011Graphs from the Zombie Wars
Nice graphs TNH! I'll repeat what others have mentioned, that your numbers come in at the low end of climate sensitivity, because you are estimating the transient sensitivity, rather than the equilibrium sensitivity, which will be a bit higher (maybe a lot higher). The Zombie Wars are an annoying place. Having been a scientist for 10 years, you get used to having (mostly) reasonable and rational discussions with colleagues, in places where evidence has a great deal of value. These concersations can be quite strong, and the disagreements can be significant, but evidence is respected. There's a reason why no respected climate scientist doubt that the Earth is warming by a significant amount as a consequence of human GHG emissions - because the weight of evidence is so strong that alternative positions are untenable. Debates about the finer points of coutse carry on, say exactly how the ice sheets are responding, how to monitor them, the value of equilibrium forcing, and numerous other detailed and challenging questions. Zombies just don't get that, because they do not have the ability to weigh up the evidence in an impartial scientific manner. Many times I've said to a climate zombie "I wish your argument was right". Most scientists wish the premise of the zombie arguments was right, and of course would give anything to be the first to publish that result with research-quality evidence - sadly that evidence appears not to exist, and we are forced to accept the unhappy alternative, our reality. But zombies are not scientists, or if they claim to be, they are not applying their scientific training to this problem. -
tobyjoyce at 23:25 PM on 6 January 2011Graphs from the Zombie Wars
David Horton @21, I am afraid you are right (Sigh). -
Alexandre at 23:17 PM on 6 January 2011Graphs from the Zombie Wars
perseus #5 A few months ago I tried to find emission inventories or at least the total emissions of CO2e from each country, including land use emissions. No success. Those are indeed very difficult data to find. Do they exist somewhere? -
Alexandre at 22:58 PM on 6 January 2011Graphs from the Zombie Wars
I've had my days of naively engaging in such Zombie Wars. It can be rather frustrating. Like others above, I've seen people declare themselves as "humble truth seekers", while actively tried to stay away from any explanation of the physics, just to move on to the next denier blog claim. Denier blogs, btw, are parroted without any questioning, while any evidence is dismissed as faulty, fraudulent, or just ignored for lack of understanding. I wonder how much of this attitude is responsible for the present mitigation policy paralysis. Is it important or just a loud stubborn ignorance of a few? -
tobyw at 22:55 PM on 6 January 2011Graphs from the Zombie Wars
Looks like two major up-legs with two minor down-legs to me - with perhaps a third down-leg beginning. http://www.skepticalscience.com/pics/CO2.png -
Anne-Marie Blackburn at 22:36 PM on 6 January 2011Understanding the CO2 lag in past climate change
Sorry, it should read 'This doesn't mean that CO2 cannot be responsible for current warming'. -
David Horton at 22:26 PM on 6 January 2011Graphs from the Zombie Wars
Tobyjoyce Miekol answers your question "I remain waiting to be convinced either way as regards whether or not CO2 produced by man is a problem. " You say "even the legendary Doubting Thomas had a bottom line. What is yours? " For deniers there is no bottom line. There is no evidence. No facts. No data. No physics. There is simply endless denial, because it bears no relationship to scientific enquiry. "Being a contrarian cannot be just an article of faith"? Being a contrarian is simply an article of faith. -
Anne-Marie Blackburn at 22:22 PM on 6 January 2011Understanding the CO2 lag in past climate change
gallopingcamel If you read my post again, you will see that the first sentence of the final paragraph states that CO2 did not initiate the shifts towards interglacials during the past 400,000 years. This does not mean that CO2 isn't responsible for current warming. Scientists are looking at current data and observations to draw their conclusions, not what may have happened in the past. -
macwithoutfries at 21:59 PM on 6 January 2011Graphs from the Zombie Wars
Very good stuff explained in very simple terms! Regarding the estimate on climate sensitivity to CO2 forcing - the resulting numbers have a better than 90% chance to be (far) too low - since the formula assumes that we have already reached the equilibrium point for the current forcing, but that is absolutely certain not the case and if today we would stop increasing CO2 we would still have 20-50 years before reaching the equilibrium point and at that point the calculated sensitivity could potentially be 2-3 times bigger! -
Bart Verheggen at 21:53 PM on 6 January 2011Graphs from the Zombie Wars
Althought the logarithmic relationship indeed doesn't impact this analysis very strongly, there are other issues with it: - Temperature responds to the net forcing, which is not necessarily equal to 'just' the CO2 forcing. The net climate forcing is only poorly known because of large uncertainties in aerosol forcing. (Aerosol forcing is close, but opposite in sign, to that of the other greenhouse gases, so accidentally the net forcing is close to the CO2 forcing, though with a very large uncertainty dominated by the aerosol effects.) - The climate hasn’t fully responded to the current climate forcing yet, as it takes time to equilibrate (mainly due to ocean thermal inertia). This reflects the warming in the pipeline. This means that the true sensitivity is very likely larger than the estimate you arrive at. Tom Fuller made a similar analysis a while ago (which he also presented at WUWT). See also http://ourchangingclimate.wordpress.com/2010/10/21/moving-the-debate-forward-tom-fullers-league-of-2-5/ -
Alec Cowan at 21:24 PM on 6 January 2011Understanding the CO2 lag in past climate change
@gallopingcamel #66 I hope your comment (original #24) will come back once is acknowledged that "how they say it" is as important as "what they (apparently) say", at least, in the social, educational and moral aspects. Bearing the last in mind I think the deletion of your post may be a lost. Then, speaking of fuzziness but back to the topic, your "other timescales" suggests you are speaking of past eons. But, could you be precise about the last couple of centuries? Are you trying other people to infer you are suggesting that '"subtle" rather than dominant' is the effect of CO2 additions nowadays? Provided the answer is yes, could you back such an assertion with proper quotations, links and sound science? -
MarkR at 21:19 PM on 6 January 2011Graphs from the Zombie Wars
#14 miekol: please read the SkS article on human CO2. The single dominating fact is that humans are pumping out ~30 bn tons/year and the amount in the atmosphere is going up by about ~15 bn tons/year (actually, by an average of 45% of human emissions rate, see Knorr's paper on atmospheric fraction). To say that the CO2 is coming from nature involves you inventing a magical way for 30 billion tons of human CO2 to disappear and nature to somehow pump out 15 bn tons on top of that. And we know that the oceans are absorbing CO2 since their pH is falling; and that's the main mechanism for CO2's shorter term temperature response... That the rise in CO2 is human caused is so close to certain that I can't understand how anyone who's had the time to check the evidence could conclude otherwise. -
malamuddy at 21:05 PM on 6 January 2011Graphs from the Zombie Wars
miekol at 14. #12 answers your question. Maybe you had not seen it when you posted. Your choice now is to thank Scaddenp for clearing up your problem, answer the question in that post or give a reasoned explanation of why it is unsatisfactory. To other posters: I have noticed that a common ploy among deniers is to pose as serious seekers of wisdom -"I genuinely would like to have such and such explained". But once that is done they revert to type, accusing others of not being scientific, denying what they have said elsewhere or opening up peripheral questions about the dictionary meaning of words. Far be it from me to assume that meikol is like this but, if he or she is not prepared to take up the options above, I would think future posts could be safely ignored -
tobyjoyce at 20:59 PM on 6 January 2011Graphs from the Zombie Wars
miekol, I have engaged in several on-line debates with people who have issued the challenge: "Ok, go on! Convince me about global warming! I'm open minded." In the end, I have realised that it really is a futile exercise. The discussions were an interminable "Well, what about ....?" or different versions of "Go fetch another rock". In the end, I realise the best we can do is to iterate and re-iterate the evidence. In the end, a person can only really convince themselves. If you are sincere, it is you who should be assimilating and evaluating the scientific consensus for your own benefit. Where is your own bottom line? Where do you see weaknesses in the case, and what will it mean if the global temperature anomaly rises for 1, 2, 3, 4 .... years more, Arctic sea ice extent continues to decline, glaciers continue to retreat ... etc. Most people who have trapped me into "debates" have just continued to iterate "Well, I'm not convinced!" at each presentation of new evidence. But, being a contrarian cannot be just an article of faith. If you are acquainted with the Bible, you know that even the legendary Doubting Thomas had a bottom line. What is yours? -
lurgee at 20:56 PM on 6 January 2011Graphs from the Zombie Wars
If we accept that CO2 is a significant GHG, then it follows that increasing its atmospheric concentrations to levels not seen in the last 400K years (or whatever) is likely to be a problem. If you're going to argue that CO2 isn't a significant GHG, then you have to do some pretty nimble scientific footwork, to explain how it behaves differently from other non-homogenous diatomic molecules. -
miekol at 20:29 PM on 6 January 2011Graphs from the Zombie Wars
Blibliovermis This is a science site, Which means accuracy in statements,as John would point out. I've not kept count of my posts but it probably numbers no more than 10 to 15, certainly not 100s. Also I have never used sarcasm, at least not as defined in an English dictionary. Unfortunately unwise but very clever people often credit me with knowledge and cleverness that I simply do not poses. I simply say it as I see it, but it gets interpreted as my being a smart ass. Just as its likely you will interpret this post as a 'smart ass,' retort. Its not, and its not meant be. I remain waiting to be convinced either way as regards whether or not CO2 produced by man is a problem.Moderator Response: [Daniel Bailey] Actually, you have posted here more than 40 times since July 29, 2010. You have continually expressed doubt about CO2 being a greenhouse gas and that it cannot be certain that CO2 plays a role in controlling temperatures in any way. The in-line responses to you have provided numerous links to allay your concerns; that you are still maintaining this fiction means that you have not read the links (done your homework) or you simply choose to continue to unbelieve. That is your choice. Do not, however, maintain that no one has tried to help you. -
fydijkstra at 20:24 PM on 6 January 2011Graphs from the Zombie Wars
I made similar calculations last year. Using the logarithmic relationship between CO2 and warming I estimated the climate sensitivity at 1.8±0.25 °C. See this graph. I do not speculate on positive or negative feedbacks, that might alter the shape of the curve. This picture also shows that the present halting of the warming still falls within the confidence limits of the trend. Only if the 1998 record will not be broken at a CO2-level of 440 ppm (probably in 2036) the relationship will be falsified, or if before 2020 the temperature drops below the 2008 level. There is still hope for humanity!
-
scaddenp at 20:13 PM on 6 January 2011Graphs from the Zombie Wars
meikol - the isotopic signature of the CO2 being added to the atmosphere shows it is from fossil sources whereas as the SLOW feedbacks from temperature rise would be biogenic. (eg the change in CO2 during glacial cycle as shown from isotopes in ice core gas bubbles). Can you postulate some physically reasonable mechanism by which temperature rise could increase fossil CO2 in atmosphere? I don't think there is any question that increased CO2 is anthropogenic - skeptic arguments have to hang off decreasing the effect of this. -
fydijkstra at 19:57 PM on 6 January 2011Graphs from the Zombie Wars
I don't feel the need to interfere in this discussion. Just a point to support tobyjoyce: Excel is very well able to use two Y-axis. You even don't need Excel 2007. My 2003 version does it perfectly, and as far as I remember, also the earlier versions. -
tobyjoyce at 19:27 PM on 6 January 2011Graphs from the Zombie Wars
Keith, Just a point on Excel. "Ideally, I would like to put two vertical scales in place so that each line could be scaled separately. But Excel won’t allow that" In Excel 2007, you can plot some of your series on a secondary axis for any chart type - that was only available before on a special chart. Would Excel 2007 have the application you were looking for? -
tobyjoyce at 19:22 PM on 6 January 2011Graphs from the Zombie Wars
Warming Power of CO2: Correlations Hi, Keith, could you take a quick look at this paper and give an opinion. A friend sent it to me ... it got a fuss made over it on Anthony Watts' site. The gist of it is (more or less): "A weak dominance of temperature changes precedence, relative to CO2 changes, indicate that the main effect is the CO2 increase in the atmosphere due to temperature rising. Decreasing temperature is not followed by CO2 decrease, which indicates a different route for the CO2 cap-ture by the oceans, not by gas re-absorption. Monthly changes have no correspondence as would be expected if the warming was an important absorption-radiation effect of the CO2 increase. The anthropogenic wasting of fossil fuel CO2 to the atmosphere shows no relation with the temperature changes even in an annual basis. The absence of immediate relation between CO2 and temperature is evidence that rising its mix ratio in the atmosphere will not imply more absorption and time residence of energy over the Earth surface." Another effort to disprove the greenhouse effect through statistics. -
Bibliovermis at 19:12 PM on 6 January 2011Graphs from the Zombie Wars
It has been possible to prove that the increasing atmospheric CO2 concentration is anthropogenic since Hans Suess conducted his research on carbon isotopes in 1955. wiki: Suess effect -
dansat at 19:10 PM on 6 January 2011Graphs from the Zombie Wars
Keith, Very good. I think Apple Numbers allows a double scale as well. I have started responding to certain myth claims on twitter with the link to the appropriate post on Skeptical Science. Saves a lot of time. Dan -
Bibliovermis at 19:00 PM on 6 January 2011Not So Cool Predictions
The same empirical evidence that shows that it's anthropogenic. Please refer to argument #33. Empirical evidence that humans are causing global warming -
Bibliovermis at 18:53 PM on 6 January 2011Graphs from the Zombie Wars
Miekol, Please refer to argument #26, both beginner & intermediate. Human CO2 is a tiny % of CO2 emissions Then move on to argument #33. There's no empirical evidence A quick search shows hundreds of comments over the past nine months asking the same questions or simply posting sarcasm. This belies your claim of being "willing to be convinced". -
perseus at 18:47 PM on 6 January 2011Graphs from the Zombie Wars
How bizarre! I've also been through exactly the same procedure with GISS a few months ago, paartiually to combat the zombies you mention. It makes no difference.
 I have been reluctant to publish it in full since we really should be using CO2e rather than CO2 which includes the other greenhouse gases. It is rather more difficult to obtain these figures despite repeated requests to various institutions, so if anyone can provide me with a source please post the URL.
-
Klaus Flemløse at 18:45 PM on 6 January 2011Graphs from the Zombie Wars
Very good. Thanks.
Prev 1978 1979 1980 1981 1982 1983 1984 1985 1986 1987 1988 1989 1990 1991 1992 1993 Next


