


 Arguments


Recent Comments
Prev 1993 1994 1995 1996 1997 1998 1999 2000 2001 2002 2003 2004 2005 2006 2007 2008 Next
Comments 100001 to 100050:
-
archiesteel at 06:56 AM on 12 January 2011Glaciers are growing
@Starnut, I suggest you read less airport literature and more actual science in order to form a valid opinion on climate science. -
Daniel Bailey at 06:39 AM on 12 January 2011Could global warming be caused by natural cycles?
My favorite sports broadcaster was Ernie Harwell from the Detroit Tigers. His favorite saying after a strike three call was "the batter just stood there like a house on the side of the road!" Skeptics think they have good reasons to believe in anything other than the science, but that leaves them unable to turn on the high fastball up in the zone and unable to hold up on the curveball in the dirt. Reminds me of this quote. The Yooper -
Understanding the CO2 lag in past climate change
apiratelooksat50 - I have posted a response on Is the Science settled?Moderator Response: Thank you for redirecting the discussion! -
The science isn't settled
apiratelooksat50 - Karl Popper's works have very little to directly do with the topic of CO2 lag. On the other hand, you appear to have raised the question of whether the science is settled. Let's look at the science. The planet is warming - Temperature records - Sea level rise - Arctic melting - Antarctic melting - Glacial retreat, Greenland melting - Crops and plants flowering earlier Hmm, plenty of evidence there. CO2 is causing the warming - Other forcings don't match recent warming - CO2 has enough of an effect, also here - Other causes can't explain it Looks like CO2. We're causing it - Isotopic evidence - Carbon cycle and emissions - Multiple lines of evidence What we have, apiratelooksat50, is multiple lines of evidence pointing in the same direction - towards human driven global warming. The only real uncertainties at this point are in regards to climate sensitivity - how much the temperature will go up based on our CO2 inputs. Our data indicates a minimum sensitivity to doubling CO2 of about 2.5°C (quite certain), with an upper limit of 4-5°C (nowhere near as certain, might be higher). Now, if you want to discuss uncertainty, I would recommend looking at the various, contradictory skeptical arguments. Hypotheses without evidence, or worse yet evidence contradicting them. Hypotheses that do not explain what we see. Those are uncertain. -
Daniel Bailey at 06:26 AM on 12 January 2011Seawater Equilibria
Re: Sphaerica (62) Bob, I've thought about it and my mind still keeps coming back to this one: http://www.realclimate.org/index.php/archives/2010/03/climate-change-commitments/. I know it's not as old as what you're looking for, but it matches my memory of things. Romm also discusses it here. Sorry if it's not the one (unless you mean Solomon et al 2008?). The YooperModerator Response: There is a followup: Climate Change Commitment II. -
Chris G at 06:22 AM on 12 January 2011Seawater Equilibria
Sphaerica #59, I remember an analogy used in 1st-year chemistry course that might be useful. Imagine there are tennis players on both sides of a court. Each player has a propensity for knocking balls across the net and that a higher concentration of balls means that it is easier for each player to put balls across the net. Imagine that instead of there only being one ball in the game, there are lots, and a player is free to hit any ball across the net. For any given amount of balls there are, after some time, an equilibrium will be established based on each players propensity to hit balls across. Now add or remove balls from one side, the concentrations of balls on both sides will come to a new balance point. There is no inherent balance point of the system; whatever balance point exists depends entirely on how many balls there are on the court and what each player's propensity for putting balls across is. In this case, balls are CO2 molecules and the propensity of the players is determined by the temperature of the sea and air. Higher temperatures give the ocean-based player a higher propensity for hitting balls across. Sorry for the overly simplistic analogy, but you seemed to be stuck on thinking that there was some set balance point, and there isn't. -
muoncounter at 05:55 AM on 12 January 2011Seawater Equilibria
#52: "If the Arctic ever is ice free ... " ... it will be too late to worry about CO2. Open Arctic water will absorb summer sun; all that evaporation will make for some lovely early winter NH snow. -
Chris G at 05:50 AM on 12 January 2011Seawater Equilibria
Sphaerica, #62, If you look under an ice sheet, you will find very little organic matter. In contast, regions with tundra and/or permafrost tend to have a lot of organic matter. The reason for this is that ice sheets flow from the center out. This flow scrapes the terrain underneath clean down to the rock. Also, in geologic time scales, the weathering of rock plays a large role in removing CO2 from the atmosphere. There is less weathering of rock under an ice sheet than there is when the rock is exposed to, umm, weather. -
muoncounter at 05:44 AM on 12 January 2011Could global warming be caused by natural cycles?
#22: "variations that match the details but never account for the warming." Sphaerica speaks wisely. Anyone who thinks it's just a natural cycle should be asked to explain this graph from an MWP thread: There is nothing natural about what happened in the last 100 years. Natural excursions prior to the last century have neither the magnitude nor the rate of change. Those natural cycles are just noise in the presence of the recent trend.
No amount of skeptical handwaving can make the contrast between recent temperatures and the 'natural cycles' go away.
Yooper (#25), I believe the expression is 'Well bowled, Sir!' Perhaps Albatross can let us Yanks know how to be so polite.
There is nothing natural about what happened in the last 100 years. Natural excursions prior to the last century have neither the magnitude nor the rate of change. Those natural cycles are just noise in the presence of the recent trend.
No amount of skeptical handwaving can make the contrast between recent temperatures and the 'natural cycles' go away.
Yooper (#25), I believe the expression is 'Well bowled, Sir!' Perhaps Albatross can let us Yanks know how to be so polite.
-
thepoodlebites at 05:36 AM on 12 January 2011It's the sun
The current trend in sunspot number Cycle 24 is under the projected trend. NASA's 2006 forecast was ~150. The current predicted maximum of 90, in May 2013, may need further revision downward. I am reminded of the Penn and Livingston 2006 paper that showed a linear decline in umbral magnetic flux, suggesting that a continued decrease below 1500G may result in sunspots disappearing altogether.Moderator Response: So what? That's not relevant to the point of this post, which is a rebuttal of the skeptic argument that increase in the Sun's irradiation of the Earth is what has and is causing the Earth's temperature rise since about 1850. -
Chris G at 05:33 AM on 12 January 2011Seawater Equilibria
TOP #51, #52, Yes, you are missing that the main point of the post is not that the oceans are not getting warmer, it is that they patently have not gotten warmer enough to support any claim that the additional CO2 in the atmosphere has the ocean as a source. Also, you are missing that the main reason that there is less Arctic ice is that the ocean is warming. A relatively warmer ocean will loose heat more rapidly than a cooler ocean, but the ocean is warming because it is receiving more energy. Receiving more energy will _not_ result in a cooling. -
Albatross at 05:13 AM on 12 January 2011Could global warming be caused by natural cycles?
Daniel @25, Quite remarkably, cruzn246 somehow just managed to get an edge and caught behind, get bowled and then stumped ;) Everyone on the pitch is aghast... -
Daniel Bailey at 05:05 AM on 12 January 2011Could global warming be caused by natural cycles?
Re: cruzn246 (23)"When the PDO goes negative for a time more ice and snow build over the N hemisphere."
Apparently you didn't read the post: PDO has NO long-term trend. Strike one."That forgotten greenhouse gas that we still can't properly quantify worldwide, either presently or historically"
Oh-so wrong. Very well studied, quantified and understood. Strike two."unless some big old volcano blows up. Then we could get some major cooling"
Anthopogenic-derived CO2 releases amount to 100X that of all of the world's volcanoes combined. Humans breath out 10X as much CO2 as those selfsame volcanoes do (but that human CO2 is part of the closed carbon cycle, unlike fossil fuel CO2). Anyway, volcanic cooling imposed on the globe is transient, unlike the documented effects of CO2. That's strike three, you're out. Next batter... (BTW, it's "Milankovitch") The Yooper -
robert way at 04:55 AM on 12 January 2011Could global warming be caused by natural cycles?
Sphaerica, I certainly understand the point of the post and I am just as much an AGW proponent as the next person. I just didn't think it was the appropriate way to graph those items because it makes clear synchronous behavior not be so apparent. The same can be said of divergences. Putting them on a similar scale which considers their standard deviation is probably the best manner or putting dual axis. I acknowledge that cycles are not necessarily causing the trend but I think it is important to acknowledge that some cycles contribute to it at times and hide it at times. -
cruzn246 at 04:44 AM on 12 January 2011Could global warming be caused by natural cycles?
"ENSO (El Nino Southern Oscillation) and PDO (Pacific Decadal Oscillation) help to explain short-term variations, but have no long-term trend, warming or otherwise. Additionally, these cycles simply move thermal energy between the ocean and the atmosphere, and do not change the energy balance of the Earth." Of course they don't do it by themselves. Think of the effect they cause though. When the PDO goes negative for a time more ice and snow build over the N hemisphere. What happens then? More energy is reflected away; Less water vapor is in the air. (That forgotten greenhouse gas that we still can't properly quantify worldwide, either presently or historically) I still think we are in a warming cycle. Sure Milanovich is important, but there is a heck of a lot of variability in when the ice ages trip into motion within that cycle. When it does it is sudden. In fact Milanovich may just be coincidental rather than causative when it comes to Ice Ages. No one has ever come out and proven Milanovich causes the Ice Age cycle. I think it is all about when sea levels rise high enough to really upset the important ocean circulations that allow us to stay warm. Until then, we will probably have basically neutral periods followed by warming periods, unless some big old volcano blows up. Then we could get some major cooling. JMO, but there are good reasons to think this way.Moderator Response: [Daniel Bailey] See my response to you at comment 25 below. -
apiratelooksat50 at 04:09 AM on 12 January 2011Understanding the CO2 lag in past climate change
1. It is easy to obtain confirmations, or verifications, for nearly every theory — if we look for confirmations. 2. Confirmations should count only if they are the result of risky predictions; that is to say, if, unenlightened by the theory in question, we should have expected an event which was incompatible with the theory — an event which would have refuted the theory. 3. Every "good" scientific theory is a prohibition: it forbids certain things to happen. The more a theory forbids, the better it is. 4. A theory which is not refutable by any conceivable event is non-scientific. Irrefutability is not a virtue of a theory (as people often think) but a vice. 5. Every genuine test of a theory is an attempt to falsify it, or to refute it. Testability is falsifiability; but there are degrees of testability: some theories are more testable, more exposed to refutation, than others; they take, as it were, greater risks. 6. Confirming evidence should not count except when it is the result of a genuine test of the theory; and this means that it can be presented as a serious but unsuccessful attempt to falsify the theory. 7. Some genuinely testable theories, when found to be false, are still upheld by their admirers — for example by introducing ad hoc some auxiliary assumption, or by reinterpreting the theory ad hoc in such a way that it escapes refutation. Such a procedure is always possible, but it rescues the theory from refutation only at the price of destroying, or at least lowering, its scientific status. Karl Popper, "Conjectures and Refutations", 1963Moderator Response: This belongs on the thread "The Science Isn't Settled." Anyone who wants to tespond, do so there. Responses here will be deleted. -
Albatross at 03:56 AM on 12 January 2011Not So Cool Predictions
Daniel, Thanks for this. Yes, the numbers between the different data sets differ, and significantly so. Perplexing. It seems to me that part of the problem that is complicating matters is that there is not, to my knowledge, a universal standard to define deaths arising from extreme heat or cold. In England they seem to use a residual-type method and that gives really high numbers-- I do not like their method at all. Anyways, according to NOAA, between 1996 and 2009 there were 1957 heat related deaths in the USA (avg. 140), compared to only 357 for cold. So heat is still a bigger killer than is cold in the USA, at least for these data and for this time period. I excluded 1996, b/c it is an outlier, that year alone heat killed 1021 people. As George Monbiot pointed out recently, how the population deals with the cold depends on where you are on the planet and the local infrastructure. Temperatures near zero C in northern India and a hundred die. Near zero C in Thunder Bay in winter and some people are actually wearing T-shirts. The fact remains though that heat waves kill people in droves, especially in areas not accustomed to extreme heat. Witness the 2003 European heat wave (tens of thousands died), the Russian heat wave (again thousands died, although numbers are not easy to get from the Russians except that Moscow's mortality rate doubled during the heat wave). I find the argument "well cold kills too" to dismiss the increase in deaths (and misery) from heat stress as the frequency of heat waves ramps up in the future (as the planet continues to warm) a very weak one. On the up side, we can hope that there will likely be a decrease in cold weather -related mortality as the planet warms.Moderator Response: [Daniel Bailey] It was like, over on the Twice As Much Canada thread, when skeptics introduced the Christidis et al study as if it proved their point about extreme cold being more dangerous than extreme heat. Of couse, the Christidis et al study said no such thing (other than that human adaptation to extreme cold was better than human adaptation to extreme heat). Skeptics fail to take into account the dark side of extreme heat, wet-bulb temperature tolerability. -
Bob Lacatena at 03:54 AM on 12 January 2011Could global warming be caused by natural cycles?
21, Robert Way, I'm not sure what you think that "standardizing" (when measuring two different things with different units of measure there is no standard) would do, but based on your comment about AMO and temperature for 1878, 1998 and 2010, you do seem to have missed the point. Certainly any of these observations will have oscillations that match the details (shape) of the temperature line, but not the trend. It is very clear that there is an upward trend in temperature, and no such upward trend in any of the other variables. You can mix and match them all you want, and yes, you can come up with variations that match the details but never account for the warming. -
robert way at 03:40 AM on 12 January 2011Could global warming be caused by natural cycles?
Keith, I don't really agree with your plotting there actually. It doesn't show the magnitude of the cycles. You should standardize them and put them on the same axis or something of the sort. You have to remember that 1 unit in one variable could be equal to 3 in another. Plus if you look closely at your temp/AMO graph you will see something very prominent... i.e. spikes in the AMO and temperature in 1878(eyeballing it) 1998 and 2010 which follow synchronously. Standardization can be done in excel with the standardize feature. use x-min/stdev -
Karamanski at 03:31 AM on 12 January 2011It's a natural cycle
From what I hear from people in everyday life and what I see on conservative news outlets and skeptical blogs, "it's a natural cycle should be near the top of the list of skeptic arguments. -
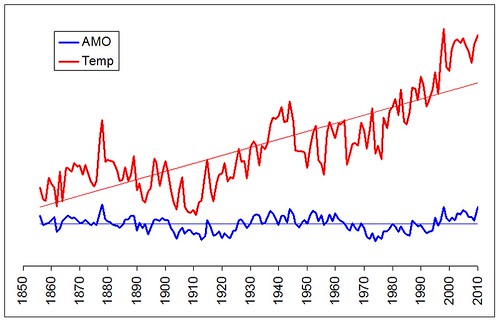
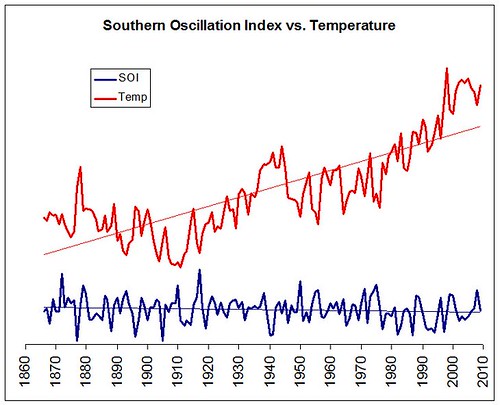
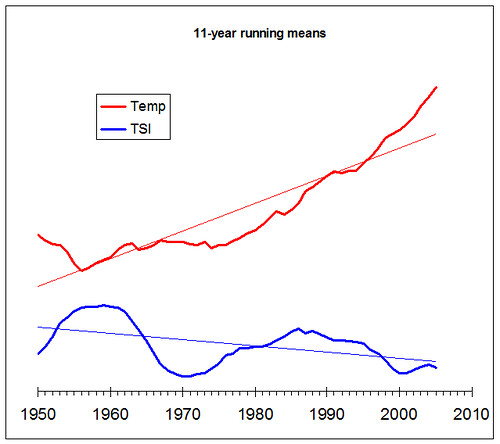
keithpickering at 03:23 AM on 12 January 2011Could global warming be caused by natural cycles?
Just to be clear: AO = Arctic Oscillation AMO = Atlantic Decadal Oscillation SOI = Southern Oscillation Index (El Niño) TSI = Total Solar Irradiance -
keithpickering at 03:20 AM on 12 January 2011Could global warming be caused by natural cycles?
Nice job, and this has the makings for a new entry in the argument list. Allow me to post a few more graphs from the zombie wars here: Temp vs. AO: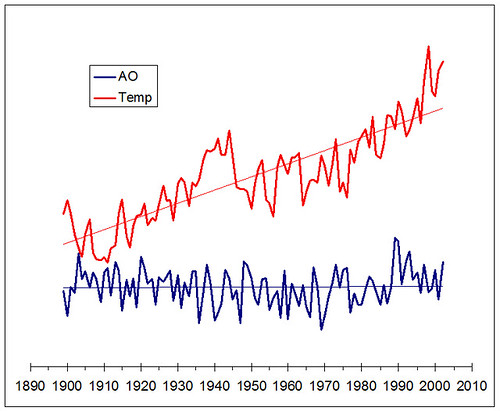 Temp vs. AMO:
 Temp vs. SOI:
 Temp vs. TSI (since 1950):
-
Albatross at 02:56 AM on 12 January 2011Could global warming be caused by natural cycles?
Kate, excellent job! Thank you for this. Would it be possible to add a Figure? For example, below is Fig.3 from Swanson et al. (2009, PNAS). Solid, bold line = Observed GISS 21-year running mean global mean surface temperature; thin solid = quadratic fit to the observed 20th century global mean temperature; dashed line = that temperature cleaned of the internal signal. I'd like to highlight some key points that you make:
"However, internal forces do not cause climate change. Appreciable changes in climate are the result of changes in the energy balance of the Earth, which requires "external" forcings, such as changes in solar output, albedo, and atmospheric greenhouse gases."
And
"However, the amplitude of the cycles simply can't explain the observed temperature change. Internal variability has always been superimposed on top of global surface temperature trends, but the magnitude....of current warming clearly indicates that anthropogenic greenhouse gases are the dominant factor."
I highly recommend people read Swanson et al. (2009), who used an ensemble of 10 models (with coupled ocean-atmosphere dynamics) to study the long-term natural variability over the duration oft the global surface air temperature (GSAT) record. This is what they found:
"Variability associated with these latter processes, generally referred to as natural long-term climate variability, arises primarily from changes in oceanic circulation. Here we present a technique that objectively identifies the component of inter-decadal global mean surface temperature attributable to natural long-term climate variability. Removal of that hidden variability from the actual observed global mean surface temperature record delineates the externally forced climate signal, which is monotonic, accelerating warming during the 20th century."
And
"The monotonic increase of the cleaned global temperature throughout the 20th century suggests increasing greenhouse gas forcing more-or-less consistently dominating sulfate aerosol forcing, although our technique cannot exclude other mechanisms not contained in the current generation of model forcing."
So what we most likely have are warming and cooling cycles/oscillations from internal climate modes superimposed on a long-term, monotonically increasing warming from the increasing radiative forcing of GHGs.
I'd like to highlight some key points that you make:
"However, internal forces do not cause climate change. Appreciable changes in climate are the result of changes in the energy balance of the Earth, which requires "external" forcings, such as changes in solar output, albedo, and atmospheric greenhouse gases."
And
"However, the amplitude of the cycles simply can't explain the observed temperature change. Internal variability has always been superimposed on top of global surface temperature trends, but the magnitude....of current warming clearly indicates that anthropogenic greenhouse gases are the dominant factor."
I highly recommend people read Swanson et al. (2009), who used an ensemble of 10 models (with coupled ocean-atmosphere dynamics) to study the long-term natural variability over the duration oft the global surface air temperature (GSAT) record. This is what they found:
"Variability associated with these latter processes, generally referred to as natural long-term climate variability, arises primarily from changes in oceanic circulation. Here we present a technique that objectively identifies the component of inter-decadal global mean surface temperature attributable to natural long-term climate variability. Removal of that hidden variability from the actual observed global mean surface temperature record delineates the externally forced climate signal, which is monotonic, accelerating warming during the 20th century."
And
"The monotonic increase of the cleaned global temperature throughout the 20th century suggests increasing greenhouse gas forcing more-or-less consistently dominating sulfate aerosol forcing, although our technique cannot exclude other mechanisms not contained in the current generation of model forcing."
So what we most likely have are warming and cooling cycles/oscillations from internal climate modes superimposed on a long-term, monotonically increasing warming from the increasing radiative forcing of GHGs.
-
JMurphy at 02:53 AM on 12 January 2011Glaciers are growing
Starnut, can you give a reference for the number of glaciers you state ? While doing that, please read the following study : International glacier monitoring has produced a range of unprecedented data compilations including some 36000 length change observations and roughly 3400 mass balance measurements for approximately 1800 and 230 glaciers, respectively. The observation series are drawn from around the globe; however, there is a strong bias towards the Northern Hemisphere and Europe. A first attempt to compile a world glacier inventory was made in the 1970s based mainly on aerial photographs and maps. It has resulted to date in a detailed inventory of more than 100000 glaciers covering an area of about 240000 km2 and in preliminary estimates, for the remaining ice cover of some 445000 km2 for the second half of the 20th century. This inventory task continues through the present day, based mainly on satellite images. WGMS. 2008. Global Glacier Changes: facts and figures. Zemp, M., Roer, I., Kääb, A., Hoelzle, M., Paul, F. and W. Haeberli (eds.), UNEP, World Glacier Monitoring Service, Zurich, Switzerland -
Bob Lacatena at 02:46 AM on 12 January 2011Seawater Equilibria
60, boba10960, You said:In addition, the regrowth of the terrestrial biosphere in response to retreating ice sheets should have lowered the CO2 content of the atmosphere as well.
I would have expected this to perhaps be the opposite... that during the change into a glacial period, expanding ice sheets would cover a fair amount of vegetation before it has a chance to decay and return to the atmosphere as CO2, and so the subsequent retreat of the ice sheets when moving to an interglacial would expose this carbon and "release" it to the atmosphere (where it would again be used in the constant growth/decay life cycle). -
Miriam O'Brien (Sou) at 02:34 AM on 12 January 2011Could global warming be caused by natural cycles?
OT but don't know where else to ask. Is John Cook and family okay given the floods? My best wishes to all in Queensland. Our thoughts are with you.Response: [John Cook] Thanks for asking. Although low lying parts of the next suburb are being evacuated, we seem to be okay where we are. Our area is a bit higher than surrounding regions which have flooded. So it's hard to imagine us being flooded. But then it's also hard to imagine an inland tsunami picking up houses with people inside them and carrying them across town which happened earlier this week. So we're keeping a careful eye on things.
Appreciate your thoughts :-) -
thepoodlebites at 02:31 AM on 12 January 2011Ice age predicted in the 70s
muoncounter, Re:PDO; "So you are claiming that correlation requires causality? Did you run that past the denial establishment to see if they reached a consensus on that?" Is this post not inflammatory? Shouldn't all inflammatory comments be pulled? Some comments are more inflammatory than others I suppose. -
hfranzen at 02:29 AM on 12 January 2011The Physical Chemistry of Carbon Dioxide Absorption
Response to #47. Excellent questions. 1.I have not accounted for water vapor overlap. Since the absorptions are basically lines in the spectrum (a quantum mechanical effect -see the specrum from the astrophysics group at Ohio State in GWPPT6) it is only the occasional overlap that will have an effect and that to reduce the absorption by CO2 slightly. My guess is that this would result in less than a 10% reduction in the absorption and a far lesser effecct in the change in absorption with increasing CO2 ppm. Since my earth-year temperature increase result fits very well with what is actually observed (see #25 above) I am quite certain that overlap is not serious problem and what GWPPT6 shows is the basic thrust of what is occurring. 2.The increase that I am calculating comes directly from the increase in the broad-band diffuse transmissivity as a result of the increase in the ppm of CO2. The latter is measured by the Keeling curve. The former results directly from the physics of GWPPT6 generalizing Beer's Law from s linear absorption of intensity to a broad-band, diffuse abosrption of flux. I input nothing that is not calculated or observed. 3.Clarification: The absorption is a process in which carbon dioxide is excited from some rotational level in the ground vibrational state to some rotational level in the first excited vibrational state. The short explanation of the fact that half is returmed to the earth is: absorbed radiation is then reemitted through any of a number of processes and this emission is in all directions, i.e. half up and half down. Thus half the reemitted absorbed radiation returns to the earth as GHG flux. A slightly longer explanation of the reemission follows. Once this excitation has occurred the molecule either relaxes to the ground state or, more frequently, gives up the energy to the translational motion of another molecule (e.g. nitrogen) through collision. In the more probable collisional dectivation case this energy then becomes part of the thermal bath in which the molcules reside, in other words the atmosphere is locally heated above its steady state temperature. This excess bath energy is then lost through any of a myriad of collisional processes, say with the ubiquitous water molecules. This excitation is then lost through emission. In either case - direct emission or collisional deactivation follwed by remission from some other infrared active molecule the remmission is isottropic, i.e. nondirectional, and thus occurs with equal probability up or down. -
Daniel Bailey at 02:28 AM on 12 January 2011Seawater Equilibria
Starting to drift off-topic, but this has some bearing on the current focus of the discussion: Gas escape features off New Zealand: Evidence of massive release of methane from hydrates GEOPHYSICAL RESEARCH LETTERS, VOL. 37, L21309, 5 PP., 2010 doi:10.1029/2010GL045184 "Evidence that massive quantities of methane gas have been released from the sea floor during past ice ages has been reported. The discovery supports the hypothesis that huge releases of ocean methane contributed to the rapid warmings of the Earth that have ended past ice ages." As reported in Reporting Climate Science .Com. Free PDF here. Adds a bit of credence to the clathrate-gun hypothesis. Must've been a bumpy ride. The Yooper -
boba10960 at 02:12 AM on 12 January 2011Seawater Equilibria
59, Sphaerica You are correct. If there was a temporary change in physical processes at the end of the last ice age that caused the ocean to release CO2 to the atmosphere, and if that physical forcing came to an end, then one would expect the ocean to reabsorb some of the CO2 that had been released. In addition, the regrowth of the terrestrial biosphere in response to retreating ice sheets should have lowered the CO2 content of the atmosphere as well. The ice core records show that CO2 levels did fall slightly between roughly 10,000 and 8,000 years ago before they began slowly rising again. These back and forth trends illustrate the complexity of the multiple processes that affect atmospheric CO2. These processes are still subjects for ongoing research, but two things are clear: 1) The physical forcing that helps release CO2 from the deep ocean has not returned to the conditions that existed during the last ice age, and 2) The alkalinity of seawater (related to the negative ion balance referred to by Dr. Franzen) has changed since the end of the last ice age as well, in a way that keeps atmospheric CO2 high when other processes are tending to bring it down. We know that ocean alkalinity has changed because the dissolution of microscopic calcium carbonate shells that settle onto the deep ocean floor has been increasing steadily over the past several thousand years. That is, water in the deep ocean has become more acidic, and corrosive to calcium carbonate, reflecting the change in alkalinity. This change in seawater chemistry was recognized more than two decades ago, but the cause is still a matter of debate and ongoing research. I favor the hypothesis that the growth of coral reefs, and the burial of calcium carbonate on continental shelves, following the final rise of sea level has been a major factor lowering the alkalinity of the oceans (formation of calcium carbonate shells by organisms removes alkalinity from seawater), but not everyone agrees with this hypothesis. Whatever the cause, lowering the alkalinity of ocean water drives the chemical equilibria described by Dr. Franzen in the direction of converting carbonate ion and bicarbonate ion into dissolved aqueous CO2, which may then escape to the atmosphere. Undoubtedly, this partially offsets any tendency for the ocean to reabsorb CO2. -
DSL at 01:54 AM on 12 January 2011Glaciers are growing
Starnut: Yawn. You're going to trust Crichton but not climate science. Lovely. Don't you think it's odd that someone would write a novel trying to scare people about a project designed to scare people? Where did you get that "over 100,000 glaciers" number, btw? And you don't think that monitoring, say, 10 glaciers in 10 different areas of the world will give us useful data? Or you think that these particular glaciers in the WGMS have been carefully selected by scientists who are in on the hoax? Also, what's a "short-term climate model"? Climate is 30 years, according to climatologists. Finally, speaking of zombies, the science of climate is, by most measures, about 150 years old. The basic radiative physics of CO2 have been established for about that long as well. It's established science. The remaining questions we have are mainly about ocean heating and and cloud effects. -
thepoodlebites at 01:50 AM on 12 January 2011Ice age predicted in the 70s
I've tried to post replies but my posts are being pulled. What's the point of continuing the discussion when only one side is being represented? The posts concening my college experiences is true. Why do you question my veracity and censor my replies?Moderator Response: [Daniel Bailey] I see only one deleted comment. That comment was deleted as it contained an inflammatory comment about another poster here on Skeptical Science. Keep the dialogue on the science and on the subject matter of the post (being off-topic is a prime reason comments get pulled) and all will be well. -
ProfMandia at 01:38 AM on 12 January 2011Could global warming be caused by natural cycles?
Well done, Kate. -
Starnut at 01:38 AM on 12 January 2011Glaciers are growing
I checked the WGMS and their data is from 100 monitored glaciers. Since there are over 100,000 glaciers world wide this can lead to an entierely new discussion on how or why these were chosen. Trying to figure out the science of climate is still in its infancy and so many things are based on simulations that are based on limited data and potentially flawed assumptions that what impact an additional 100 - 200 ppm of CO2 is doing to the world is truly just a guess for now. When short term climate models(3-5 year) are consistently correct then we can start looking at longer term modeling systems. I don't doubt we need to be better shepards of our planet, but the only way to not impact the planet is to not be on the planet and that is not going to happen (at least any time soon regardles of any zombie movies you may watch). An interesting fiction novel to read is by Michael Chrichton - STATE OF FEAR. He makes many interesting points on the science and politics of Global Warming and Climate Change. While it is fiction, he does add many true facts to the story line. -
Bob Lacatena at 01:22 AM on 12 January 2011Seawater Equilibria
56, boba10960, One thing nags at me. Ultimately, the ocean-atmosphere interface is a "rate of reaction" situation with a balance (which can then be altered by temperature, partial pressure, and other factors, such as acidity and the biological pump to which you refer). So if the ocean temperature change was insufficient to alter CO2 enough to account for the rise in CO2, but some other event injected CO2 into the atmosphere, would that not have put things out of balance and caused the ocean to begin to absorb CO2 to try to restore the balance? Shouldn't CO2 levels have fallen after such an event, or the ocean subsequently warmed enough to balance things (which you are saying clearly didn't happen)? Are we now in an environment where CO2 levels should be naturally falling (slowly reabsorbed by the ocean) even prior to the next orbital shifts towards a glacial period? Something in this doesn't make sense to me. -
Bob Lacatena at 00:44 AM on 12 January 2011Seawater Equilibria
56, boba10960, Thank you. I've only skimmed it so far, but it looks like a fascinating paper, and an important set of details in understanding past events. -
muoncounter at 00:41 AM on 12 January 2011It's not us
#16: "the total Earth weather system(s) has only studied intensively for 40 years compared" Wow. Aside from being factually incorrect (weather and indeed climate science is more than 40 years old): We've only gone into space since the '60s, not even a mere 50 years. So by your illogic, we cannot know anything about what happened before we went into space? However, moon rocks are much older than even '30+ million years' (try 3.5 Byears). We study those moon rocks, as we study signals in the universe that are almost as old as the universe itself! Please, for your own self-respect if nothing else, stop making statements things like that. -
Miriam O'Brien (Sou) at 00:05 AM on 12 January 2011Could global warming be caused by natural cycles?
This 'it's a natural cycle' argument is one of my pet annoyances. Thanks for the post - it's clear and concise and should be obvious to all, but obviously some still have some trouble in understanding the basics. Now if someone said the rising temperature trend and other changes (eg ocean acidification etc) are 'a natural response' to all the CO2 waste we're dumping into the atmosphere, that would sit very well with me. @ skywatcher #9 - I suspected the Tisdale article was just another variation of McLean's 'I'll just remove the temperature increase to show there is no temperature increase' trick! I wasn't prepared to wade through the tortuous post in detail, but it looked that way when I skimmed it. Thanks for the confirmation. -
dorlomin at 23:53 PM on 11 January 2011Could global warming be caused by natural cycles?
Philip64 at 19:58 PM on 11 January, 2011 "Climate changes 'naturally'; so it's nothing to worry about." Forests burn naturaly, yet we still worry about human caused forest fires. -
sime at 23:52 PM on 11 January 2011Seawater Equilibria
- Alexandre @ 23 "Gish gallop. I did not know this expression. Very descriptive." "A key technique that denialists use in debates, dubbed by Eugenie Scott the “Gish gallop”, named after a master of the style, anti-evolutionist Duane Gish. The Gish gallop raises a barrage of obscure and marginal facts and fabrications that appear at first glance to cast doubt on the entire edifice under attack, but which on closer examination do no such thing." - Real Climate As in Mr Pilmer does the "Gish Gallop"... http://scienceblogs.com/deltoid/2009/04/plimer_does_the_gish_gallop.php -
dorlomin at 23:51 PM on 11 January 2011Could global warming be caused by natural cycles?
@ScienceofDoom at 21:28 PM on 11 January, 2011: We know sea level is rising. While some of this comes from groundwater sources being discharged and some from glacial\ ice sheet melt, much\ most of it is from thermal expansion. This indicates to me the ocean is accumulating energy. If the oceans were losing energy to the atmosphere they would not be undergoing thermal expansion. We cannot answer all the questions yet, but we can put boundries on the uncertainties. Any hypothised mechanism must be within these boundries. If a natural cycle is part of the solution, where is the energy entering the atmosphere coming from? "That's why this article seems like an over-simplification of the problem." As it is only the intermediate answer I suspect the simplification is deliberate, though I would leave that answer ultimately to the author. -
boba10960 at 23:14 PM on 11 January 2011Seawater Equilibria
Martin #16, Sphaerica #39 and keithpickering #54 Although Dr. Franzen is mainly referring to shorter time scales, the principles he describes apply to the end of the last ice age as well. The average ocean temperature (mainly deep ocean) warmed by about 3 degrees C with the end of the ice age. The exact warming is still debated, but it is not nearly large enough to account for the entire rise in CO2 (see above posts). At least three factors contributed to lower CO2 during the last ice age: 1) A colder ocean absorbed more CO2, 2) The biological pump was more efficient than today, transferring more carbon from the atmosphere to the deep ocean, and 3) The ocean's alkalinity (the negative charge that Dr. Franzen refers to) was greater than today. Furthermore, the efficiency of the biological pump depends on both the rate of biological processes that transfer carbon from the atmosphere to the deep ocean, and on the rate of physical processes that mix CO2 from the deep ocean back up to the surface where it can be vented to the atmosphere. These factors are interrelated in complex ways, and it is the complexity of these interactions that has made it so difficult for scientists to unravel the exact suite of processes responsible for glacial-interglacial changes in atmospheric CO2. The sequence of events at the end of the last ice age was summarized by G. H. Denton, et al., The Last Glacial Termination, Science 328, 1652 (2010): 1) Around 21,000 years ago changes in Earth's orbit (seasonality of solar insolation) started to melt the northern hemisphere ice sheets. 2) Around 18,000 years ago the amount of freshwater entering the North Atlantic Ocean due to melting ice became so large that it severely perturbed deepwater formation and global meridional temperature gradients. Note the timing here: The first signs of warming in Antarctic ice cores occurred at 18,000 years ago, long after ice started melting in the northern hemisphere, and coincident with the severe perturbation in the North Atlantic. There is general consensus among paleoclimatologists on these first two points. What happened next is the subject of substantial disagreement. One view is that a change in deep ocean mixing, around 18,000 years ago, caused by all of the meltwater flowing into the North Atlantic, vented CO2 from the deep ocean and also helped to warm Antarctica (D. M. Sigman, et al., The polar ocean and glacial cycles in atmospheric CO2 concentration, Nature 2010, 47 (2010)). The alternative view is that the change in global temperature gradients, around 18,000 years ago, triggered by all of the meltwater flowing into the North Atlantic, perturbed atmospheric wind patterns in a way that both warmed Antarctica and released CO2 from the deep ocean, a process that takes place mainly around Antarctica (R. F. Anderson et al., Wind-driven upwelling in the Southern Ocean and the deglacial rise in atmospheric CO2. Science 323, 1443, (2009)). Which ever view proves to be correct, the end of the ice age was triggered by a change in Earth's orbit that started melting northern hemisphere ice sheets. Some thousands of years later, the meltwater entering the North Atlantic Ocean perturbed ocean and atmosphere physics in a way that caused CO2 to be released from the deep sea - mainly by an increase in physical mixing that reduced the efficiency of the biological pump. Although the warming that lowered the solubility of CO2 in the ocean cannot be neglected, it had less impact on atmospheric CO2 than was caused by the change in ocean mixing. -
Eric (skeptic) at 23:00 PM on 11 January 2011Could global warming be caused by natural cycles?
My explanation of variations in warming is that variable natural factors amplify or delay warming. The warming from increased CO2 is steady but there are two primary natural factors involved: variable storage of heat in the ocean (correlates with ENSO pretty well) and variable amplification of warming (correlates with AO pretty well). The Erl Happ article at WUWT postulates AO levelling off and going negative. Whether it does remains to be seen, but a more negative AO will lead to less amplification and perhaps cooling if it continues. -
archiesteel at 22:55 PM on 11 January 2011It's not us
@cloa513: "You can't average temperature readings" Sure you can. -
kondra at 22:39 PM on 11 January 2011Could global warming be caused by natural cycles?
To those who offer the Singer/Avery "Unstoppable Global Warming: Every 1500 Years" arguments, you might ask whether, every 1500 years, the world's population discovers and exploits vast reserves of petroleum and whether, every 1500 years, that population reaches six billion. -
Marcus at 22:30 PM on 11 January 2011Could global warming be caused by natural cycles?
A combination of what things, HumanityRules? I've yet to see any of the contrarians come up with a decent explanation of what-other than CO2-might be causing the last 60 years of warming (the period during which CO2 emissions rose at the fastest rate). Basic Physics tells us that CO2 molecules help to trap Infrared Radiation, & its this radiation that causes an overall warming of the planet. That's basic physics, HR, no matter how much you try & skirt around it. Also, if PDO & Incident Solar Radiation have both been trending downwards for the last 30 years, then why is that period of warming more rapid than the period of 1950-1980? -
boba10960 at 22:19 PM on 11 January 2011Seawater Equilibria
Tom Curtis #46 and as quoted by muoncounter #50 Two quick comments: 1) The CO2 sensitivity values I have seen are substantially smaller than that attributed to Bacastrow; more like 7 or 8 ppm increase in atmospheric CO2 per degree of ocean warming than 12 ppm. 2) More important, the correct sensitivity is not to SST (sea surface temperature, which encompasses only the upper few tens of meters of ocean depth), but rather to the change in average average temperature of the entire ocean (the average depth of the ocean is 3800 m). Whether the correct sensitivity is 7 ppm/degree or 12 ppm/degree, it is necessary to warm the entire ocean to gain this effect. Most of the deep ocean, e.g., below 1000 m, has not warmed significantly since the beginning of the industrial period. Consequently, since most of the volume of the ocean has not warmed historically, and the surface ocean has warmed on average less than 1 degree C, warming of the ocean cannot have contributed significantly to the recent rise in atmospheric CO2 (approx. 100 ppm). (Just a different way of agreeing with the original post of Dr. Franzen.) -
skywatcher at 21:51 PM on 11 January 2011Could global warming be caused by natural cycles?
It's well worth understanding what Bob Tisdale did in the post you link to macwithoutfries. He took a long time and a lot of figures to identify two small regions on the globe (one north and one south) on either side of the ENSO region, that most neatly encapsulate the progressive warming trend of his two larger regions. Once you subtract the progressive warming trend in both... surprise surprise the warming trend mostly disappears! The 'trick' he uses to 'hide the incline' is to pretend that the two smaller regions are oscillating in relation to some part of ENSO when in fact they are progressively warming with superimposed oscillations. He does not tell his reader why these two small regions show the warming trend. No real surprise that the overall anthropogenic warming with superimposed ENSO/La Nina-like oscillations happens to look a lot like the warming of the tropics and mid-latitudes, and so when you subtract one from another you end up with no trend. It is simply a cleverer way of doing the same thing McLean et al were guilty of last year. What we learn from Bob Tisdale: 1: The tropical oceans show a strong ENSO signature. 2: Subtropical/midlatitude oceans are dominantly progressively warming, with overlain pulses of heating/cooling influenced by heat originating from ENSO. Ah wait.. we knew that already. Do we learn what is causing the progressive warming (and of course the Arctic amplification)? Of course not! Do we learn how this fits in with other fingerprints of warming? Of course not... -
ScienceofDoom at 21:28 PM on 11 January 2011Could global warming be caused by natural cycles?
I was quite struck reading Trenberth's 2009 paper, "An imperative for climate change planning: tracking Earth’s global energy". For example: "It is not a sufficient explanation to say that a cool year is due to natural variability. Similarly, common arguments of skeptics that the late 20th century warming is a recovery from the Little Ice Age or has other natural origins are inadequate as they do not provide the physical mechanisms involved. There must be a physical explanation, whether natural or anthropogenic." I recommend people read the whole paper because he points out that currently we can't actually total up the elements of the global heat budget to say why a given year is cooler or hotter. That's why this article seems like an over-simplification of the problem. As a relevant digression, I've read a lot of papers on the ice ages. There are lots of theories to do with Milankovitch cycles. But many Milankovitch theories cancel out many other Milankovitch theories because they are contradictory. Perhaps one is correct. To say we know and understand what causes temperature variations seems like something that needs demonstrating. I invite the writer to list the ocean heat changes for each year over the last 10 years and then match up the changes in albedo, OLR, ocean temperature with ocean heat content along with an explanation that links them together. Perhaps it is clear - I would really look forward to seeing the article. I did write an article some time ago about Trenberth's paper but from a different direction - Is climate more than weather? Is weather just noise? -
Philip64 at 19:58 PM on 11 January 2011Could global warming be caused by natural cycles?
Excellent piece. The 'natural cycles' argument is the one that is usually inferred, if not directly evoked, every time skeptics mention the Vikings, the Medieval Warm Period etc. Climate changes 'naturally'; so it's nothing to worry about. Makes you want to pull your hair out ...!
Prev 1993 1994 1995 1996 1997 1998 1999 2000 2001 2002 2003 2004 2005 2006 2007 2008 Next


