


 Arguments


Recent Comments
Prev 1994 1995 1996 1997 1998 1999 2000 2001 2002 2003 2004 2005 2006 2007 2008 2009 Next
Comments 100051 to 100100:
-
HumanityRules at 19:57 PM on 11 January 2011Could global warming be caused by natural cycles?
macwithoutfries The timing is great. Dismissing it as ramblings may play well with the gallery but I'm not sure it works well with the mindful "avarage person". -
HumanityRules at 19:53 PM on 11 January 2011Could global warming be caused by natural cycles?
Kate, "What if global warming is just a natural cycle?" To turn this question around I think the "average person" also struggle with the idea that it's just CO2. What are you talking about here? The last 150, 50 or 30 years? There is always the option that it isn't just anything, rather the combination of many things. Afterall the IPCC wording goes "that most of the warming observed over the last 50 years is attributable to human activities." The argument seems to be more nuanced than is it just natural or is it just anthropogenic but to what extent each is contributing to the present trend. -
JMurphy at 19:43 PM on 11 January 2011It's not us
cloa513, could you provide more details of the difficulties due to physics, relating to average temperature readings. Also, what makes you state that the earth has existed for "30+ million years" ? Why not write '4.5+ billion years' - the reality ? Do you think it is nearer to 30 million years old ? -
macwithoutfries at 19:14 PM on 11 January 2011Could global warming be caused by natural cycles?
Perfect timing - see the same-day denier misinformation from here! (ideally now those ramblings should be debunked in a slightly more specific way). -
David Horton at 18:49 PM on 11 January 2011Could global warming be caused by natural cycles?
"it's just a natural cycle" that happens to coincide precisely in timing and rate with the massive outpouring of CO2 over the last 150 years, and especially the last 30. The odds of the two things coinciding are astronomical (so to speak). -
robert way at 18:23 PM on 11 January 2011Could global warming be caused by natural cycles?
Great Job Kate! -
cloa513 at 18:21 PM on 11 January 2011It's not us
You can't average temperature readings (impossible due to physics) so can't really prove temperatures are increasing. We simply do not know enough to make extreme statements that changes are the result of humans- the total Earth weather system(s) has only studied intensively for 40 years compared to the Earth existing for 30+ million years so only 4 "fingerprints" are real evidence. The rest are changes.Moderator Response: [Daniel Bailey] You have me at a loss for what to say (and that never happens). All I can say is that you are not even wrong. I recommend that you start here, then go see the big picture, then top it off with a proper demonstration on how to compare temperature records. -
keithpickering at 17:23 PM on 11 January 2011Seawater Equilibria
Martin #16 Orbital forcing kicks in first, by changing the relative lengths of the seasons. (E.g., in a warming phase summer is the longest season, but in a cooling phase winter is the longest season). This results in ice-albedo feedback from the greater (or lesser) snow amount over the course of the year. Albedo is a huge forcing agent. Oceans warm, and CO2 feedback kicks in. -
Trueofvoice at 16:49 PM on 11 January 2011Understanding the CO2 lag in past climate change
Apiratelooksat50, The fact that your cite, Roy Clark, thinks the current gaseous composition of the atmosphere has held steady for the last billion years should tell you all you need to know about his competence (which is nil). The quality of your arguments suggest you aren't really thinking about the information you're assimilating, but simply repeating it uncritically. Nice Jimmy Buffet reference though. -
archiesteel at 16:41 PM on 11 January 2011Understanding the CO2 lag in past climate change
@apiratelooksat50: "It supports the orbital changes theory as an initiator of change" Yeah, except we have a pretty good idea that orbital changes aren't responsible for the current warming. -
archiesteel at 16:39 PM on 11 January 2011Understanding the CO2 lag in past climate change
@gallopingcamel: "Enough of the straw man approach." Yes, please stop using strawman arguments. "It may surprise you when I assert that CO2 "always" correlates with climate as it affects the energy balance through the well understood process of capturing long wavelength radiation." You may assert it, but in fact you'd be wrong if by "correlating with climate" you mean exactly correlating with temperature. CO2's effect on temperatures is not direct. Sure, the energy imbalance may closely follow the amount of CO2, but the effect of the energy imbalance are anything but linear. "Where we diverge is in the magnitude of the effect in relation to other things that influence climate, such as water vapor, clouds, aerosols, cosmic rays etc." We do diverge on that. The problem is that you have no evidence to support your position. "What should be red flags to those of you who are so sure that CO2 is the magic bullet of climate change is the inability of the modelers to explain past climate change and their lack of predictive powers." That's not a logical argument. Why would uncertainty in models change the basic physical properties of CO2? Also, their "lack of predictive powers" is highly subjective. In fact, models have worked pretty well so far, and there is no lack of explanation for past climate change. Again, it's quite simple: CO2 used to be a feedback, now it's a forcing. You have yet to even come close to challenging this simple fact. "As "apiratelooksat50" and others including myself have pointed out many times, the uncertainties are great." Not so great that we cannot have a pretty good idea that CO2 sensitivity is between 2.5 and 4C. "We are trying to measure changes of a few tenths of a degree in measurements that oscillate over very wide ranges from night to day and summer to winter." Appeal to complexity "What we know about climate change is vastly exceeded by what we don't know. " Again, appeal to complexity. Just because you don't understand the science doesn't mean it isn't true. "Those who express certainty that CO2 is driving modern climate come across as zealots rather than scientists." Well, the evidence supports it, so it is very likely to be true. Of course, certainty is for fanatics, but that doesn't mean we can't evaluate the chances of something being true or not. To argue otherwise is simply not logical. When a lot of evidence points one way, and virtually no evidence points the other way, then chances are the one supported by evidence is true. Again, that may not be a very romantic view (I suspect most contrarians get a kick out of being the underdog), but it's the truth. "You have it backwards. It is up to the proponents of AGW to make better case for the hypothesis." Nice try. As others have pointed out, the case of AGW has been made. It is up to you to disprove. So far, you've been doing an extremely poor job at it. Perhaps it's time to reevaluate your position? "Like the above esteemed scientists" That's sarcasm, right? Singer and Lindzen are far from being esteemed scientists. They are scientists-for-hire who've been shown to be wrong time and time again. "Trenberth's "rebuttal" of Lindzen & Choi 2010 was a fine piece of nit picking but failed to change the main conclusions of the paper." Actually, Trenberth's rebuttal left Lindzen & Choi in tatters. But keep rooting for the "underdogs," I'm sure they'll be vindicated in the third act, right? -
Daniel Bailey at 16:17 PM on 11 January 2011Not So Cool Predictions
Re: Norman (69) Your source uses data from 1979-2002 from the CDC. Albatross' source uses NOAA data from 1997-2006. I've broken down the data (183 deaths due to hypothermia, average 18.3 per year) for you here: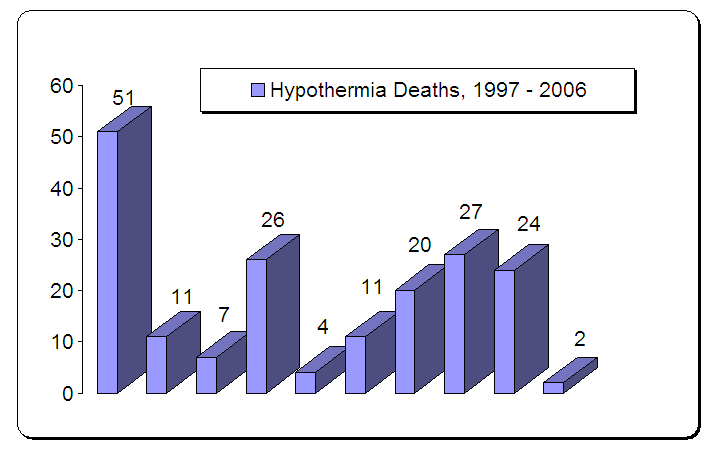 Why the disconnect? Good question. NOAA's data tracks from 1988 while the CDC goes back to at least 1979. Probably a wider definition of hypothermia deaths being used by the CDC (multiple ICD-9 codes). An example of apples-n-oranges in action.
Good comeback. Much better.
The Yooper
Why the disconnect? Good question. NOAA's data tracks from 1988 while the CDC goes back to at least 1979. Probably a wider definition of hypothermia deaths being used by the CDC (multiple ICD-9 codes). An example of apples-n-oranges in action.
Good comeback. Much better.
The Yooper
-
dhogaza at 16:16 PM on 11 January 2011Not So Cool Predictions
Also ...Last winter the continent of South America had a record cold winter
Cite? Parts of SA had unusually cold weather, but I've seen no *credible* source suggesting that the entire winter over the entire continent set a record. You can claim it. You claim to be a scientist. Therefore you can cite it ... -
dhogaza at 16:12 PM on 11 January 2011Not So Cool Predictions
I mean, the graph is actually *labelled* "weather-related" (not *climate related*) deaths. -
dhogaza at 16:11 PM on 11 January 2011Not So Cool Predictions
How about this one then, this one has graphs and comes straight from the CDC. You please tell me how from the graph in figure 1 (shows generally over 600 deaths a year caused by hypothermia) you can go down to just 18 deaths a year?
Because roughly 600 people die per year due to hypothermia, and extra special cold weather only adds about 18 deaths to that average. Climate vs. weather, the basic principle denialists can never, never grasp. -
dhogaza at 16:06 PM on 11 January 2011Not So Cool Predictions
Chemist1:The East coast is currently expreriencing record breaking cold conditions, (and snowfall in some places exceeding expectations of climate scientists and many meteorologists)
Yet another person who doesn't understand that deep cold leads to little snowfall ... And of course he's leaving out the fact that many parts of the northern hemisphere are experiencing intense warmth, because, well, umm ... Why, chemist1? Is there any reason you fail to mention the anomalous warmth up north, where sea ice extent is once again *receeding* rather then increasing, in winter? Because it's effing warm in parts of the arctic? -
dhogaza at 16:02 PM on 11 January 2011Not So Cool Predictions
"others try and look at paleoclimate extending 400,000 or more years ago." These would be looking at *changes* in climate, and would never argue that you need to look at 400,000 year intervals to detect such *changes*. Chemist1 would define climate as being the average conditions in the area of earth over the last 12 billion years, in which case the billions of years before earth was fully formed would dominate the climate record. -
Bob Lacatena at 15:55 PM on 11 January 2011Seawater Equilibria
48, Dan Bailey, No, it was much older than that. It was focused, I think, on a published paper. I can't remember any keywords that will help me find it. Dang. -
dhogaza at 15:54 PM on 11 January 2011Understanding the CO2 lag in past climate change
apiratelooksat50's Roy Clark cite is from Energy and Environment, a "journal" that openly admits it is politically driven. Is this what science teacher apiratelooksat50 believes should be the future of science? Journals explicitly stating their political bias and saying they'll publish damn near any paper that fits their *political*, not scientific, gateway? -
Bob Lacatena at 15:52 PM on 11 January 2011Understanding the CO2 lag in past climate change
208, apiratelooksat50, appinsys is a joke. If that's where you go for "information" then you are a lost cuase. The link you submitted is hysterical. What is most laughable (aside from the fact that his argument is so far out of the mainstream as to be the equivalent of alchemy) is that he went to such lengths to disguise his litany in the form of a published, peer-reviewed paper. Please don't quote from such nonsense and expect to be taken at all seriously. -
dhogaza at 15:50 PM on 11 January 2011Understanding the CO2 lag in past climate change
Muoncounter @203 - The point of my post is to demonstrate that though CO2 and temperature are inexorably linked, this is a clear example of an external factor causing changes in both. It supports the orbital changes theory as an initiator of change
There's got to be a name for the "if X can cause Y, Y must always be caused by X" fallacy. This guy apiratelooksat50's teaching science to kids, right? Grrr ... So apiratelooksat50 accepts mainstream science (orbital changes can initiate change) but rejects the fact that increased CO2 can initiate change ... due to ideology. That's the only possibility. There's no logical connection between the two positions. Rockfalls can kill people, therefore guns can not kill people. An exactly congruent analogue to his point. -
scaddenp at 15:39 PM on 11 January 2011Understanding the CO2 lag in past climate change
" The point of my post is to demonstrate that though CO2 and temperature are inexorably linked," Yes. However, rising temperatures are NOT the cause of this CO2 rise. Eventually those carbon feedback will also cut in (very slow feedbacks) and FURTHER raise the temperature. You seem to have ignored so far the fact isotopic signature of CO2 in atmosphere is fossil based whereas isotopic signature in ice bubbles from past show CO2 from carbon cycle. Try reading some peer-reviewed literature on the subject. -
TOP at 15:25 PM on 11 January 2011Seawater Equilibria
@50 muonocounter What hfranzen is talking about is equilibrium over open sea. Ice covered sea is not open sea, hence, for all intents and purposes, no exchange. If the Arctic ever is ice free it will still be close to 273K reducing the average temperature of the ocean. This will tend to push CO2 down based on averages. -
apiratelooksat50 at 15:21 PM on 11 January 2011Understanding the CO2 lag in past climate change
Muoncounter @203 - The point of my post is to demonstrate that though CO2 and temperature are inexorably linked, this is a clear example of an external factor causing changes in both. It supports the orbital changes theory as an initiator of change, and gives further credence to at least the possibility of even more external factors influencing the rise and fall of temperature and CO2. To Sphaerica @204: I've never stated, nor do I think that temperature always precedes CO2. I do think they are linked and driven by other more dominant and stronger variables. Try reading this which states in the summary. "The energy transfer processes that occur at the Earth’s surface are examined from first principles. The effect of small changes in the solar constant caused by variations in the sunspot cycles and small increases in downward long wave infrared flux due to a 100 ppm increase in atmospheric CO2 concentration on surface temperature are considered in detail. The changes in the solar constant are sufficient to change ocean temperatures and alter the Earth’s climate. The effects on surface temperature of small increases in downward LWIR flux are too small to be measured and cannot cause climate change. The assumptions underlying the use of radiative forcing in climate models are shown to be invalid. A null hypothesis for CO2 is proposed that it is impossible to show that changes in CO2 concentration have caused any climate change, at least since the current composition of the atmosphere was set by ocean photosynthesis about one billion years ago." Author: Roy Clark -
TOP at 15:20 PM on 11 January 2011Seawater Equilibria
And there is the Chewbacca Defense also. Personally, I like the HamHightail. I think the GishGallop can be quite useful in bringing perspective. It seems like hfranzen is saying that the average temperature of the ocean is not rising. Am I missing something in conclusion #2? -
muoncounter at 15:15 PM on 11 January 2011Seawater Equilibria
#49: "an ice free Artic will lower atmospheric CO2? " How on earth do you take that conclusion out of this analysis? From #43: "Increased average temperature will drive some of the dissolved CO2 out of the ocean" From #46: "this translates out as a 12 ppm increase in CO2 concentration for each 1 degree C increase in SST." -
Norman at 15:02 PM on 11 January 2011Not So Cool Predictions
Daniel Baily, How about this one then, this one has graphs and comes straight from the CDC. You please tell me how from the graph in figure 1 (shows generally over 600 deaths a year caused by hypothermia) you can go down to just 18 deaths a year? If one is too high, then the NOAA one is certainly far too low to be of use. Just shows how different sources can really generate vastly different results. Thanks for the response to my post. Yearly Hypothermia deaths in US. -
TOP at 14:32 PM on 11 January 2011Seawater Equilibria
So an ice free Artic will lower atmospheric CO2? -
RW1 at 14:20 PM on 11 January 2011The Physical Chemistry of Carbon Dioxide Absorption
hfranzen, I've taken a look at GWPPT6. I don't see that you have accounted for potential cloud and/or water vapor overlap in your calculations. These are major contributors to net effect of increasing CO2 in the atmosphere - both of which significantly diminish CO2. Also, it's not clear to me how much additional absorbed power from increasing CO2 your inputing. Maybe I missed that? On page 44 you do apparently state that only half of the absorbed power affects the surface. Can you clarify? -
hfranzen at 13:11 PM on 11 January 2011The Physical Chemistry of Carbon Dioxide Absorption
I wrote this esssay and produced my power point presentation, which presents the argument in detail (GWPPT6 on my web site hfranzen.org), in large measure to refute the argument that, "there already is enough...". The confusion arises because the deniers have presented an argument based upon the linear Beer's Law. On the other hand what is required to understand GW is the Planck averaged broad band diffuse Beer's law (derived in GWPPT6). The difference lies primarily in the fact that the linear law assumes that the absorption is of a nearly single wave length (the bending mode. However the existence of a near continuom of rotational states associated with the bending mode means that the GHG effect of CO2 will continue to increase as long as the concentration of CO2 in the atmosphere increases. For example, think about Venus with a CO2 atmosphere that raises the surface temperature to above the melting point of lead.Moderator Response: [Daniel Bailey] For those having difficulty with the various states of the CO2 molecule, 3D visualizations of the various modes of CO2 can be found here. -
Daniel Bailey at 12:54 PM on 11 January 2011Seawater Equilibria
Re: Sphaerica (47) Yeah, I kinda remember the article. Was it this one: http://www.realclimate.org/index.php/archives/2010/12/losing-time-not-buying-time/? If so, it was based on this NAS Report/book: http://books.nap.edu/openbook.php?record_id=12877&page=R1 A PDF of the Executive Summary should be available here. Lemme know if I'm misremembering. These flattening of emissions are all predicated on us actually doing something now. Due to the long tail, the longer we wait, the more likely the ocean-sequestered CO2 (long thought removed from the playing field) will make its triumphant re-entry into the game. Hence the article I alerted you to earlier (and the headline discussed best-case scenarios...). The Yooper -
Norman at 12:30 PM on 11 January 2011Not So Cool Predictions
51 Albatross, I am not sure of the accuracy of the NOAA chart you inserted in your post. Really unsure what data source they are using to develop this chart but it is certainly not correct and off by a tremendous margin of error. Here is a quote from an article I will link to: "The National Institute on Aging (NIA) estimates that over 2.5 million older Americans are especially vulnerable to hypothermia, and Dr. Richard Besdine of the Harvard Medical School estimates that 25,000 older adults may die from hypothermia each year in the United States." 25,000 a year may die but only 18 a year do? Seems really lowball to me. Here is a link to the actual article: This claims cold is a much bigger killer than NOAA thinks.Moderator Response: [Daniel Bailey] Seriously? You prop up a link to a site trying to pump up Amazon.com booksales vs the linked source Albatross gave you - straight from official US Government (NOAA) statistics of actual CRM (cold related mortality) - and give it equivalence? You really need to up your game, Norman. Because those critical thinking skills are failing you. Actual data trumps hypothetical data every day that ends in "y". -
Bob Lacatena at 12:08 PM on 11 January 2011Seawater Equilibria
Dan, maybe you remember... I saw a post within the last 2 years, maybe the last year, I think it was on RC, about a paper that projected/modeled that if we stopped CO2 generation abruptly, that temperature increases would immediately halt, and even start to fall, as would CO2 levels. This all brought that to mind, and I've been trying to find it, without any luck. I'd like to contrast that with your link, and look at it again with a new (if fractional) understanding of ocean chemistry. -
Tom Curtis at 11:15 AM on 11 January 2011Seawater Equilibria
Chemware @1, I am not certain as to the correct answer to 3, but Indermuhle et al cite Bacastrow to the effect that: "A change of SST by 1 8C causes a change in the surface ocean's CO2 partial pressure by 4.2% which translates into an atmospheric change of similar magnitude" I believe, but am not certain, that this translates out as a 12 ppm increase in CO2 concentration for each 1 degree C increase in SST. Interestingly, using data from Law Dome, it is apparent that the CO2 concentration in the atmosphere varied by no more than 14 ppm between the peak of the MWP and the mimimum of the LIA. On the estimate above, this is a temperature fluctuation of no more than 1.2 degrees C. For comparison, the temperature variation between the minimum of the LIA and 2000 is about 1.6 degrees C (based on Moberg et al) or 1.2 (based on the average of a number of reconstructions. Of course, many sceptics are committed to the views that the MWP was warmer than current temperatures and that the modern rise in CO2 is due the warming of the oceans, an example of massive cognitive dissonance. http://www.ncdc.noaa.gov/paleo/taylor/taylor.html http://medias.obs-mip.fr/paleo/taylor/indermuehle99nat.pdf -
Bob Lacatena at 10:42 AM on 11 January 2011Seawater Equilibria
43, hfranzen, Certainly both are frightening, the idea that temperature increases might accelerate if the oceans begin to release instead of absorb CO2, and that even if we get things under control, CO2 levels may continue to rise, or at least will stay elevated for quite a very long while. The analogy that I like is that CO2 is like the thermostat on your house. It's like we've dialed it way up, then broken it so we can't turn it back down. Sure, it's not that hot yet. But it's going to keep getting hotter, and when it's finally bad enough to bother enough people, it's too late. We can't go back and dial down the thermostat, because we "broke it." The other analogy I like, for people who keep saying "this isn't so bad" (yet), is the old story about the guy who jumped off of the top of the Empire State Building. Every time he passed an open window, he was heard to say "so far, so good!"Moderator Response: [Daniel Bailey] Bob, that part (ocean inertia) plays a pivotal role in this breaking news release. -
scaddenp at 10:34 AM on 11 January 2011Understanding the CO2 lag in past climate change
apiratelooksat50 - AGW is not so much an hypothesis as an outcome from the current theory of climate. There obviously is no "official" version in science, but if you want to avoid strawman arguments, then its best to refer to IPCC WG1 reports. That way instead of claiming "AGW states this", you can instead say "the consensus view as expressed on pg xxx of WG1". This gets everyone on the same page immediately. For arguments about past CO2 level, you want Ch6 - paleoclimate. -
tcflood at 10:33 AM on 11 January 2011The Physical Chemistry of Carbon Dioxide Absorption
One criticism of GW that I have seen is that there is already enough CO2 in the atmosphere to absorb all of the earth's black body radiation at the CO2 frequencies within a few hundred meters of the surface. Therefor, the argument goes, any addition of CO2 to the atmosphere can't possibly make any difference. I believe the first assertion is correct, but the second is not. HFranzen might enjoy expanding on this.Moderator Response: [Daniel Bailey] The second is most definitely incorrect due to the broadening in the wings (see here). If you thought about it some, you'd realize why the first is wrong as well. Mandatory reading is this guest post by Spencer Weart over at RC. Enjoy! -
Trueofvoice at 10:20 AM on 11 January 2011Understanding the CO2 lag in past climate change
Apiratelooksat50, It would be very helpful if you would take time to consider what you are going to type before you make your next post. So far you've been less than coherent, making it difficult to determine what point (if any) you are attempting to make.Moderator Response: Also please look for the most appropriate thread on which to comment. Don't worry about your comment being overlooked because it's on a different thread. Most regular readers check the "Recent Comments" page you can get to from the link in the horizontal blue bar at the top of the page. -
hfranzen at 10:15 AM on 11 January 2011Seawater Equilibria
Response to a different part of #41: A caveat: What I presented above relates to a model of the ocean as it is now. The bicarbonat, which is more than 90% of the dissolved carbon dioxide, clearly has a terrestrial origin. I can state this because it carries an anionic charge and therefore (by electrical neutrality) must be accompanied by a cation. At pH 8 this cation is clearly not hydrogen ion. So the compensating cationic charge must come from among the oceans total dissolved cations. This in turn means that the bicarbonte entered the oceans from the land (and/or the ocean bottom) and I would guess that entering has been going on for millenia. The equilibria I describe are based upon the current pH and thus also the bicarbonate and carbonate molalities (which are fixed by the pH and the partial pressure) and probably do not provide an accurate description of the ocean's inorganic chemistry thousands of years ago. -
hfranzen at 09:55 AM on 11 January 2011Seawater Equilibria
Response to 41. Increased average temperature will drive some of the dissolved CO2 out of the ocean (a new, lower dissolved concentration will be established) as shown by the main result above. But the scary thing to me is the effect of partial pressure on the equilibria. If we succeed in decreasing our production of CO2 so its parial pressure would drop all things being equal we will find that all things aren't equal and, even at constant average temperature (which seems unlikely on the time scale of decades) the amount by which the atmospheric ppm is decreased will be slowed by evolution of CO2 from the ocean as the partial pressure drops. That is, if from the described system you remove some of the partial pressure of CO2 (decrease the ppm) the equilibria in the ocean will shift to increase that partial pressure above what it would have been without the evolution from the ocean. -
MrAce at 09:46 AM on 11 January 2011The Physical Chemistry of Carbon Dioxide Absorption
Hugo, don't get me wrong, I think you did a good job and the result is absolutely in the right ball-park. When I first saw it I thought that you replicated the calculation for the no-feedback-climate-sensitivity. But when I checked it, the result was different. Apparently that calculation is based on a more complicated model using clouds and convection. Even seasonal, latitudinal and height distribution of gases are important as you can see in this paper. -
hfranzen at 09:38 AM on 11 January 2011Seawater Equilibria
Response to 24 and 38. Thanks - I got rid of the offending grammatical errors. It took me a long time to find them, but there they were. If I only knew how to type.Moderator Response: [Daniel Bailey] Dr. Franzen, what aids me greatly in the spelling department is to take advantage of Skeptical Science's preview feature. When typing within the window, any text not in the dictionary will have a red underline to bring it to your attention. Right-clicking on the red line brings up suggested alternative spellings for the word in question. You can also check the formatting of your tags as well. -
Bob Lacatena at 09:26 AM on 11 January 2011Seawater Equilibria
Dr. Franzen, Thinking it through just a little more, I suppose a major difference between the current environment and the glacial/interglacial transitions is the fact that in the current environment, the partial pressure of CO2 in the atmosphere is very high, as opposed to the normal glacial/interglacial transition, where it is much lower. This must also affect things greatly. In fact, I am only just now realizing that there are other complications due to a partial pressure of CO2 being now historically inconsistent with other factors... for example, the fact that this imbalance between atmosphere/ocean is currently causing oceans to absorb CO2, but eventually, as temperatures stabilize relative to the new CO2 levels, that process will inevitably slow, halt, and possibly reverse, allowing much of the CO2 which has been absorbed to date instead make it into the atmosphere, raising CO2 levels even higher. So the ocean has been acting as a CO2 speed bump that will eventually be overwhelmed. -
hfranzen at 09:17 AM on 11 January 2011Seawater Equilibria
Response to #39l I guess many readers are thinking of long term events while the strength (and the weakness) of what I have to say is that it pertains to right now. The strength lies in the fact that I do not have to worry about how well we know what was happening many, many years ago. Because that is my time frame, and the only one to which I can possibly have anything to say, I do forget that others are worrying about what happened in the distant past. On the other hand, if we can apply strightforward science to what is being observed right now I feel it is worthwhile to do so. I just have to remember to quality my remarks and conclusions by including the relevant time frame! So thanks for the comment! -
Bob Lacatena at 09:03 AM on 11 January 2011Understanding the CO2 lag in past climate change
204, apiratelooksat50, Thank you! You've provided a wonderful example of more evidence that the overly simplistic thinking that CO2 must always lag temperature is childishly flawed. The mechanisms involved are fairly easily understood, even if their interplay is at times surprising, but the point is made. One cannot simply say "this is what happened before, so it must always happen that way." The system is reasonably complex, and every factor affects other factors, which feedback on the system and affect everything else. One must understand how it all fits together to make a rational, intelligent statement about the system as a whole. The "CO2 lags temperature" statement is thus demonstrated to be insufficiently sophisticated to be used as an argument against the current effects of CO2 on climate. It's rather like a child who knows that 2+2=4, and so argues that it is therefore quite obvious that 2+3=4 and 2+4=4, and in fact 2+anything=4. It's clearly wrong, to anyone that understands 2nd grade math, although convincing the child of his naivety may be difficult. But your example does help to demonstrate the point. Well done. -
Bob Lacatena at 08:51 AM on 11 January 2011Seawater Equilibria
Dr. Franzen, I've noticed that some people are confused by your statements about the small amount of CO2 released with one degree change in the temperature of the water. I was also a little perplexed by that, since the absorption/release of CO2 from the ocean is the major feedback factor in the transition into/out of glacial periods. It might help if you were simply a little more direct in explaining that you are referring in your post to daily or seasonal changes in temperature of regions of the ocean, not long term changes in temperature of the oceans as a whole, and that it is the net exchange over the entire ocean on which you are focusing — so it is not so much "how much" that is important as "this offsets that". You might also alter the phrasing of this statement:This means that the mtotCO2 locally in the ocean decreases by only 13.5 micromoles per kg for each degree that T increases.
The use of the word "only" implies that CO2 release from the ocean is inconsequential with change in temperature, when that is clearly not the case in the transitions between glacial and interglacial periods, as evidenced by the ice cores. -
Bob Lacatena at 08:41 AM on 11 January 2011Seawater Equilibria
29, hfranzen (responding to 24, MattJ) You can find the errors by using your browser's search (find) function. "Restaraint" is in the third sentence of the first paragraph. The "of dissolved of boric acid" phrase comes in "The molality of hydrogen ion is fixed by the measured pH, and the observed quantity of dissolved of boric acid yields" just before your second embedded equation. As a side note, you could also make it a little more readable by using HTML instead of images for things like CO3-2(aq). You just need to use the sub and sup tags around subscripts and superscripts. -
hfranzen at 08:29 AM on 11 January 2011Seawater Equilibria
Thanks - I did get it. and it is a very good argument. Thanks for the references. -
Mila at 08:29 AM on 11 January 2011Polar bear numbers are increasing
a broader context: Ecol Appl. 2008 Mar;18(2 Suppl):S97-125. Quantifying the sensitivity of Arctic marine mammals to climate-induced habitat change. doi:10.1890/06-0546.1 http://www.esajournals.org/doi/abs/10.1890/06-0546.1 -
muoncounter at 08:10 AM on 11 January 2011Seawater Equilibria
#35: By land sources, I refer to Anthropogenic use of fossil fuel. The northern hemisphere as a whole emits more CO2 than the southern, primarily due to the greater land area. If the global ocean is a primary CO2 source, I have difficulty understanding how places like the Azores, Easter Island, Bermuda, Midway, etc don't see it. See the flux maps and flux time series displays here for some comparative rates, organized by geographic setting. Also look at CO2 weather while you're on that ESRL site; you can literally see the seasonal cycles of atmospheric CO2. Oceans are complicated, as you well know. There are some comments and maps of locallized ocean sourcing in the deep southern hemisphere vs. sinking elsewhere on the ocean acidification threads here and here.
Prev 1994 1995 1996 1997 1998 1999 2000 2001 2002 2003 2004 2005 2006 2007 2008 2009 Next


