


 Arguments


Recent Comments
Prev 2001 2002 2003 2004 2005 2006 2007 2008 2009 2010 2011 2012 2013 2014 2015 2016 Next
Comments 100401 to 100450:
-
Miriam O'Brien (Sou) at 04:28 AM on 7 January 2011Understanding the CO2 lag in past climate change
@ apiratelooksat50 - I refer you to the articles on this page: http://www.skepticalscience.com/argument.php In particular, items 1 and 2, 11, 28, 41, 46, 48, 65 etc etc - or better yet, read them all, or as much as you can. Maybe spend a bit of time on greenhouse gases as this seems to be an initial stumbling block for you. For costs and practicality of sustainable energy, try climateprogress.org for starters - it has lots of good articles about what is happening around the world. Better to spend a penny today to save many pounds later. -
Utahn at 04:25 AM on 7 January 2011Graphs from the Zombie Wars
Miekol, try this topic as well.... "CO2 is coming from the ocean" -
muoncounter at 04:20 AM on 7 January 2011Understanding the CO2 lag in past climate change
#79: "evidence that suggests orbital changes are NOT responsible for recent warming?" We know the orbital variations very accurately; you can look up the parameters on NASA webpages. Using those numbers, we can calculate what the solar insolation is at any point on the surface as functions of latitude and day of year. Point is, we are not in an anomalous warming period based on orbit. See Ice data made cooler for a nice graphic illustration of how this works and how it ties to the Vostok core record. That is a more appropriate thread for orbital questions. -
DSL at 04:19 AM on 7 January 2011Understanding the CO2 lag in past climate change
Actually, Pirate, your comment in 77 is not true. The climate of the last 5000 years or so has been, relative to the time span of homo sapiens, fairly stable. And humans have taken advantage of that stability, swelling to 6.5 billion and creating complex socio-economic relationships with the environment. We can't migrate as easily as we used to. I second Anne's question to you: are current global temperature changes consistent with "natural" causes such as insolation and Milankovich cycles? Yes, Les -- a bit of odd math. If we add 15% to the full bathtub and cause spilling, we're only responsible for 15% of that spillage? Ethicists may now grimace. The tub, one may argue, has a variable lip height, but it doesn't for humans. Humans have had a nice, stable lip height for several thousand years, and we've built a massive and delicate socio-economic system on that stability. We don't migrate as easily as we used to. -
Philippe Chantreau at 04:18 AM on 7 January 2011Graphs from the Zombie Wars
Yvan Dutil makes a good point. There is, among deniers, an ideological component that is overwhelming. Of course it can also be found among zealots of the opposite side, who don't even really know what it is they believe in, even though it is not even a matter of belief. In their case, they happen to be on the side of reality due to coincidence. The ideological component is deeply emotional in nature and does not lend itself to rational analysis. Some time ago, somebody who certainly meant well and was a good person susbcribed me to the 7th day adventist church publication, which I then received regularly for quite a long time. It was an enlightening read on many occasions. I remember especially their interviews of adventist geologists, whose profession and livelihood could not be reconciled with the adventist belief that the Earth is quite young. These people were living on a day to day basis with cognitive dissonance, knowing on a rational plane that their belief was wrong and knowing on an emotional plane that their academic, evidence-based knowledge was wrong. An interesting human experience, to be sure. Of course, the interview was always presenting this with a conclusion that could be summarized by "God wins", regardless of the reality experienced by these individuals. The same cognitive dissonance can be seen with AGW. The emotional tie to the ideology (whatever that is) is just too strong. In the case of BP it is understandable, considering the trauma endured from a centralized autoritarian government. With the more typically American Libertarian type it is a little more difficult to understand. It's not like libertarianism has any significant history of being applied at the scale of a major country. It is mostly a theoretical construct, rather abstract, but perhaps satisfying for a number of people who do not like their activities to be scrutinized or regulated. Yet some are so fanatical about it that, if they ever got their way, we would have to watch for the same kind of abusive behaviors that they attribute exclusively to centralized governments. It would take a somewhat different form but would be similar in essence. Humans have an infinity of individual behaviors, but a fairly limited range of social ones. As for myself, I am skeptical of any and all ideology, as it is always an abstraction, concocted by a person or a group with a perception of reality that is necessarily incomplete. Funnily enough though, ideologies can almost be defined as "a source of definitive answers" (!). I also try to keep in mind the limitations of anyone who shows an emotional attachment to an ideology. It does affect judgment in ways that rational thought is often unable to overcome. -
Phila at 04:02 AM on 7 January 2011Understanding the CO2 lag in past climate change
gallopingcamel: Yes, my comment about the "New Lysenkoism" was off topic, so I will keep that argument for another day. I suggest you keep that "argument" under wraps forever, because it adds nothing intelligent or interesting to the discussion, and will only do further damage to your already minimal credibility. If you have a coherent scientific argument, you don't need insults. If you don't have one, insults will do nothing but underscore the weakness of your position. The same goes for your endless situational ad hominems about scientists having to "sing for their supper." Apparently, the principles of "skepticism" oblige us to mistrust thousands of climate scientists from all over the world, along with any hard data they've collected that upset us; instead, we should place our trust in an anonymous online commenter who's offering a tiny amount of anecdotal evidence in support of an argument that wouldn't be logically compelling even if the anecdote turned out to be true. If you can't recognize the absurdity of your basic assumptions, and the utter poverty of the argument you've built on them, I'm certainly not going to trust you to interpret the far more complex issue of AGW. I'll stick with actual science, thanks. -
les at 03:53 AM on 7 January 2011Understanding the CO2 lag in past climate change
@77... Sorry, you haven't actually answered the question, you've changed the subject - in doing so, you seem to have negated your original point, as well as indulged in some classic "delilast" (hate that word) rhetoric. Be that as it may; I'm still holding out for an answer... I'm sure someone will help me. -
apiratelooksat50 at 03:51 AM on 7 January 2011Understanding the CO2 lag in past climate change
Anne-Marie Blackburn @78 Where is the evidence that suggests orbital changes are NOT responsible for recent warming? They always have been in the past. I have to ask you, "Why is the current warming any different than the past." Please clarify what you are asking about timescales, and define the metrics on "observations consistent with a warming caused by orbital changes". While you are at it, please give a short list of the phenomena so we are talking apples to apples. -
angliss at 03:47 AM on 7 January 2011Graphs from the Zombie Wars
Oh, and my no-ocean delay number was pretty close to what fydijkstra found in #13 and my ocean delay was about 3.2 C nominal (I don't immediately recall the range, however. And all done on a white board and with a calculator. I love math. :) -
angliss at 03:44 AM on 7 January 2011Graphs from the Zombie Wars
#19, bverheggen - Actually, it was Tobis and I who did the math, not Fuller, and we did it initially at Kloor's site. Tobis did his calculations with the simplifying assumption that, in the region of interest, the effect was approximately linear. I did my calculations including the logarithmic effects and did it two different ways - with and without a simple oceanic delay, producing a range of values that included the IPCC climate sensitivity range. -
dana1981 at 03:37 AM on 7 January 2011Graphs from the Zombie Wars
Nice post. A couple of comments: 1) Todd F beat me to it in comment #36, but climate sensitivity is an equilibrium value. The planet is currently not in equilibrium - there is roughly 0.6°C warming still "in the pipeline" from the CO2 we've already emitted. So any extrapolation of climate sensitivity based on the warming thus far will underestimate the value. 2) The sensitivity value of 6°C for 2xCO2 is a long-term sensitivity, which accounts for slow processes over centuries, mainly melting of ice. Hansen would agree that the short-term senstivity is close to 3°C, but has concluded that the long-term sensitivity is 6°C. The article glosses over the short-term vs. long-term factor. -
Phila at 03:36 AM on 7 January 2011Graphs from the Zombie Wars
Yvan Dutil: He hates government and has an absolute belief in free market. It's odd that the people who seem most devoted to the free market tend to be the least interested in gaining access to the accurate information that optimal market-based decisions require. I'm no libertarian, because I stopped being 14 years old several decades ago. But if I were, I'd like to think that I'd allow physical reality to impinge upon my consciousness, now and then, for the sake of the freedoms I supposedly love. A "free market" in which the extraction industries can drown out the world's scientists isn't free. Quite the opposite. -
F. Murdoch at 03:22 AM on 7 January 2011Graphs from the Zombie Wars
I'm not sure this is a great method of making the point to the denier. Although it would force them to admit that both atmospheric CO2 is increasing and the temperature is increasing, if he or she was sharp enough they would point out that since CO2 is increasing steadily, it is very highly correlated with time, and therefore what you are really seeing may not be anything more than the temperature increasing over time. Which of course is caused by some mysterious and elusive natural cycle. And so we are back at square one, trying to explain the underlying physics to the denier, who will claim it violates the second law of thermodynamics, and probably make a reference to nazi's and communists while doing so. -
Albatross at 03:20 AM on 7 January 2011Graphs from the Zombie Wars
Keith Pickering, Nice post, and in terms that it speaks to most people (except the zombies of course). To appease the zombies further, perhaps you could add a 95% CI to the fit. Won't make a hill of beans difference to the conclusion, but anyways, anything to appease the zombies. Another matter to consider is that of autocorrelation. Barton Paul Levenson has addressed that though, here, and the correlation after accounting for autocorrelation is still statistically significant. The zombies though will remain unconvinced. Sigh. -
Anne-Marie Blackburn at 03:19 AM on 7 January 2011Understanding the CO2 lag in past climate change
apiratelooksat50 @76 Where is the evidence that suggests orbital changes are responsible for recent warming? How do timescales fit with this? Are all observations consistent with a warming caused by orbital changes? If you can provide a coherent theory that explains all phenomena, then you may have a point. Otherwise all we have is your opinion. -
burningMan at 03:16 AM on 7 January 2011Graphs from the Zombie Wars
Hi there, Long time follower of this site, first time posting... The person skeptical of your second graph, the one you made in GMT with two different Y-axis values, did the skeptic mention what they where skeptical of exactly? Where they saying that there is no such thing as a non-linear correlation? -
apiratelooksat50 at 03:04 AM on 7 January 2011Understanding the CO2 lag in past climate change
Les @76, Changes in orbital cycles make much better sense in initiating cooling/warming phases than changes in CO2 levels. With the exception of leftover thermal energy from the formation of the Earth, the sun is our energy source. The CO2 cycle is never "in balance" (refer to the chart). It fluctuates and the fluctuation is normal. A tipping point does not exist because it can't be quantified. There is no "normal" for temperature or CO2. We can refer to the climate we live in now as normal, but the fact is that humans have lived through many different climates and climate changes and adapted quite well to it. In fact, climate change has been linked to technological development, and evolution. -
D Kelly O at 03:01 AM on 7 January 2011Comparing all the temperature records
John Glad to see you using my consolidated anomaly data file. I've just posted a "how to" on developing a common baseline for the 5 major anomaly series ( link). The RClimate script lets users compare 2 series with a trend chart and xy scatter plot. I have added combined baseline csv file to my on-line data files so that citizen scientists can directly compare the series using a common baseline (link ) -
robert way at 02:45 AM on 7 January 2011Graphs from the Zombie Wars
Keithpickering, Dual scales can be used on Excel (called secondary axis). Another thing you could potentially do is take both datasets and standardize them using the following formula (function called standardize in excel) Zvalue = Xvalue - Mean of Series / Stdev of Series -
Yvan Dutil at 02:45 AM on 7 January 2011Graphs from the Zombie Wars
I have a friend who is a zombie. He has a BSc in Physics and a BSc in Physical engineering as a master in Physics. You should think he would understand the scientific arguments. No even, because it is totally blind to them. He hates government and has an absolute belief in free market. Each time, you provides him adequate information, he will stop converse with you. -
Todd F at 02:42 AM on 7 January 2011Graphs from the Zombie Wars
In calculating co2 sensitivity, the methodology in the post would understate it because it does not account for thermal inertia in the oceans, which produce a significant lag in global temperatures in response to increased co2. Thus further warming is in the pipeline, even if co2 concentrations were to remain constant. I think this commitment is estimated at around 0.3C to 0.8C. http://www.realclimate.org/index.php/archives/2010/03/climate-change-commitments/ I think non-co2 greenhouse gases largely offset the expected cooling impact of aerosols, which is why modeling just co2 works fairly well, even though the other forcings are significant on their own. -
Spaceman Spiff at 02:40 AM on 7 January 2011Graphs from the Zombie Wars
fydijkstra @13 Soon you'll be able to add a point on your graph for 2010. A preliminary measurement (NASA GISSTEMP) can be found at Jim Hansen's website. He and his collaborators regularly update this page as the processed data come in. -
skywatcher at 02:37 AM on 7 January 2011Graphs from the Zombie Wars
#31, funny you say that, considering the charts purport to show different things. Keith Pickering's charts show the rather good relationship between CO2 concentration and temperature over the past 160 years. Snide comments about dodgy scales are not necessary as he explains his methodology and the results are reproducible. This methodology highlights how dominant the response of temperature is to CO2 forcing over other factors, such as solar etc, especially in the last 40 years, and as shown by the research. fydijkstra's chart incorrectly assumes a logarithmic profile for the future global temperature, when the logarithmic relationship he refers to only applies to the radiative forcing specifically by CO2 (and a different logarithmic profile for methane radiative forcing). The resulting temperature change does not only depend on the radiative forcing. When you add in feedbacks such as water vapour feedback, CO2 feedback and albedo feedback, there is no guarantee that a logarithmic relationship is the outcome. In fact, with reference to the shape of glacial terminations, such a shape seems extremely unlikely if you do things like lose shiny surfaces you can't easily grow back... -
les at 02:29 AM on 7 January 2011Understanding the CO2 lag in past climate change
regarding #73, could someone please explain to me how, because humans account for 15% (or what ever) of the total CO2 in the atmosphere, we're only responsible for 15% (or what ever) of the increase in temperature. I've heard this argument before and can't quite make sense of it. I had kind of assumed that if the system was in balance and we come along and unbalance it, we're responsible for it tipping over... 100% -
keithpickering at 02:28 AM on 7 January 2011Graphs from the Zombie Wars
#miekol: Is this natural?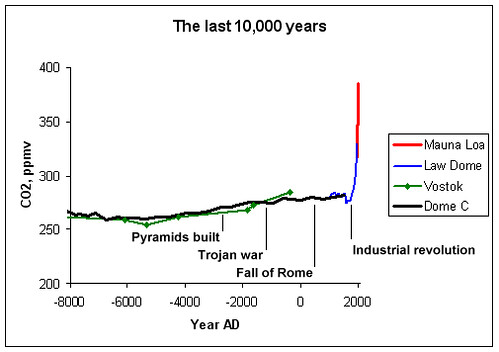 Is this natural?
-
keithpickering at 02:24 AM on 7 January 2011Graphs from the Zombie Wars
#Ian Love, Toby Joyce, et. al. -- Yeah, well I'm still using Excel 2000 cause I'm too cheap to get anything newer in the open-source age. #Ken Lambert -- I like fydijstra's chart too, but it's exactly the same as mine except for the use of a logarithmic trendline instead of a linear trendline. In what sense are my scales "dodgy"? -
Joel-Snape at 02:11 AM on 7 January 2011Understanding the CO2 lag in past climate change
That's meant to be "discernable", not "desirable". -
Joel-Snape at 02:08 AM on 7 January 2011Understanding the CO2 lag in past climate change
@Sout There are problems with using ice-core proxies to determine past CO2 concentrations because it's likely that CO2 would have leeched out of the trapped air-bubbles, albeit very gradually, giving the appearance of stable CO2 concentrations over millennia. Stomata proxies show much more variability, although I am sure they come with uncertainties too. Just about every aspect of paleoclimate reconstruction seems extremely conjectural and uncertain to me. On topic, the hypothesis that positive feedback was the main cause of the earth's climate switching between glacial and inter-glacial states is one that sounds reasonable to me on the face of it, although I have seen nothing as yet to convince me that it definitely was the main cause. I have still yet to come across convincing evidence that CO2 is having (or can have) any desirable effect on global temperatures, and until I see some, I’ll remain sceptical on the idea of CO2-positive feedback. Orbital cycles seem a tad more plausible to me. -
les at 01:54 AM on 7 January 2011What's in a Name?
@14 A facts based argument, eh? Oh no you don't! You must be being paid $millions to cover up the truth! -
apiratelooksat50 at 01:47 AM on 7 January 2011Understanding the CO2 lag in past climate change
This article and subsequent threads have been very informative and do a good job of linking orbital changes to warming and cooling phases in Earth's history. The AGW theory failed to explain historically-known phenomena. The earth has experienced many periods of cooling and warming without the help of mankind. While it does appear that increasing CO2 levels, whether from anthropogenic sources or not, are having a documentable affect on the climate, it is also not clear how great these affects are, or may be. Label me a skeptic or denier, but I am not convinced that anything we are experiencing now cannot be explained by historical scientific observations that are completely validated (El Nino, La Nina, orbital variations, solar activity, PDO, volcanic eruptions, etc...). And, before you say I am "just a teacher", I have a B.S. degree in Biology and an M.S. degree in Environmental Engineering, and worked for 20 years in research, consulting, industry and environmental enforcement/compliance. Initially I was pro-AGW, but over the years as I've witnessed the shouting down and negative labeling of legitimate scientific inquiry that questioned components of the AGW theory, my position changed. Real science is always open to refutation and revision. In addressing man-made global warming, it is far more prudent and cost-effective to adopt a wait-and-see approach than to spend trillions now on what may or may not be a problem. Even if global warming becomes a problem, it’s going to be a problem regardless of how much we spend. Man-made contributions to atmospheric CO2 concentration total 15 percent and natural sources the remaining 85 percent, according to the U.S. Department of Energy. According to data from the National Oceanic and Atmospheric Administration’s Earth System Research Laboratory, between 1980 and 2006, the average global temperature increased 0.7 degrees F while atmospheric CO2 levels rose 48 parts per million by volume (ppmv). Fifteen percent of 0.7 degrees F equals 0.11 degrees F from man-made sources. Using United Nations climate-panel numbers, the atmosphere gains 2 ppmv a year of CO2 annually. After 10 years of a “do-nothing” approach, there would be an increase of 20 ppmv correlating to 0.3 degrees F. Of that increase, 0.05 degrees F would be man-made. To avert a miniscule amount of potential man-made global warming, according to some research, it would be necessary to shut down the entire global economy for a decade. By adopting a wait-and-see approach, we still have plenty of time to address even the worst-case predictions of climate change. Since it’s unlikely that we could do much to avert it, why not spend that money fighting the changes? Or, we could feed and educate everyone in the world.Moderator Response: [muoncounter] Please avoid blanket statements like 'AGW theory failed to explain,' 'according to some research', etc. Document 'shouting down' of legitimate science and 'shut down the entire global economy' or such overt generalities cannot be taken seriously. There are multiple pages here at SkS that address your opinions; please use Search to find the appropriate threads. There is a lot to read and come to understand; you might want to see if your opinions and cursory research bear up to what the actual science has to say. -
Ken Lambert at 01:32 AM on 7 January 2011Graphs from the Zombie Wars
Original Post #keithpickering You should have a look at the excellent chart by fydijkstra #18. It puts your charts with dodgy scales and simplistic linear fits in the shade. The time integral of the net forcing from all sources (CO2GHG, Solar, S-B, Cloud cooling etc)is the energy applied to warming the planet - I would like to see this plotted against the temperature response. -
Paul D at 01:27 AM on 7 January 2011What's in a Name?
Using Google scholar and searching for Svante Arrhenius gives a number of references, including 'Worlds in the Making'. -
Paul D at 01:25 AM on 7 January 2011What's in a Name?
@13 and spike. I haven't investigated but maybe this is an explanation: 1896 was the year that Svante Arrhenius proposed the theory of greenhouse gases and climate change. One would expect some activity around then. In 1900 Knut Ångström launched a critique and in 1901 Arrhenius replied. http://en.wikipedia.org/wiki/Svante_Arrhenius#Greenhouse_effect -
Bob Lacatena at 01:14 AM on 7 January 2011Understanding the CO2 lag in past climate change
66, gallopingcamel,While correlation does not imply causation it is clear that CO2 is not driving temperature changes on Vostok timescales. Does CO2 affect temperature at other timescales? I have no doubt that it does through all kinds of mechanisms
Okay, at this point you are purposely simply ignoring the OP and the logic of the whole situation to blow smoke and present inaccurate information, while trying to make your position seem palatable and reasoned with faux skepticism. Go back and read the post, and think about it enough to understand it. There is a perfectly logical reason why CO2 would affect temperatures on long time scales, and also be influenced by temperatures on long time scales (feedback loop). Trumpeting one effect while ignoring the other is either using childishly simplistic thinking, or else presenting such childishly simplistic thinking in an effort to score points with the gullible that can't be bothered to think it through themselves to that degree. There are also perfectly good, obvious, and difficult to refute reasons (without just making stuff up, or purposely ignoring facts and logic) why CO2 is currently driving temperatures to unheard of levels at an unheard of rate. Saying "I'm reasonable, but..." followed by a lie and misrepresentation is still lying. -
Bob Lacatena at 01:08 AM on 7 January 2011Understanding the CO2 lag in past climate change
56, Lurgee,I have taken time to read comments and papers published by the experts you refer to. They bear out what I said - that interpreting ice core data is fraught
No, actually, they don't. They detail all of the considerations, how they should be handled, and what the margins of error are. You're simply choosing to interpret and portray it as such for your own purposes.Can you point to a paper published by someone with suitable credentials, stating...
Clearly I can't, because you say you've already read the papers, and you're willfully choosing to misinterpret and misrepresent what you've read. If I give you a paper, you'll just come back and say you've read it, and that black is white....my doubt about the wisdom of relying on a single core...
If you compare different ice cores, you'll see significant variation between them.
Um... which is it? I thought you said there was only one? Obviously you know enough to know that there are different cores from different sites, in both the Antarctic and Greenland -- even though you seem to like implying otherwise (to fool the casual reader?). But that getting such cores is a very expensive operation, so there still aren't many. What makes you think people look at one to the exclusion of others?...or trying to 'refudiate' AGW on the basis of CO2 lagging temperature on the way down.
But that's not the issue. It makes sense that CO2 would lag temperature in that situation. It should. The problem with that argument against AGW isn't that CO2 doesn't or wouldn't or shouldn't lag temperature. The problem is that the mechanisms and interplay of events means it's comparing apples to oranges. It's like saying that you've always seen bullfighters kill bulls, so there's no way that a bull could ever kill a bullfighter. Sorry, but the ice cores are exactly what they are. They aren't perfect, but their imperfections are well understood and recognized, and they are perfectly acceptable and accurate proxies for CO2 levels and temperatures on the timescales in question. Saying anything else, with so much hand waving and "I've read..." is just blowing smoke to try to make skeptic arguments seem viable. -
JMurphy at 01:07 AM on 7 January 2011Graphs from the Zombie Wars
The ultimate problem with the climate zombies and their beliefs, is that we can end up stating : "Alright, you're not convinced and no-one can ever convince you if you are not prepared to accept the vast number of scientific studies available, but would rather cling to the very few contrary reports that exist or would rather take a 'wait and see' attitude. So, why not let the scientists give their advice to governments and let the decisions be made based on what the science says." The response from them varies from "I'm not letting my tax dollars be 'wasted' on blah, blah, blah" to "Let's have a big debate and then the public can decide" to "I don't trust the government" to "It's all a big left-wing, green, elitist, UN conspiracy anyway !" Rationality can make little headway against irrationality, especially when the latter is basically naked ideology searching for even the tiniest fig leaf of (usually pseudo-)scientific cover. -
les at 00:57 AM on 7 January 2011What's in a Name?
Hiding the Spike!
I notice that the above Ngrams only start in 1979. Looking at the full scale I found a spike at round 1900! Now that's clearly before the industrial revolution and this must prove that both GW and CC and not caused by CO2.warmists might try to look at the books at the books in this selection and will probably suggest that it's largely a glitch in the google but wouldn't this just prove that science is unreliable?
I've looked at some of the book and notice that many entries are due to sentences like: "be subjected to wet and cold, change of climate, change in occupation, increased or decreased work"... now "climate, change" happens quite often in this spike... to often to be coincidence... this, I believe, is the work of aliens, or the New World Order, or aliens working with the NWO...
Apologies, I'm feeling quite flippant these days, please feel free to delete this post as being off-hominem.
-
muoncounter at 00:42 AM on 7 January 2011Graphs from the Zombie Wars
#18: "To say that the CO2 is coming from nature involves you inventing a magical way for 30 billion tons of human CO2 to disappear... " Magic seems to be the basis of Miekol's (and others) 'arguments': 'CO2 is coming from nature' - source unknown, so presto! 'Oceans giving up CO2 as earth warms' - yet oceans are acidifying, so presto! It must be a magic trick that ~50% of fossil fuel CO2 emissions consistently equates to the observed annual atmospheric CO2 concentration change. A magic trick that cities have peaks in CO2 concentration that match daily, weekly and seasonal traffic patterns. The actual magic is that they can cling to the hope that as long as 'it might be anything else', then it can't be AGW. -
skywatcher at 00:40 AM on 7 January 2011What's in a Name?
Jim Simpson - that's the whole point surely, that in the scientific literature both terms are old (in fact 'climate change' is older), and both have a specific meaning. Skeptics have indeed twisted the meaning by suggesting that there has been a deliberate change, but there has not been such a change. "Global Warming" applies very nicely to graphs of global or hemispheric temperatures, but not to very much else predicted to happen within a warmer world - floods, droughts, sea level rise, ocean acidification, unusual winter weather patterns etc. Actually, I prefer terms such as global climate disruption/destabilisation, as they begin to get across the concept of unusual and perhaps destructive weather patterns and weather events that are the inevitable result of more energy and water vapour in the atmosphere. Politically at least, "warming" was fine for what happened in the '80s and '90s, but it doesn't cover what is happening now, which includes both warming and the emergence of consequent events. As long as the general public only think it's about 'warming' they have the wrong idea about what is happening and is going to happen. As a result, in Britain, very few connections are being made between unusual winter weather and warming, and some talk of poor summers indicating cooling - of course the global picture is unmistakeable, but the local expression may be a different form of climate disruption than rising temperatures. Many in Britain would like 'warming', but they naively don't comprehend what comes with it, and even worse when the global warming isn't expressed across the British Isles! -
Dennis at 00:39 AM on 7 January 2011Graphs from the Zombie Wars
I'll add my agreement to the emerging consensus here about the difficulties when trying to discuss science with the Zombies. The different ways the data are presented here is excellent. And the analysis has been great. Yes, there are issues to deal with which makes this, like every other branch of natural science, imperfect. The chart with the correlation coefficient r = .89 is a persuasive tool. The author is correct in pointing out the imperfections of this -- it's not appropriate for prime time in a peer-reviewed journal -- but it does make a compelling visual. But when a Zombie comes along as says "I'm not convinced," the natural inclination of the scientific community is to move deeper. We make a good faith effort to convince him/her. I.e., we say, read this and this and this and so on. We stick with the science and attempt to build on the knowledge. But the Zombie typically just repeats "I'm not convinced." At this point, it would be enough to say we're just not getting through to you. Unfortunately, the Zombies typically apply a double standard. Zombie sites like WUWT regularly put up flawed analyses and the Zombies are silent on all the errors that are easy to spot up there. If the Zombies were genuine in applying their "I'm not convinced" statement to science, they'd be all over a site like WUWT pointing out the flaws. But they're not. I'd like to hear them explain why not. -
skywatcher at 00:25 AM on 7 January 2011Graphs from the Zombie Wars
sorry Keith, your name isn't 'The Numerate Historian'! major oops... -
skywatcher at 00:23 AM on 7 January 2011Graphs from the Zombie Wars
Nice graphs TNH! I'll repeat what others have mentioned, that your numbers come in at the low end of climate sensitivity, because you are estimating the transient sensitivity, rather than the equilibrium sensitivity, which will be a bit higher (maybe a lot higher). The Zombie Wars are an annoying place. Having been a scientist for 10 years, you get used to having (mostly) reasonable and rational discussions with colleagues, in places where evidence has a great deal of value. These concersations can be quite strong, and the disagreements can be significant, but evidence is respected. There's a reason why no respected climate scientist doubt that the Earth is warming by a significant amount as a consequence of human GHG emissions - because the weight of evidence is so strong that alternative positions are untenable. Debates about the finer points of coutse carry on, say exactly how the ice sheets are responding, how to monitor them, the value of equilibrium forcing, and numerous other detailed and challenging questions. Zombies just don't get that, because they do not have the ability to weigh up the evidence in an impartial scientific manner. Many times I've said to a climate zombie "I wish your argument was right". Most scientists wish the premise of the zombie arguments was right, and of course would give anything to be the first to publish that result with research-quality evidence - sadly that evidence appears not to exist, and we are forced to accept the unhappy alternative, our reality. But zombies are not scientists, or if they claim to be, they are not applying their scientific training to this problem. -
tobyjoyce at 23:25 PM on 6 January 2011Graphs from the Zombie Wars
David Horton @21, I am afraid you are right (Sigh). -
Alexandre at 23:17 PM on 6 January 2011Graphs from the Zombie Wars
perseus #5 A few months ago I tried to find emission inventories or at least the total emissions of CO2e from each country, including land use emissions. No success. Those are indeed very difficult data to find. Do they exist somewhere? -
Alexandre at 22:58 PM on 6 January 2011Graphs from the Zombie Wars
I've had my days of naively engaging in such Zombie Wars. It can be rather frustrating. Like others above, I've seen people declare themselves as "humble truth seekers", while actively tried to stay away from any explanation of the physics, just to move on to the next denier blog claim. Denier blogs, btw, are parroted without any questioning, while any evidence is dismissed as faulty, fraudulent, or just ignored for lack of understanding. I wonder how much of this attitude is responsible for the present mitigation policy paralysis. Is it important or just a loud stubborn ignorance of a few? -
tobyw at 22:55 PM on 6 January 2011Graphs from the Zombie Wars
Looks like two major up-legs with two minor down-legs to me - with perhaps a third down-leg beginning. http://www.skepticalscience.com/pics/CO2.png -
Anne-Marie Blackburn at 22:36 PM on 6 January 2011Understanding the CO2 lag in past climate change
Sorry, it should read 'This doesn't mean that CO2 cannot be responsible for current warming'. -
David Horton at 22:26 PM on 6 January 2011Graphs from the Zombie Wars
Tobyjoyce Miekol answers your question "I remain waiting to be convinced either way as regards whether or not CO2 produced by man is a problem. " You say "even the legendary Doubting Thomas had a bottom line. What is yours? " For deniers there is no bottom line. There is no evidence. No facts. No data. No physics. There is simply endless denial, because it bears no relationship to scientific enquiry. "Being a contrarian cannot be just an article of faith"? Being a contrarian is simply an article of faith. -
Anne-Marie Blackburn at 22:22 PM on 6 January 2011Understanding the CO2 lag in past climate change
gallopingcamel If you read my post again, you will see that the first sentence of the final paragraph states that CO2 did not initiate the shifts towards interglacials during the past 400,000 years. This does not mean that CO2 isn't responsible for current warming. Scientists are looking at current data and observations to draw their conclusions, not what may have happened in the past. -
macwithoutfries at 21:59 PM on 6 January 2011Graphs from the Zombie Wars
Very good stuff explained in very simple terms! Regarding the estimate on climate sensitivity to CO2 forcing - the resulting numbers have a better than 90% chance to be (far) too low - since the formula assumes that we have already reached the equilibrium point for the current forcing, but that is absolutely certain not the case and if today we would stop increasing CO2 we would still have 20-50 years before reaching the equilibrium point and at that point the calculated sensitivity could potentially be 2-3 times bigger!
Prev 2001 2002 2003 2004 2005 2006 2007 2008 2009 2010 2011 2012 2013 2014 2015 2016 Next


