


 Arguments


Recent Comments
Prev 2004 2005 2006 2007 2008 2009 2010 2011 2012 2013 2014 2015 2016 2017 2018 2019 Next
Comments 100551 to 100600:
-
JMurphy at 00:32 AM on 6 January 2011Not So Cool Predictions
I can't keep up with those in denial about AGW, the latest hypocrisy being a made-up consensus...from the same people who have always railed against consensus because it allows them to favour the individuals whom they can then compare to Galileo, etc. Or, rather, because they had to dismiss the views of the majority of science and scientists because they didn't agree with what they were saying. Now, their made-up consensus is, apparently, the true sign of scientific thinking ! And what are they basing their made-up consensus on, if it's not temperature readings - those same temperature readings that were previously so unbelievable that they had to come up with all sorts of strange criticisms, ranging from urban heat, to fraud, to conspiracy. Now, though, those temperature readings are being abused to try to give them what they want to see. But which temperature readings do they trust these days ? It used to be Spencer and Christy's satellites but now, because they are showing too much heat for the so-called skeptics' liking, they are falling back on CRU's figures - the ones that were previously accused of fraud, etc - because they don't include the warm regions of the Arctic...and are therefore more likely to show lower temperatures. Possibly. Can anyone actually keep up with these people anymore ? -
Eric (skeptic) at 00:24 AM on 6 January 2011Understanding the CO2 lag in past climate change
The complexity of the climate system actually makes it simple: CO2 increases have less ultimate temperature feedback than during the glacial to interglacial time. IOW, as the temperate zones thaw, the earth warms through both CO2 -> temperature and temperature -> WV -> temperature. The effect of more CO2 in the current climate is CO2 -> temperature (with temperature -> WV being much weaker now than during glacial periods). -
Arkadiusz Semczyszak at 23:19 PM on 5 January 2011A Positive Outlook For Clouds
Global warming due to increasing absorbed solar radiation, Trenberth and Fasullo, 2009.: “While there is a large increase in the greenhouse effect from increasing greenhouse gases and water vapor (as a feedback), this is offset to a large degree by a decreasing greenhouse effect from reducing cloud cover and increasing radiative emissions from higher temperatures. Instead the main warming from an energy budget standpoint comes from increases in absorbed solar radiation that stem directly from the decreasing cloud amounts.” “Sake of completeness.” Low clouds (especially in high latitudes) may also have a positive RF - Observational and Model Evidence for Positive Low-Level Cloud Feedback, Clement, and Burgman, 2010., (cited in paper A.D.) with these caveats: Comment on “Observational and Model Evidence for Positive Low-Level Cloud Feedback”, Broccoli and Klein, 2010. : „... using more complete model output, indicates better agreement with observations, suggesting that more detailed analysis of climate model simulations is necessary.” Another problem is that aerosols and clouds: Europe. Decline of fog, mist and haze in Europe over the past 30, Vautard , Yiou & van Oldenborgh, 2009.: “These variations presumably result from changes in aerosol burden and clouds ...” “Over Europe, the marked solar radiation increase since the 1980s is thought to have contributed to the observed large continental warming ...”, “This decline is spatially and temporally correlated with trends in sulphur dioxide emissions, suggesting a significant contribution of air-quality improvements.” “Statistically linking local visibility changes with temperature variations, we estimate that the reduction in low-visibility conditions could have contributed on average to about 10–20 % of Europe's recent daytime warming and to about 50 % of eastern European warming.” Years of 80th, however, the volcanic eruption of El Chichon. Globally, however, there is no simple correlation between aerosols and clouds - Consistency of global satellite-derived aerosol and cloud data sets with recent brightening observations., Cermak et al., 2010.: “In a period from the mid-1980s to the mid-2000s, aerosol optical depth is found to have started declining in the early 1990s [Mt. Pinatubo], while cloud data sets do not agree on trends.” Because not everyone aerosol increases the amount of clouds (as well as DSM). Can aerosol decrease cloud lifetime?, Small et al., 2009.: “... (ii) the “lifetime effect” whereby anthropogenic aerosol suppresses precipitation and results in clouds with more liquid water, higher fractional cloudiness, and longer lifetimes. Based on new observations presented here, and supported by previous fine-scale modeling studies, we suggest that the balance of evidence shows that non-precipitating cumulus clouds can experience an evaporation-entrainment feedback, and respond to aerosol perturbations in a manner inconsistent with the traditional “lifetime effect.” This is confirmed by other regional examples: Significant decadal brightening of downwelling shortwave in the continental United States, Long et al., 2009.: “We show that widespread brightening has occurred over the continental United States as represented by these measurements over the 12 years of the study, averaging about 8 W m −2 /decade for the all‐sky shortwave and 5 W m −2 /decade for the clear‐sky shortwave. This all‐sky increase is substantially greater than the 2 W m −2 /decade previously reported over much more of the globe as represented by data from the Global Energy Balance Archive spanning 1986–2000 and is more than twice the magnitude of the corresponding 1986–2000 2–3 W m −2 /decade increase in downwelling longwave.” Global Brightening over the Continental US, NASA, 2008.: “Brightening is commonly attributed to decreasing aerosol optical depth. However, these new results show that reductions in dry aerosols and/or direct aerosol effects alone cannot explain even half of the brightening. Changes in cloudiness play the dominant role. And the subtropics: Subtropical Low Cloud Response to a Warmer Climate in an Superparameterized Climate Model, Wyant, Bretherton and Blossey, 2009.: “Intriguingly, SP-CAM shows substantial low cloud increases over the subtropical oceans in the warmer climate.” Regional changes in cloud cover (such as the above) can be ignored by global models - and can affect (is significant) on the balance of RF cloudiness. -
Bart Verheggen at 21:11 PM on 5 January 2011A retrospective of the Climategate retrospectives
After my rant about what a distasteful act this was, I tried to balance that out by also looking at what we could possibly learn from this affair (or what came into clearer focus): http://ourchangingclimate.wordpress.com/2010/11/23/climategate-lessons-learned/ - There’s no strong relation between knowledge/information and people’s perceptions: Just the facts won’t do. - Values and ideals clash in public climate discussions, and this greatly affects the perception and communication of the science. - The animosity towards climate science is even greater and more widespread than we thought it was. - There are many other aspects besides science that influence one’s policy preferences. - The need for increased transparency and openness of data and code is now widely shared. - Citizen science has taken off over the last year. - Don’t let your anger or frustration shine through in your communication. It doesn’t go over well (except with people who share your PoV). - We should rethink our communication strategy (which one? exactly.) Even when we get more angry because of such events, I think we should try to minimize our venging of anger (note to self: me too). As difficult at it is, we should probably try to be more respectful to those who are critical of the science for whatever reason, even if they don't pay us that respect. A very difficult cookie to swallow, but I think it's the only way to have science regain its deserved credibility. Going full attack mode as some favour will beakfire, as "climategate" has shown. -
cynicus at 20:38 PM on 5 January 2011Not So Cool Predictions
Potholer54 also has a nice video on the "Gulf stream has stoppe, a new Ice Age is imminent" media story. -
Paul D at 20:01 PM on 5 January 2011Understanding the CO2 lag in past climate change
galloping camel@13 said: "Cause precedes effect. Get used to it." However complexity and time, can create different causes and switch a cause around to an effect and visa versa. It is naive to assume that a cause at one point in time, will still be a cause at another point in time. Ironically it is usually skeptics that emphasise the fact that we have a complex system to analyse, yet bury that philosophy when wanting a simple answer that fits their perspective. In fact, the change in materials and processes from causing an effect, to being the effect of a cause is probably employed in many inventions that benefit humanity. The cycle of the internal combustion engine comes to mind, or a jet engine, they both depend on a cycle in which a cause, produces an effect which then becomes a cause for the next effect and so on until the original cause finally becomes an effect. When a problem occurs in the cycle of causes and effects, the machines operation changes or stops completely. In a simple world, you have a cause and that produces an effect, end of story. We don't live in a simple world. -
Rob Painting at 19:57 PM on 5 January 2011Understanding the CO2 lag in past climate change
Polar Bear @ 9 Shimkus of Illinois............I think in the age of the dinosaurs, where we had most flora and fauna...... Well perhaps not.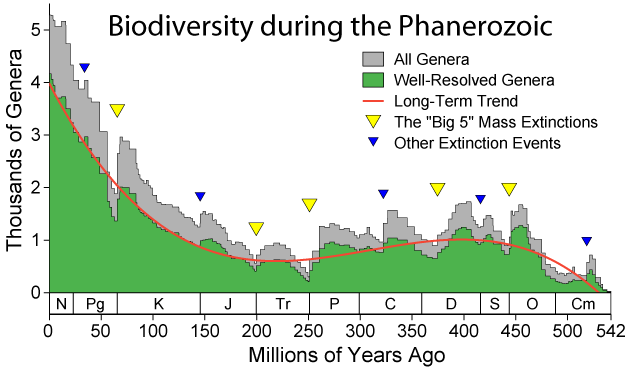 Where does he (Shimkus) get these ideas??
I have a hypothesis, but the comments policy precludes me from elaborating further.
Where does he (Shimkus) get these ideas??
I have a hypothesis, but the comments policy precludes me from elaborating further.
-
Alec Cowan at 19:22 PM on 5 January 2011Understanding the CO2 lag in past climate change
@galloping camel #13 Really? Sure, the patient didn't die from gangrene because he rotted mostly after he had died. -
Marcus at 18:57 PM on 5 January 2011Understanding the CO2 lag in past climate change
Gary Thompson, to the best of my knowledge, the next glacial period isn't due for several *thousand* years, possibly even more than 10,000 years-so your claim is without foundation. As others have already pointed out, why do people like yourself still running around claiming temperatures are "stable", when even a brief analysis shows that they're rising with unprecedented speeds (+0.12 degrees per decade since 1950, & +0.16 degrees per decade since 1980)-with no indication of a slowdown. I do wish people would try & get their *basic* facts right before posting on these boards. -
Marcus at 18:52 PM on 5 January 2011Understanding the CO2 lag in past climate change
Of course, Congressman Shimkus ignores a few critical issues. First is that that, when CO2 levels were at their highest, the bulk of all fauna & flora was still *Beneath* the Ocean. Second, the plant & animal life that did exist on land during these eras had evolved-over *millions* of years to be able to thrive in a higher CO2, higher temperature paradigm. Third, that the shape of our land-masses & oceans was significantly different to those today-& that must be taken into account when considering whether high CO2 levels today will have a damaging impact on our planet. Still, good to see the usual flimsy "logic" coming out of the so-called skeptic camp. -
Glenn Tamblyn at 18:41 PM on 5 January 2011Understanding the CO2 lag in past climate change
garythompson See some of my comments to TIS. The behaviour at different stages of a glacial cycle can be complex and differ from cycle to cycle. For example, starting at the bottom of a cycle, ice sheet retreat is an important factor, replacing reflective ice with darker land and ocean. However retreat for huge ice sheets takes a long and depends on the extent of the ice sheets in different parts of the world, the underlying topography as they retreat etc. So ice sheet retreat is likely to be a slow, lagging forcing. Conversely, coming out of an Inter-Glacial, as things start to cool, a wider extent of snow fall can also have a big impact - a thin layer of snow has similar reflectivity to a massive ice sheet. So as some cooling progresses, expansion of snow cover can be a rapid cooling forcing, not a slo lagging one. So the behaviour of ice is potentially a major factor in the difference between the warming and cooling cycles. -
Glenn Tamblyn at 18:33 PM on 5 January 2011Understanding the CO2 lag in past climate change
The Inconvenient Skeptic #1 & #6 John Sorry to have not continued our discussion recently - technology problems have kept me off the air. Currently I am sitting in a cafe writing this. "If CO2 isn't a significant factor, the concentration that is 400ppm instead of 270 ppm doesn't really matter.....According to the Vostok record the temperature dropped 6C while CO2 levels were stable. If elevated CO2 levels caused the warming, then the Earth would not have cooled." We have had this discussion before John and I pointed out the fallacy of your reasoning then. You are comparing ppm levels and using language like 'significant factor', 'CO2 levels caused the warming'. Your argument is based on imprecise use of language and failing to compare forcings quantitatively. Multiple factors influence the progression through Ice Age cycles - Orbital changes, Methane, CO2, Albedo change due to ice sheet variations, Albedo change due to changes in vegetation patterns etc Many of these factors can be estimated and quantified and they support this general understanding. CO2 is one factor that mattered then, but not the only one. As I have pointed out in an early discussion we had, when there are multiple factors, not all of them may be forcing in the same direction. As I pointed out to you, during the Holocene CO2 levels only varied by about 20 ppm until recent times. Milankovitch was stronger. How NET forcing varies depends on the sum of all of them. CO2 can remain stable, or even rise somewhat such as during the Holocene, but if other forcings are working against it then they can dominate. Not because CO2's impact is small, period. But because it's impact is only one part of all the impacts in THAT context. In a different context such as today, its percentage contribution is different. Understand CO2's quantitative impact in one context so we can calculate its quantitaive impact in a different context. You mention the Eemian, the exit from an inter-glacial before our current one. We have also discussed the behaviour over the Holocene. If you want to argue about what 'the data' tells us then you need to provide the data that matters. Not simply the temp vs atmospheric level figures for CO2. Rather the Temp vs Forcing data for multiple factors. The relative forcing associated with these various factors and thus their relative significance. Not every Milankovitch cycle is the same so the magnitude of the forcing variation varies from cycle to cycle. Similarly you aren't discussing changes in Methane levels. Also, look at the first figure shown by Anne Marie. The CO2-Temp relationship is different for each one. Because each cycle has different particular circumstances. In your posts you are also repeating something I have pointed out to you before, a failure to distinguish between the significance of what a 'level' means, and the significance of what a 'change of level' means. This comment 'If elevated CO2 levels caused the warming, then the Earth would not have cooled.'! Whether they are elevated or not isn't the point. It is change in the level that matters in producuing a forcing. And even then this goes into the mix of other factors that can all produce forcings. If CO2 behaved in the past in ways consistant with our understanding of its behaviour, then we can project that behaviour onto what we expect to see today. If you feel that the Ice Core record casts doubt on this, show us the calculations. Show us some calculations of forcing changes over the Ice Core record for Milankovitch, CO2, Methane, Albedo etc. Show that CO2's behaviour from that record is inconsistent with what we expect from current radiative physics. You are an engineer John, but much of what you have argued here and on your blog uses qualitative arguments. Put some meat on the bones of your argument. Do the math. Show us how the forcings change and that CO2's contribution doesn't match expectations "Or are you simply using strawman as a method of avoiding the data from the end of the Eemian?" No John, they pointed out the strawman in your claim which is fundamentally a mis-statement of what CO2's effect is 'expected' to be. A Strawman Argument is about creating a false expectation that can then be 'knocked down'. -
archiesteel at 18:15 PM on 5 January 2011Scientists tried to 'hide the decline' in global temperature
I like the part where Fred Staples completely ignores counter-arguments in order to repost a variation of his original (incorrect) statement. Contrarians are like broken records. -
lurgee at 17:53 PM on 5 January 2011Understanding the CO2 lag in past climate change
@ Garythompson "and why did temps decrease around 130k years ago while CO2 remiained high?" I'm a rank amateur, but I'd question the accuracy of the ice core on that point. They measure CO2 levels from air bubbles trapped in ice. There's always going to be a margin of error in that, because the air bubbles will be formed in older snow, and it's doubtful how accurately thousands of years of variation can be recorded in a few metres of ice. Also, looking at a single ice core is a bit like looking at a single thermometer - you can't really be sure how much is local variation, how much is global, and how much is just confusion and noise. -
Daniel Bailey at 17:11 PM on 5 January 2011Understanding the CO2 lag in past climate change
Re: garythompson (12) "...why are our temps stable?" They are not. They are rising. "Is the excess CO2 preventing the next glacial?"
Looks that way. See here.
"Over the past 400k years we've seen a periodic steep increase in temps followed by a steep temp decrease (glacial) but we have avoided that somehow. why?"
Interglacial length/duration does have some variably associated with it, but all signs were pointing to a long (on a human scale, not a geologic scale), slow decline into a resumption of the current ice age. Until mankind intervened with its fossil fuel CO2 emissions.
"Why did temps decrease around 130k years ago while CO2 remiained high?"
In times previous to our civilization, CO2 acted as a feedback to temps. When orbital conditions caused a warming of temps, warming oceans outgassed more CO2, enhancing the natural warming going on (hence the quick rise out of glacial conditions into interglacials). Then, as orbital conditions changed, temperatures fell. CO2 lagged behind temps because sequestration of CO2 is a slow process, requiring tens of thousands of years. CO2 concentrations now have risen so quickly that CO2 is acting as a forcing to climate, causing the global temps to rise, which in turn cause other feedbacks to kick in, which in turn causes CO2 levels to rise further. Manmade CO2 concentrations are the big driver here, though. Gross 30 billion tons, of which the environment manages to do with about half (causing other issues, like ocean acidification), for a net increase of about 15 billion tons per year. Or about a 2 PPM yearly increase in atmospheric concentrations (the rate of increase itself is also increasing).
Hope this helps,
The Yooper
"Is the excess CO2 preventing the next glacial?"
Looks that way. See here.
"Over the past 400k years we've seen a periodic steep increase in temps followed by a steep temp decrease (glacial) but we have avoided that somehow. why?"
Interglacial length/duration does have some variably associated with it, but all signs were pointing to a long (on a human scale, not a geologic scale), slow decline into a resumption of the current ice age. Until mankind intervened with its fossil fuel CO2 emissions.
"Why did temps decrease around 130k years ago while CO2 remiained high?"
In times previous to our civilization, CO2 acted as a feedback to temps. When orbital conditions caused a warming of temps, warming oceans outgassed more CO2, enhancing the natural warming going on (hence the quick rise out of glacial conditions into interglacials). Then, as orbital conditions changed, temperatures fell. CO2 lagged behind temps because sequestration of CO2 is a slow process, requiring tens of thousands of years. CO2 concentrations now have risen so quickly that CO2 is acting as a forcing to climate, causing the global temps to rise, which in turn cause other feedbacks to kick in, which in turn causes CO2 levels to rise further. Manmade CO2 concentrations are the big driver here, though. Gross 30 billion tons, of which the environment manages to do with about half (causing other issues, like ocean acidification), for a net increase of about 15 billion tons per year. Or about a 2 PPM yearly increase in atmospheric concentrations (the rate of increase itself is also increasing).
Hope this helps,
The Yooper
-
gallopingcamel at 17:09 PM on 5 January 2011Understanding the CO2 lag in past climate change
The tortured logic by Ms. Blackburn and Jeffrey Severinghaus are good examples of the nonsense that surrounds CAGW dogma. Cause precedes effect. Get used to it.Moderator Response: [Daniel Bailey] Respectfully, GC, you are quite wrong on the "cause precedes effect" trolling comment you made. We know why conditions were the way they were in the past. Just as we know why conditions are different today, with CO2 acting as a forcing instead of its usual feedback to temps. But being wrong doesn't give you leave to be rude. Find a way to respectfully disagree. Or... -
kdkd at 17:02 PM on 5 January 2011Scientists tried to 'hide the decline' in global temperature
KL #2 "We know what 'the decline' is. It is the decline in tree ring proxy temperatures after about 1960." No it is not. It's the decline in reliability of the tree ring proxy temperatures when compared to the instrumental record after about 1960. -
garythompson at 16:51 PM on 5 January 2011Understanding the CO2 lag in past climate change
i am very familiar with this vostok ice core graph and i've always wondered why the 'noise' in our present time appears. i.e. we appear to be stabilized between an interglacial and a glacial and while the chart 'predicts' a glacial we are hovering around our current level of global temperatures. CO2 is continuing to rise as is evidenced by the mauna loa readings but why are our temps stable? is the excess CO2 preventing the next glacial? over the past 400k years we've seen a periodic steep increase in temps followed by a steep temp decrease (glacial) but we have avoided that somehow. why? and why did temps decrease around 130k years ago while CO2 remiained high? -
hfranzen at 16:13 PM on 5 January 2011The Physical Chemistry of Carbon Dioxide Absorption
An addition to my response to #29: I certainly agree that I am not in any way capable of considering how the GHG energy is distributed over the earth, and I say that in everything I write. I report the forcing temperature increase because that is the conventional way these results are reported, but for the earth-year average that is just one way of giving the net energy increase. You are complettly correct that I should leave to others the question of the effects of the energy on different areas of the earth. and I do. -
hfranzen at 16:06 PM on 5 January 2011The Physical Chemistry of Carbon Dioxide Absorption
Response to #31: The number that I get (.014 K/yr)is what comes out of the calculation. I do not know where your 1.25ln(1.78)/ln2 comes from so I cannot make a comparison. I do know that my number comes from a quite accurate calculation of the broad-band, diffuse, transmittance and that it is directly related to the GHG flux at the earth's surface. I have seen numbers very similar to 0.014 K/yr quoted for the CO2 forcing, but I don't rememeber where. If you think that your formula is an improvement on the basic science I have presented I would very much like to see how it is developed. On the other hand, I think the two results for CO2 forcing (1 degree and 1.4 degree) are both indicative of a serious warming. -
hfranzen at 15:46 PM on 5 January 2011The Physical Chemistry of Carbon Dioxide Absorption
Response to #29: The last steps of GWPPT6 are based upon a steady state for the earth-year average: energy in equals energy out. If, over the earth and over a year, more energy is coming in to the earth (which is the case because of the increase in CO2 in the atmosphere and the GHG effect)more energy must go out. The energy that goes out increases as the fourth power of the temperature. Therefore the increased temperature from year to year is directly calculable from the increased GHG effect for the earth-year average. The temperarure effects you mention (wind, waves, phase transitions) are irrelevant to the total energy in-energy out for the total earth. -
iana at 15:45 PM on 5 January 2011Understanding the CO2 lag in past climate change
Hi In the first graph, what year is 'present'?Moderator Response: [Daniel Bailey] It's my understanding that the ice core record graphics typically use 1950 for their "year zero" baseline unless otherwise specified. See the response in comment 3 above for a somewhat updated version. -
dhogaza at 15:40 PM on 5 January 2011Understanding the CO2 lag in past climate change
"The Inconvenient Skeptic" is simply repeating the stupidity that climate science presumes that *only* CO2 affects climate, and changes in solar insolation does not. TIS: climate science doesn't claim that. What you are doing is known as making a "strawman argument". The difference between now and the prehistorical times you mention is very simple: Back then, fossil fuel wasn't being burned in ever increasing quantities. It's so tiring to hear people claim, in essence, that if one burns hydrocarbons, the resulting CO2 doesn't end up in the atmosphere. Where do you think it ends up? ( -edit- )Moderator Response: [Daniel Bailey] Be nice. No need for a tactical nuke when a 2x4 will suffice. -
Polar Bear at 15:00 PM on 5 January 2011Understanding the CO2 lag in past climate change
Democracy Now reported Congressman Shimkus of Illinois will be the head of the subcommittee on environment and economy.He said in 2009:Today we have about 388 parts per million in the atmosphere. I think in the age of the dinosaurs, where we had most flora and fauna, we were probably at 4,000 parts per million. There is a theological debate that this is a carbon-starved planet—not too much carbon. Where does he get these ideas?? -
pdt at 14:54 PM on 5 January 2011Understanding the CO2 lag in past climate change
#6 The Inconvenient Skeptic: Is it possible that more than one thing can cause the earth to warm or cool? Is it possible that something else changed while the CO2 concentration was stable during a period when the earth cooled? -
muoncounter at 14:54 PM on 5 January 2011Understanding the CO2 lag in past climate change
#6: "If CO2 isn't a significant factor... " If you've reached that conclusion, you haven't been paying attention. Read the paragraph under Fig. 1 above again. "elevated CO2 levels in the past ... " The strawman is by your choice of one aspect in a complicated story. Elevated? compared to today, no. Elevated while the earth cooled because of a change in orbital parameters that initially overwhelmed the effect of atmospheric CO2. "If elevated CO2 levels caused the warming ... " In #1, you asked us to discount the glacial terminations, now here they are as part of your argument. Bad choice, as the literature doesn't support you: The overall correlation between our CO2 and CH4 records and the Antarctic isotopic temperature is remarkable (r^2 = 0.71 and 0.73 for CO2 and CH4, respectively). This high correlation indicates that CO2 and CH4 may have contributed to the glacial–interglacial changes over this entire period by amplifying the orbital forcing... -
The Inconvenient Skeptic at 14:08 PM on 5 January 2011Understanding the CO2 lag in past climate change
All, If CO2 isn't a significant factor, the concentration that is 400ppm instead of 270 ppm doesn't really matter. Phila, Is it strawman to point out that elevated CO2 levels in the past existed while the Earth dramatically cooled? According to the Vostok record the temperature dropped 6C while CO2 levels were stable. If elevated CO2 levels caused the warming, then the Earth would not have cooled. Or are you simply using strawman as a method of avoiding the data from the end of the Eemian? -
Miriam O'Brien (Sou) at 13:52 PM on 5 January 2011Understanding the CO2 lag in past climate change
Thanks, Daniel. Would you give me permission to use that image elsewhere (with credit to you and skepticalscience.com)? It's a very stark reminder of what we're doing.Response: [Daniel Bailey] Not mine to give permission for. However, the SkS version is here. See the Creative Commons language there for fair usage. Thanks!
[John Cook] I've added CO2 History to our list of Climate Graphics. It's under a Creative Commons licence so you're free to use it elsewhere:

-
muoncounter at 13:34 PM on 5 January 2011Scientists tried to 'hide the decline' in global temperature
#6: "the relentless propaganda... " If quotes from 1999 and 2004 are all you've got to show relentless propaganda, you don't have much. FYI, relentless means (of pace or intensity) sustained; unremitting. Meanwhile, nothing about these 'tricks' changed any of the basic facts. See, for example, Did global warming stop in 1998? and the more recent Did global warming stop in ____fill in the blank with year of your choice___? If it's propaganda in today's world you want, look here. The lead article has tropical cyclone activity reaching a new low (ask our friends in Queensland how that's working out). Even better, look here. Dr. Singer is at it again: “the number of skeptical qualified scientists has been growing steadily; I would guess it is about 40% now.” -
Phila at 13:33 PM on 5 January 2011Understanding the CO2 lag in past climate change
TIS says: the forcing effect of CO2 is not the critical factor in the glacial cycles. Anne-Marie says: The only conclusion that can be reached from the observed lag between CO2 and temperatures in the past 400,000 years is that CO2 did not initiate the shifts towards interglacials. Is it my imagination, or has yet another "skeptic" erected yet another strawman? -
Daniel Bailey at 13:25 PM on 5 January 2011We're heading into an ice age
Re: Blueflash (210) 1. Read the study (petit et al 1999) 2. IBID. Then read this. 3. You expect all glacial epochs to be Xerox copies? 4. 450,000 years of data, multiple cores. Say what you want, but it doesn't change the fact that that's an awful lot of years and even more snowflakes. Humans do a pretty good job at understanding past and present ongoing climate change and predicting future climate changes. Strawmen distractions about off-topic supervolcano's aside (we are overdue for a Yellowstone blow, tho), human beings are pretty capable of screwing the planet up. Get used to it. The Yooper -
muoncounter at 13:21 PM on 5 January 2011We're heading into an ice age
#210: "if the graph was drawn with uniform granularity..." If the graph was drawn uniformly, it would be a misrepresentation of the data. The time resolution of an ice core (and many conventional cores) decreases as you move downhole (older). Petit et al 1999 is the classic description of how these data are obtained. The mean resolution of the CO2 (CH4) profile is about 1,500 (950) years. It goes up to about 6,000 years for CO2 in the fractured zones and in the bottom part of the record "... only really 5 samples of interglacials represented here and that really isn't much of a data set." Why is this a concern? This isn't a pattern matching exercise. -
Blueflash at 12:46 PM on 5 January 2011We're heading into an ice age
Here is the full graph. Shows a more similar curve between 430,000 years ago and now: http://commons.wikimedia.org/wiki/File:Ice_Age_Temperature.pngModerator Response: [Daniel Bailey] Not so similar. Remember that ice core temperature reconstructions use 1950 as year zero. Here's what that would look like if CO2 were extended to today's levels (I do seem to be having to show this illustration a lot lately!):
-
Miriam O'Brien (Sou) at 12:39 PM on 5 January 2011Understanding the CO2 lag in past climate change
Pity that the chart doesn't show today's CO2 levels. That really puts the cat among the pigeons!Moderator Response: [Daniel Bailey] Try this one then: -
Blueflash at 12:38 PM on 5 January 2011We're heading into an ice age
Perhaps I'm missing something,but several things jump out of this graph: 1) The data only goes back about 430,000 years, yet the axis goes back 450,000 years. Why? To me it looks as though someone has removed the first part of the line. I'm not saying they did, but such things do happen from time to time. In this instance it's a fairly critical question because the interglacial that occurs at the left of this graph is allegedly the closest fit to the one we have now in terms of the alignment of the planet. 2) It is apparent that the later data is at a high level of granularity than the more recent data, you can see this by the spikiness (thickness) of the line. This is not surprising because the closer we get to the present the more data we have. However it does somewhat skew one's perception of the graph because when we look at 430,000 years ago compared with now, we are not - in graph terms - comparing apples with apples, due to the granularity difference. I strongly suspect that if the graph was drawn with uniform granularity then the temp change 430,000 years ago would appear more similar to the present temp change. 3) The temp peak in this current interglacial is presently a very thin one at 2C. Other than that the temp appears to be hovering somewhere between 0-1C, this is actually lower than in pervious interglacials, all of which peak between 2-4C. 4) There are only really 5 samples of interglacials represented here and that really isn't much of a data set. Now I fully appreciate that this can;t be help given the time periods in question, but it doesn't change the fact that there are only 5 samples for comparison. Humans are as yet hopeless at predicting localised weather let alone the climate. This doesn't mean people shouldn't try but perhaps they should hold back predicting catastrophes until we have a better understanding. For all we know the super volcano in Yellowstone National Park could go off in a few decades and that would really throw a spanner into the works. The Earth is a living planet, and nature takes no prisoners. Personally I am glad of all this hoo-har over climate change because if nothing else it is teaching people not to mess around with nature. Unfortunately that doesn't mean that won't mess around with us and everything else on this planet. If nature chooses to make some changes then - take note kids - human beings are powerless to do anything about that. Get used to it. In LVX -
michael sweet at 12:29 PM on 5 January 2011Understanding the CO2 lag in past climate change
TIS: As the article points out, CO2 was not a forcing in the past. It was a feedback to the solar forcings. CO2 can be both a feedback and a forcing. In the past CO2 was a feedback. The situation today is that CO2 is the forcing. The data showing CO2 lag indicate that the solar forcing started the cycle and the CO2 feedback makes the cycle stronger. Since CO2 is the forcing today its effects are different from what was seen in the past. -
The Inconvenient Skeptic at 12:16 PM on 5 January 2011Understanding the CO2 lag in past climate change
The lag at the beginning of an interglacial is not overly useful for determining the impact of CO2 on the temperatures. Far more interesting is the end of the interglacials. At the end of the Eemian CO2 was above 260 ppm until ~112 kybp. Temperatures had been dropping for more than 10,000 years before the cooling oceans was sufficient to reduce the amount of CO2 in the atmosphere. Forget the beginning of the interglacial periods to determine the importance of "warming." The fact that the interglacials end with CO2 already elevated indicates that the forcing effect of CO2 is not the critical factor in the glacial cycles. Solar insolation leads the global temperature which leads the CO2 levels both at the beginning and end of the interglacials. -
Daniel Bailey at 10:23 AM on 5 January 2011Back from the Dead: Lost Open Mind Posts
Added 5 more posts from November, 2006:Nov 8, 2006 Tales from the Thermometer Nov 9, 2006 Hockey Sticks Nov 10, 2006 CO2: They call it "life"... Nov 10, 2006 For the Love of it! Nov 11, 2006 Days of Wine and Roses
The Yooper -
Scientists tried to 'hide the decline' in global temperature
The entire Dr. Mann comment can be found here on RealClimate - search for "graft" to see it. To quote one of the next lines: "Often, as in the comparisons we show on this site, the instrumental record (which extends to present) is shown along with the reconstructions, and clearly distinguished from them (e.g. highlighted in red as here)...(again see the comparisons here, with the instrumental record clearly distinguished in red, the proxy reconstructions indicated by e.g. blue or green, and the uncertainties indicated by shading)" The extra detail is quite informative. -
tobyjoyce at 09:46 AM on 5 January 2011A retrospective of the Climategate retrospectives
dorlomin, Yes, I think we know how this will play out. Sometime in the future a serious weather/ climate disaster will just make it all so obvious. Unfortunately, a series of minor disasters can be easily hidden on the back pages, so it will have to be a major showstopper. Like the British Appeasers after 1939, or the American Isolationists after Pearl Harbor, suddenly denialism will disappear. Not that denialists will disappear, especially the political ones. What's the betting many will become more climate-hawkish than the climate hawks? Suddenly they will "always have believed in the science". I only hope too much damage has not been done, and that it is not too late, when this comes about. -
Albatross at 09:25 AM on 5 January 2011The 2010 Climate B.S.* of the Year Award
Tim @86, OMG, you have to be kidding me. Argue strawmen much TTT? "This is about rubbishing Lindzen because he made a claim that most people dont even begin to understand." Except you, of course. And this is not about "rubbishing Lindzen"-- as has been explained to you several times now, it is about Lindzen engaging in B.S. The responsibility for that lies with him, and him alone. But if you insist on fighting his battles for him, the ball is now in your court to provide hard scientific evidence (not musings about hypotheticals or what ifs) which supports Lindzen's claim. So either put up, or please do shut up. "Lindzen's responses were very brief and he went into no detail" Exactly-- he made a baseless and unsubstantiated claim. He could have also submitted follow-up evidence in writing after the hearings to support his baseless assertions made at the hearing. He has, to my knowledge, not done that. The planet is warming TTT, deal with it. -
mclamb6 at 09:22 AM on 5 January 2011Scientists tried to 'hide the decline' in global temperature
Fred, Why don't you post the entirety of Mr. Mann's comment? -
Fred Staples at 09:05 AM on 5 January 2011Scientists tried to 'hide the decline' in global temperature
Phil Jones 16th November 1999 “I’ve just completed Mike’s Nature trick of adding in the real temps to each series for the last 20 years (ie from 1981 onwards) and from 1961 for Keith’s to hide the decline.” Michael Mann December 2004 “No researchers in this field have ever, to our knowledge, “grafted the thermometer record onto” any reconstrution. It is somewhat disappointing to find this specious claim (which we usually find originating from industry-funded climate disinformation websites) appearing in this forum”. As a direct result of this hockey-stick nonsense, George Monbiot in the Guardian ( a paper with a well respected “bad science” column) announced the elimination of both the Medieval Warm Period and the Little Ice Age with a single stroke. The problem with the relentless propaganda which alarmists purvey is that non-scientists believe it.Moderator Response: [Daniel Bailey] Please refrain from accusations such as: "The problem with the relentless propaganda which alarmists purvey is that non-scientists believe it." Unless, of course, you can provide linked quotes from reputable sources (i.e., not a blog) to prove your assertions. Thanks! -
TimTheToolMan at 08:51 AM on 5 January 2011The 2010 Climate B.S.* of the Year Award
" Total discussion about greater preponderance of highs versus lows was about 4 min and 30 sec. " With the chaiman phrasing and rephrasing the question, sure. Lindzen's responses were very brief and he went into no detail. From his "answer" point of view the exchange was considerably shorter. "And what dhogaza said--there are multiple, independent lines of evidence that the planet is warming which do not require thermometers. " One thing at a time. This is about rubbishing Lindzen because he made a claim that most people dont even begin to understand. He won an award for it in your eyes afterall. -
Utahn at 06:53 AM on 5 January 2011Temp record is unreliable
Here is the link to "Tales from the thermometer" which is available via replay wayback machine: http://replay.waybackmachine.org/20090216121919/http://tamino.wordpress.com/2006/11/08/tales-from-the-thermometer/ Which brings up my question on the temp data sets, the HadCRU and GISS ones are the same thermometers, with different data adjusting procedures etc..., while the GSOD database has many more stations - my question is does it also include the GHCN stations (while adding many more), or is it a set of completely distinct stations? I couldn't find for sure from the links at Ned #90...Also, are there any other worldwide surface station data sets distinct from the GHCN that have been looked at? Many thanks!! -
Rob Painting at 06:30 AM on 5 January 2011Glaciers are growing
rockpicker - "Dr. Tim Ball.....He said world glacier ice mass is currently growing" The World Glacier Monitoring Service say otherwise: Given that the last decade is the warmest in the instrumental record and 2010 the warmest year in that decade, Tim Ball's assertion seemed unlikely from the get-go. Does make you wonder why he would make such an erroneous claim, when it's so easy to check its' veracity.
-
Utahn at 06:26 AM on 5 January 2011Back from the Dead: Lost Open Mind Posts
Can we add "Tales from the thermometer" to the top? http://replay.waybackmachine.org/20090216121919/http://tamino.wordpress.com/2006/11/08/tales-from-the-thermometer/ It's the one referenced in the "Temp Record is Unreliable" post, but the link doesn't work, the replay machine did find it as above, though... ThanksModerator Response: [Daniel Bailey] Thanks, I'll take care of it! -
Rob Honeycutt at 06:25 AM on 5 January 2011Not So Cool Predictions
To follow up on dhogaza... Or maybe scientists should not make any predictions about anything. All systems at their core are chaotic. That means it's impossible to know anything to a level of certainty that we could ever act upon anything, ever. Okay, I'm going back to bed now. No point in doing anything because I can not have certainty about anything I'm going to do today. //Sarcasm off// I can hardly count the places I've read about uncertainties or lectures I've listened to on uncertainties related to climate change. Some here will remember that I did a count of the number of times the word "uncertainty" was used in the WG1 report of AR4 (the number was larger than the number of pages in the report). All of life is a game of how we act upon uncertainties. The uncertainties related to climate are low enough that we should, as a broader society, be making concerted efforts to avoid the potential outcomes that we face. From the standpoint of uncertainties, this is a no-brainer. -
DSL at 06:15 AM on 5 January 2011Not So Cool Predictions
Snowhare -- fist-bump on the Asimov essay. His non-fiction is badly neglected. -
dhogaza at 05:21 AM on 5 January 2011A Positive Outlook For Clouds
"See Second Law of thermodynamics for a thorough discussion of this question. Hopefully, we don't have to reinvent this wheel." Staples might also want to visit Science of Doom, which has dissected the bogus second law arguments in excruciating detail.
Prev 2004 2005 2006 2007 2008 2009 2010 2011 2012 2013 2014 2015 2016 2017 2018 2019 Next


