


 Arguments


Recent Comments
Prev 2031 2032 2033 2034 2035 2036 2037 2038 2039 2040 2041 2042 2043 2044 2045 2046 Next
Comments 101901 to 101950:
-
villabolo at 19:39 PM on 21 December 2010A new resource - high rez climate graphics
But when you're communicating science to a broad audience, your visuals need to contain just the bare minimum required to get the message across. Cram too much detail in there and your meaning can get lost in a sea of factoids. So often when I scratch around for good climate graphics to communicate the required message, I can't find anything simple enough and am forced I create my own." John, I'd hate to be the one to point out the fly in the ointment but there may arise an issue of authenticity. If we were to "redo" charts and graphs we will be accused of cooking (No pun intended.) the charts by our beloved 'skeptics'. I realize that our intent is not to convince the inconvincible 'skeptics' but we have to keep in mind that our target audience will be weighing both arguments and could, due to their ignorance, be easily sidetracked by spurious arguments. I personally would prefer, to the best extent possible, to keep charts, graphs, etc. in their original state and then explain to my target audience what they should focus on and what they could safely ignore. -
RSVP at 19:35 PM on 21 December 2010Stratospheric Cooling and Tropospheric Warming - Revised
archiesteel #59 "Indeed. However, without the GHG molecule, the IR photon would be more likely to escape into space, while here it is being captured by a CO2 molecule and re-radiated, possibly back to that rock, re-warming it." ...at which point, the CO2 molecule cools. If I move a dollar from one pocket to another all day as I go window shopping, my buying power hasnt changed. archiesteel #59 continues... "...but all this extra time the IR photons spend in the atmosphere and back to the ground means higher temperatures overall." Furthermore, last time I checked, my pocket yields an interest rate of exactly 0.00000% -
Mila at 18:59 PM on 21 December 2010An online resource for the IPCC 4th Assessment Report
Thanks for your support, it is greatly appreciated. #7 - at this moment I am focused on journal articles, for other entries I usually try to find links to WorldCat database. In the final version I hope to polish the links which are a bit special. -
Ebel at 17:43 PM on 21 December 2010Stratospheric Cooling and Tropospheric Warming - Revised
#68 HumanityRules at 17:00 PM on 21 December, 2010 "I'm really interested why molecules are more likely to collide while IR and molecules aren't more likely to collide when CO2 is increased in the stratosphere?" The collisions with CO2 molecules are a tiny minority of all collisions - but still makes sure that the ratio is of excited CO2 molecules to CO2 molecules in the ground state is the Maxwell-distribution corresponding to the gas temperature equals [exp (-hv/kT)]. If the radiation intensity corresponding to the local gas temperature, it would be Maxwell-distribution accurat. If the radiation intensity is lower, exist less excited states, at a higher radiation intensity exist a little more excited states. -
VeryTallGuy at 17:32 PM on 21 December 2010Lindzen and Choi find low climate sensitivity
RW1 @119 I'm afraid my life is too short, but also the answer is too simple. I've pointed out on several posts (as have others eg KR@131) that 3.7 W/m2 is the top of the atmosphere number. You keep on trying to halve it by claiming that it is something else. It's not. 3.7 is the total increased heat absorbed by the earth's system for a doubling of CO2 - the net reduction in radiation to space. Absorption and re-emission through the atmosphere are inherent in the calculation which is done stepwise through the atmosphere. If you want to calculate the surface budget associated, feel free. Also, you asked for a response to your original question. I tried directly to do that @112 - even with the very conservative figures I put in there you can see that the energy change from CO2 is bigger than your figures for orbital eccentricity within 2 years. And you still haven't provided any reference for your numbers on orbital forcing, unless I missed them. Please do? -
Albatross at 17:27 PM on 21 December 2010An online resource for the IPCC 4th Assessment Report
Now only if I had the time to create a database of my journal papers on which Zvon could perform searches. Now that would be superb tool and save many expletives and much time wasted trying to track down papers...now where is Knutti and Hegerl again? Last time I saw it is was dumped on my Mac's desktop... Seriously though, Mila this is a fantastic tool. Thanks for sharing. -
RW1 at 17:08 PM on 21 December 2010Lindzen and Choi find low climate sensitivity
In my example above, power in = power out. 168 W/m^2 absorbed and radiated upward out to space + 70 W/m^2 passing through the transparent window unabsorbed out to space = 238 W/m^2 leaving & 238 W/m^2 arriving. -
HumanityRules at 17:00 PM on 21 December 2010Stratospheric Cooling and Tropospheric Warming - Revised
#4 Alec Cowan "then it becomes "less rarified" by a factor of about 1.0009" Thanks for that but it didn't quite answer my question. I have no problem with the size of the increase. Bob seems to describe the KE method as revolving around the increase in collisons of molecules associated with this increase. Your answer would suggest this process is insignificant as well. I'm really interested why molecules are more likely to collide while IR and molecules aren't more likely to collide when CO2 is increased in the stratosphere? -
Tom Dayton at 16:46 PM on 21 December 2010Lindzen and Choi find low climate sensitivity
No, RW1, you are incorrect that "multiple absorptions on the way down could cause half to be redirected back up out to space - equally offsetting any redirected back down." That's because: (1) The source of the radiation being absorbed is below the absorbing GHGs (on the surface). So there are far more GHG molecules to intercept radiation on its way up, than radiation on its way down. (2) Energy absorbed as radiation by GHGs mostly is transformed into kinetic energy by conduction with other molecules, most of which don't radiate that acquired energy. So much of the intercepted radiation's energy is removed from the radiation-to-space pathway, instead contributing to temperature rise of the gases. -
archiesteel at 16:40 PM on 21 December 2010Lindzen and Choi find low climate sensitivity
@RW1: "I think VeryTallGuy can respond for himself." I'm not responding for VTG, I'm commenting on your poor appraisal of his knowledge - considering he actually understands the science, and you clearly don't. As others have said, the 4 W/m^2 already considers the omnidirectional emissions of CO2. You keep ignoring it, as well as the very strong rebuttals to your strange theories. When someone keeps repeating the same thing over and over again and ignoring rebuttals, it's a clear sign that they've lost the argument, and are only keeping at it to either save face or waste everyone's time. You've stated your opinion, many times. People have presented their counter-arguments. What do you say we let posterity decide who is right, and who is wrong? Anyway, it's not as if your approximate grasp of the matter is going to convince anyone here... -
RW1 at 16:39 PM on 21 December 2010Lindzen and Choi find low climate sensitivity
muoncounter (RE: Post 130), I'm sorry, it's actually about 152 W/m^2 absorbed and sent down to the surface - not 150 W/m^2 (238 + 152 = 390 W/m^2). So that makes it 152 W/m^2 down and 168 W/m^2 up or about 52.5% up and 47.5% down (using Trenberth's numbers at least). -
Gareth at 16:37 PM on 21 December 2010The Climate Show #4: Peter Gleick, AGU and climate sensitivity
As for the cricket, I hope I'm not forced to choke on my turkey leftovers (served in Rick Stein's Nasi Goreng) ;-) -
RW1 at 16:27 PM on 21 December 2010Lindzen and Choi find low climate sensitivity
muoncounter (RE: Post 130), Actually, the re-radiation from GHGs is in all directions (half goes more upward, half goes more downward, some goes more sideways). Only the downward going half can affect the surface. It may seem logical that multiple absorptions on the way up could cause more than half the power to affect the surface, but if this is true, it also would mean that multiple absorptions on the way down could cause half to be redirected back up out to space - equally offsetting any redirected back down. Whatever happens exactly, if you run some numbers, the net result shows that it's about half up and half down. For example at a temperature of 288K, the surface emits 390 W/m^2. With a gain of 1.6 at the surface, the amount power absorbed by the atmosphere and sent back toward the surface is 150 W/m^2 (238 W/m^2 from the Sun + 150 W/m^2 from atmosphere = 390 W/m^2 at the surface). To calculate the amount of power absorbed by the atmosphere and directed up out to space, we need to know how much of the surface power passes through the transparent window of the atmosphere totally unabsorbed. If we use Trenberth's 70 W/m^2, we get a total of 320 W/m^2 absorbed by the atmosphere (390 - 70 = 320 W/m^2). 320 W/m^2 total absorbed - 150 W/m^2 directed downward back toward the surface = 170 W/m^2 upward out to space, which using Trenberth's numbers at least, is actually about 53% up and 47% down. -
dana1981 at 16:20 PM on 21 December 2010The Climate Show #4: Peter Gleick, AGU and climate sensitivity
Good show, and nice plug for the Guide. Nice to hear that we're a bunch of nitpickers! :-) -
An online resource for the IPCC 4th Assessment Report
Awesome work, Mila. Many times the best information in the world is defeated by the difficulty of finding it. You've made that much less of a barrier. -
Lindzen and Choi find low climate sensitivity
RW1 - Your bookkeeping is off. 3.7W/m^2 is the forcing from doubling CO2 at TOA, not the surface effect. That TOA number already includes all internal re-radiation. You've been told this repeatedly - I don't know why you keep insisting on half that forcing not having an effect; you are consistently (and in an unsupportable fashion) underestimating the CO2 effect by half, and you are consistently incorrect. The '1.6 gain' for solar inputs is also you have mentioned is something I don't understand - the reaction to forcings is specifically describing equivalent inputs to the Earth energy balance, and there is no 1.6 factor anywhere I know of. Hence much of your #5 post here does not follow. As to Trenberth 2009 (you seem to be using numbers from an earlier version, but they aren't all that different), Trenberth puts quite a lot of effort into estimating the various components. If you feel he has not estimated one of the energy vectors correctly, please point out which one(s), with some evidence to back your claim(s). Preferably backed by some papers indicating why. -
muoncounter at 14:44 PM on 21 December 2010Lindzen and Choi find low climate sensitivity
#126: "it's just that about half of it happens to be "forced" in the same in the same direction it was already going - up out to space." You have said a number of times that your calculations require cutting the radiative forcing in half because of this lost to space idea. I'm genuinely curious to know where that concept originated. Let's try a 'thought experiment'. Suppose a quantity of IR photons are on their way up from the warm ground. Some of these photons get absorbed by GHGs. Reradiation takes place and exactly 50% go downwards and 50% go upwards. In this thought-world, there are only either upgoing or downgoing, no 'tweeners'. Of the ones that go downwards, if your mechanism is correct, they return to the ground and are no longer part of this experiment. If your mechanism is correct, the remainder are gone. But let's look at the future of the photons that continue upwards upon re-radiation. Is it not possible for a 2nd absorption to occur, as these up-going photons meet other GHGs? If so, we repeat the partitioning into half down (and they are no longer part of this experiment), half up. These upgoers meet more GHGs and are again reabsorbed/reradiated. Why can this process not continue many, many times? Let's call the probability of any one photon being absorbed in a single stage of this cycle P. If N0 photons start up, after the first 'stop', there are N1 = (1 - P)N0 + 0.5PN0 still going up -- all of the ones that didn't get absorbed plus half of those that did. We can calculate the total number of ups left after a large number of iterations. For P=0.01, it takes just over 900 iterations to reduce the number of upgoing photons to 1% of the initial quantity. With P=0.001, it takes just over 9000 iterations. And in our thought-world, you're either going up or going down. So 99% of the original amount are returning to the ground. Now I have no idea what a reasonable value for P should be, nor do I know if there should be a max number of iterations, nor do I expect this 50/50 scenario to resemble reality. In addition, we should calculate the fate of the downgoing photons from each iteration using the same rules. But I'm not ready to do that until you agree that your single shot, 50% Lost-In-Space idea doesn't resemble reality either. -
RW1 at 13:57 PM on 21 December 2010Lindzen and Choi find low climate sensitivity
Eric (RE: Post 127), Yeah, I tried to lay out everything as detailed as I could in post 5. -
RW1 at 13:54 PM on 21 December 2010Lindzen and Choi find low climate sensitivity
Eric (RE: Post 125), I think Trenberth is just starting with an average surface temperature of 289K rather than my 288K. I was also using an average solar input of 340 W/m^2 - Trenberth using 341 W/m^2. My 238 W/m^2 is derived by subtracting out an albedo of 0.3, which equals 102 W/m^2 (340 x 0.3 = 102; 340 - 102 = 238 W/m^2). Trenberth is also showing 102 W/m^2 reflected (23 off the surface, the other 79 off the clouds). Many have said Trenberth's diagram is confusing because he doesn't separate out clear sky from cloudy sky, which behave quite differently from one another. Also, some of the incoming energy not reflected off of clouds is absorbed by the clouds and some makes it through to the surface. What exactly Trenberth is referring to with the 78 W/m^2 being absorbed by the atmosphere is unclear. I think a lot of his numbers are being determined ad hoc. This isn't hard to do because the the surface power is known from average surface temperature, and outgoing power is known from the effective temperature of the earth of about 255K as seen from space. With these two knowns, many theoretical energy flow models can be derived. -
Eric (skeptic) at 13:53 PM on 21 December 2010Lindzen and Choi find low climate sensitivity
RW1, you already answered my question in #5: "The average incident solar energy is about 340 W/m^2. If you subtract the effect of the earth’s albedo (about 30% or 0.3 = 102 W/m^2), you get a net incident solar energy of about 238 W/m^2 (340 – 102 = 238)." That matches the Trenberth diagram. Now I am ready to try to understand the meaning and ramifications of the "gain" of 1.6 (390 / 238). Unfortunately it is also bedtime, so I will look at that tomorrow -
RW1 at 13:22 PM on 21 December 2010Lindzen and Choi find low climate sensitivity
scaddenp (RE: Post 124), The 3.7 W/m^2 is the correct amount of increase in radiative forcing from a doubling of CO2 in the context your describing, but it's assuming all of the absorbed 3.7 W/m^2 affects the surface - meaning all of it is re-radiated downward, instead of only half. In order for half to be 3.7 W/m^2, the total absorbed power would need to be 7.4 W/m^2, which it isn't. They've gotten away with this because technically all the absorbed 3.7 W/m^2 of power is "radiatively forced" - it's just that about half of it happens to be "forced" in the same in the same direction it was already going - up out to space. Also, if they assume all of the power affects the surface, they can get more warming. -
Eric (skeptic) at 13:20 PM on 21 December 2010Lindzen and Choi find low climate sensitivity
RW1, thanks. So your 390 seems to correspond with the 396 surface radiation in the Trenberth diagram. Your 238, which you describe as solar hitting the surface is listed as 184 in Trenberth (161 absorbed plus 23 reflected) That is a discrepancy I can't explain. What is odd is that Trenberth shows 239 outgoing LW at TOA which is very close to your 238 number. So my question boils down to: how is your 238 number derived? -
scaddenp at 12:50 PM on 21 December 2010An online resource for the IPCC 4th Assessment Report
Excellent stuff, however I notice references to past IPCC assessment point to book sources whereas the online version of old reports would be more useful. A small nitpick in an otherwise brilliant piece of work. -
scaddenp at 12:46 PM on 21 December 2010It's freaking cold!
What you could also argue is that in global warming, the no. of record highs in a year should exceed the no. of record lows if "record" is calculated on same basis for same spatial distribution. See here for some data.Moderator Response: [Daniel Bailey] Fixed link. -
scaddenp at 12:38 PM on 21 December 2010Lindzen and Choi find low climate sensitivity
RW1 - I still think there is a problem of definition here. "Radiative Forcing" is a concept to put all forcings on an equivalent basis. Ie in terms of net downward energy flux measured at top of tropopause. So calculation of extra energy at the surface from GHG is recast so that it is equivalent to say extra solar but measured at top of tropopause (NOT the TOA). Thus 3.7W/m2 is the what the recalculation of energy flux works out to for a doubling of CO2. There is no feedbacks etc which affect the climate sensitivity involved in this calculation beyond dealing with overlaps in the water vapour spectrum. So an average, annual increase in energy of 3.7W/m2 at the top of the tropopause is surely going to warm the planet from 1st law consideration. If the 3.7W/m2 was from the sun, then you would expect warming surely? Well this is the equivalent. Day to night, season to season, solar flux certainly changes but the average annual change is small (or slightly decreasing). -
Justin Wood at 12:30 PM on 21 December 2010An online resource for the IPCC 4th Assessment Report
I'll add a +1 for the wow and the brilliant. I know it took me many, many hours just to extract a couple dozen of the WG I Chapter 2 references for my own work. Incredible effort! -
RW1 at 12:27 PM on 21 December 2010Lindzen and Choi find low climate sensitivity
Eric (RE: Post 122), 390 W/m^2 is the surface emitted power for an average global temperature of 288K calculated from Stefan-Boltzman. The power in W/m^2 is directed tied to temperature via S-B because the surface of the earth is considered to be very close to a perfect black body radiator, so an emissivity of 1 can be used. 238 W/m^2 is net amount of solar power that isn't albedo reflected, or it is the amount of solar power that hits the surface and is re-radiated as LW infrared. In essence, it's the amount of solar power that has the potential to be absorbed and re-radiated by GHGs and/or clouds - it is the amount of incoming power that can contribute to the energy balance and the greenhouse effect. As far as that diagram, I'm not sure - I need specific questions. -
scaddenp at 11:50 AM on 21 December 2010It's freaking cold!
Mike H - if AGW theory predicted that there would be no more record lows, then you would have a point, but it does not. For a discussion on what the science does and does not expect, I suggest reading the papers discussed at Cold Winter in a world of Warming. Or look at some individual models runs. -
Eric (skeptic) at 11:44 AM on 21 December 2010Lindzen and Choi find low climate sensitivity
RW1, Regarding your questions in #61 above, can you ask them in terms of the diagram shown here Has-the-greenhouse-effect-been-falsified.html#14266? Or specifically I am wondering where the numbers in "390 divided by 238" come from? -
RW1 at 11:36 AM on 21 December 2010Lindzen and Choi find low climate sensitivity
archiesteel (RE: Post 120), I think VeryTallGuy can respond for himself. -
alan_marshall at 11:32 AM on 21 December 2010Debunking this skeptic myth is left as an exercise to the reader
So your correspondent believes "the real reason for global warming (ie. increased surface temperatures) is that the earth's orbit around the sun is slowly decaying". And the reason he knows the earth's orbit is decaying is [increased] "surface temperature". That's circular reasoning in keeping with typical skeptic logic. False logic is a barrier to establishing the facts, but is no barrier at all to a skeptic confirming what he wants to believe. To the extent that political will in the US is subject to ignorance of ordinary Americans, I fear we the planet is doomed! -
Nick Palmer at 11:18 AM on 21 December 2010A Merchant of Doubt attacks Merchants of Doubt
I don't think the Singers (or those like him) can understand when someone destroys their argument any more, neither do they appear able to comprehend exactly what other people are arguing. They appear to be sealed off in their own universe where their ideas make sense to them... and other people's don't. The problem with extreme contrarians, pathological sceptics or whatever (not using the D word in this post!) is that they no longer seem to possess the ability to realise when they are wrong. -
archiesteel at 11:02 AM on 21 December 2010Lindzen and Choi find low climate sensitivity
@RW1: "I think I have an idea what you're trying to say, but I'm not sure." Strange, because he was quite clear. In fact, many people here have offered solid rebuttals to your wild theories, and the fact you are not offering counter-arguments but simply restating your original position is telling. "I'm getting the impression you're repeating things you've read or been told without fully understanding them." I believe this is a textbook case of psychological projection. In fact, there is nothing wrong with VTG's argument - it is yours that seems to betray a profound misunderstanding of the science. Whether this is on purpose or not remains to be seen... -
RW1 at 10:45 AM on 21 December 2010Lindzen and Choi find low climate sensitivity
VeryTallGuy (RE: Post 111), I think I have an idea what you're trying to say, but I'm not sure. I'm getting the impression you're repeating things you've read or been told without fully understanding them. Can you take me through step by step how a doubling of CO2 will increase the surface temperature by solely the intrinsic amount (before any feedbacks)? And/or present a series of separate "Do you agree...." questions and break it down like I did. -
muoncounter at 10:15 AM on 21 December 2010Arctic sea ice has recovered
Ok, here's some 'good news': Polar bears: On thin ice? Extinction can be averted, scientists say ... new Nature paper indicates that if greenhouse gas emissions were reduced substantially in the near future, rapid ice losses would be followed by substantial retention of the remaining ice through this century--and partial recovery of the ice that disappeared during the rapid ice loss. --emphasis added That's a fairly balanced way to report this new study. The same group (University of Washington) ran a model in 2007 forecasting that sea ice would reach a tipping point and polar bears would go down the drain by the end of century.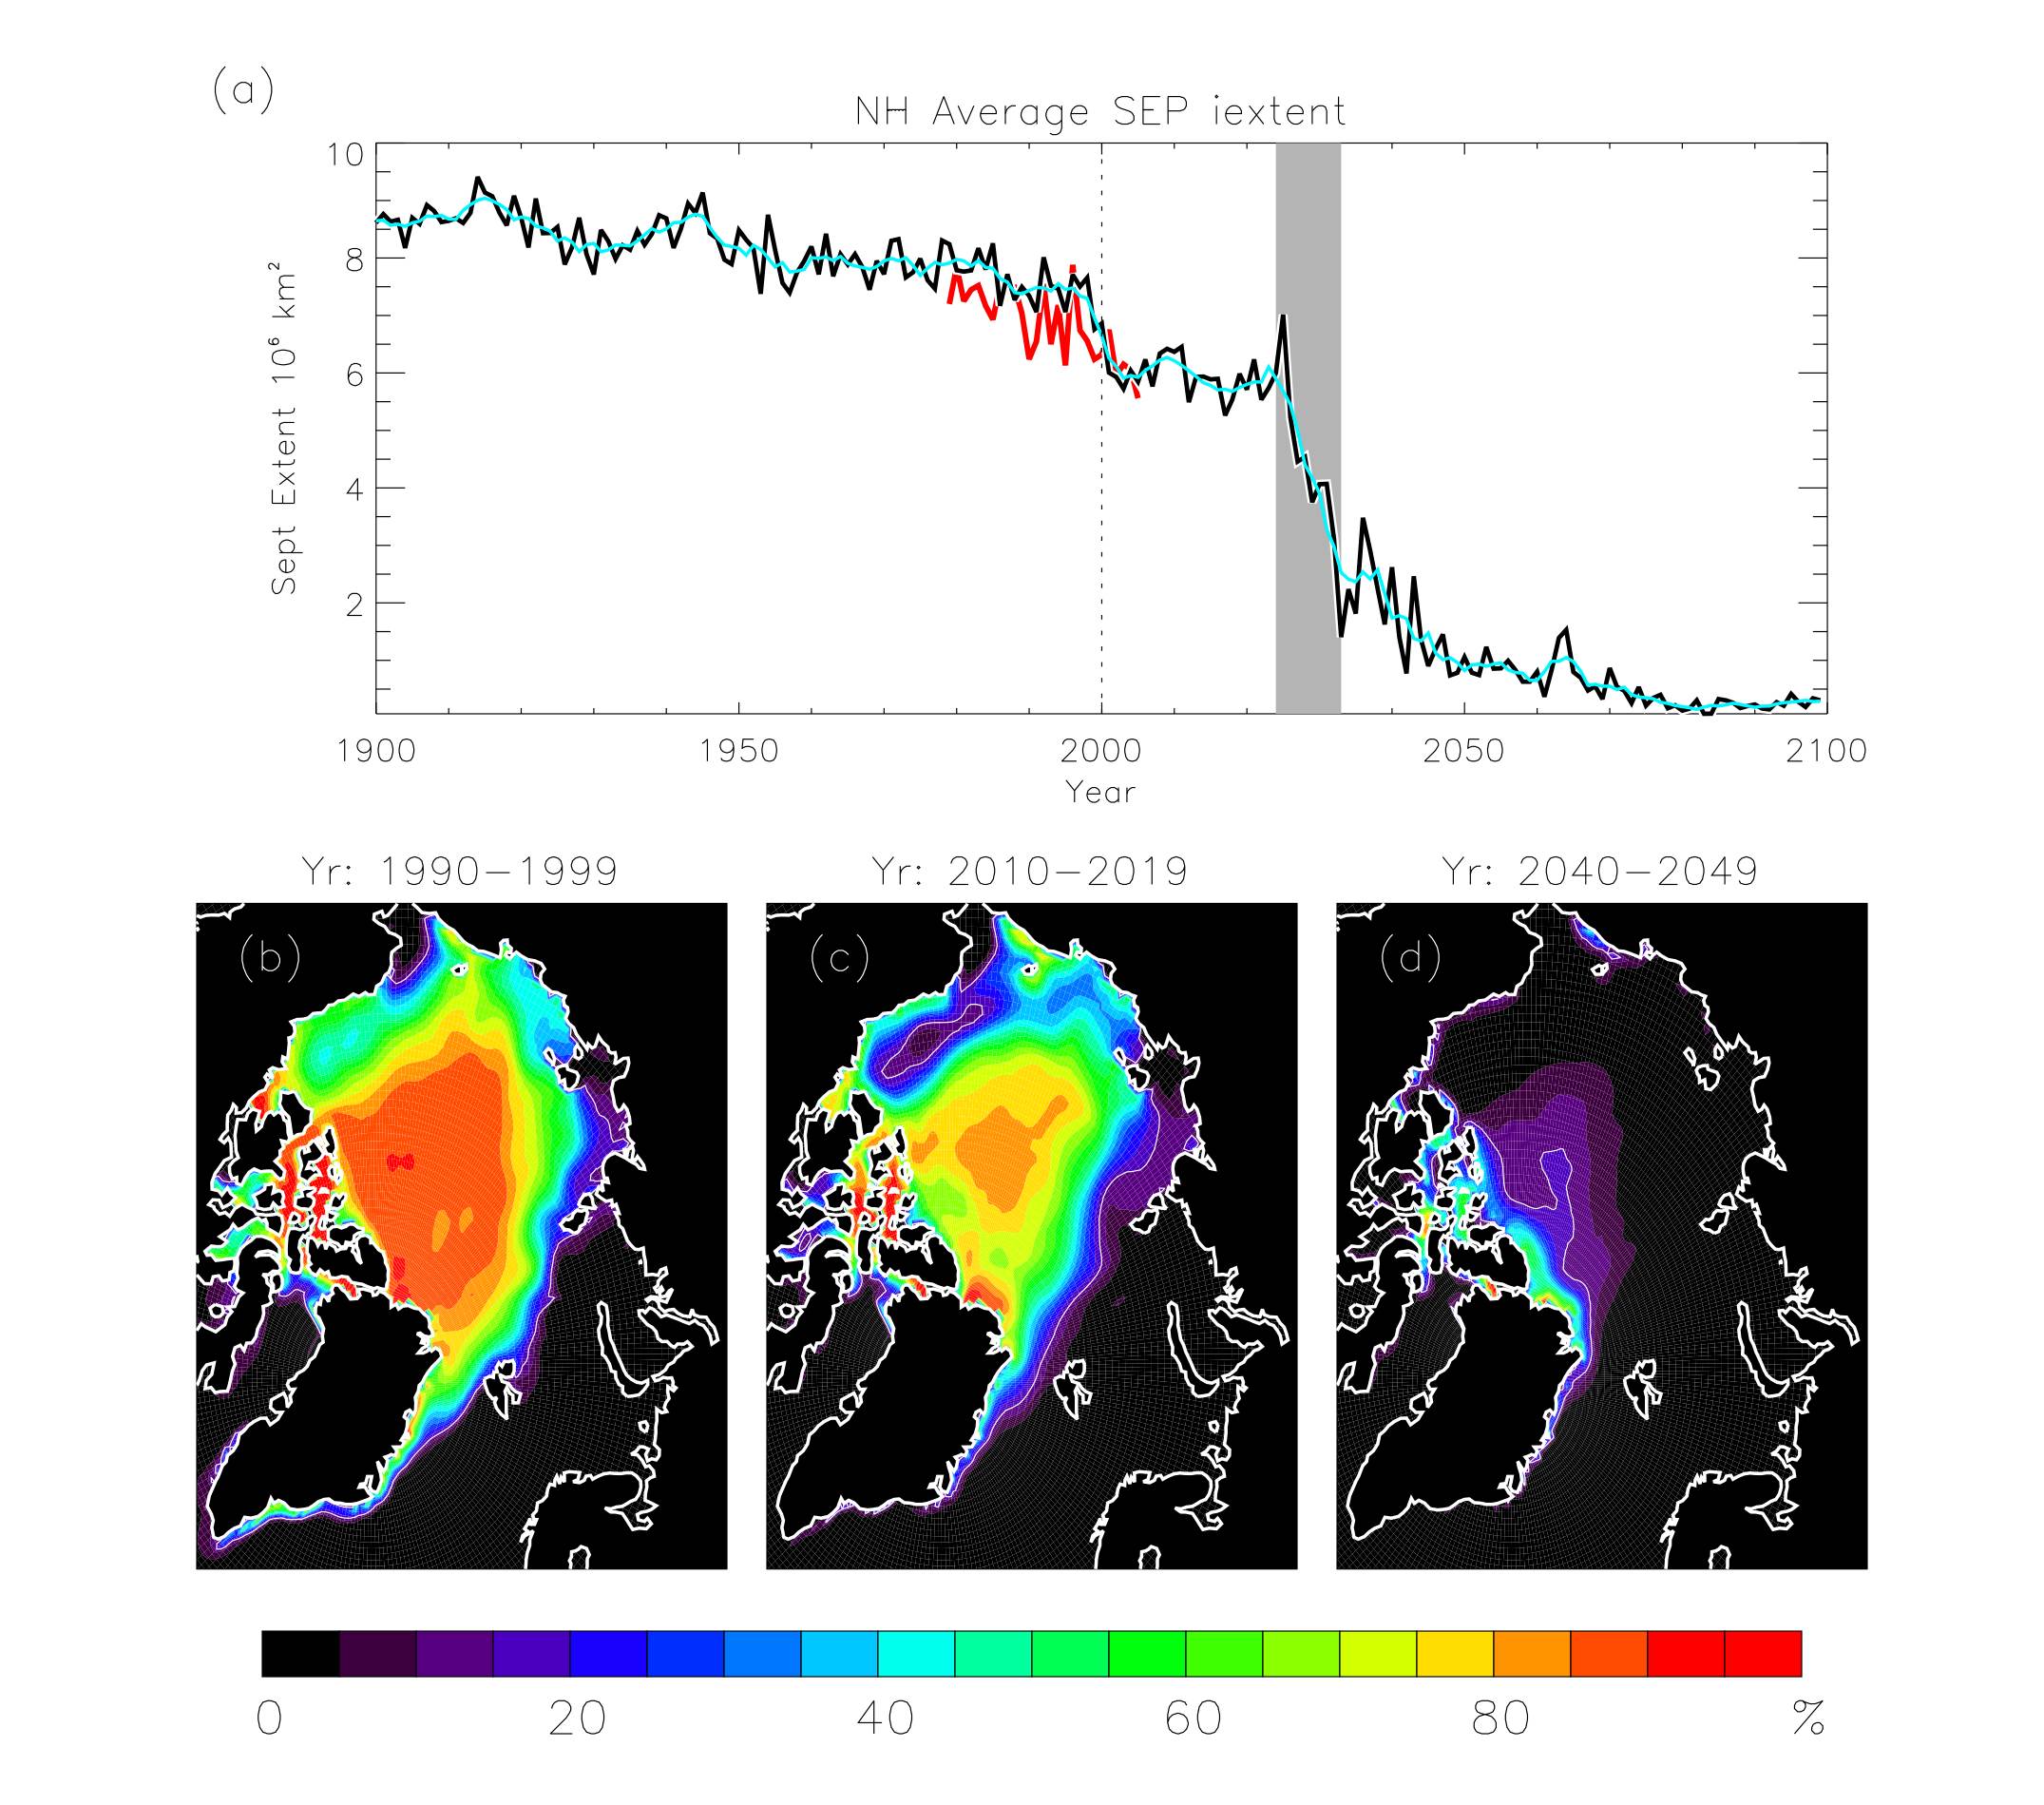 One of the authors did a writeup in RC contrasting what the study actually said vs. what was said about it. That is an interesting read of its own. The full size graph is available there.
But the new study has already generated headlines proclaiming the 'good news', even before the Nature issue comes out:
Arctic ice cap safe from runaway melting
No tipping point for Arctic icecap melting
How fast will the actual message -- that substantial GHG mitigation must happen and soon (emphasized in the quote above) -- get lost as the deniersphere spins this one?
One of the authors did a writeup in RC contrasting what the study actually said vs. what was said about it. That is an interesting read of its own. The full size graph is available there.
But the new study has already generated headlines proclaiming the 'good news', even before the Nature issue comes out:
Arctic ice cap safe from runaway melting
No tipping point for Arctic icecap melting
How fast will the actual message -- that substantial GHG mitigation must happen and soon (emphasized in the quote above) -- get lost as the deniersphere spins this one?
-
Mike H at 10:15 AM on 21 December 2010It's freaking cold!
It seems to me that we need to differentiate between climate change and anthropogenic global warming.The temperature trends appear to indicate a warming, but that alone does nothing to identify the cause. I would argue that if we observe record low temperatures with CO2 at a supposedly 'all-time' high this tends to indicate that CO2 is by no means the major contributor to warming.Moderator Response: See the posts "CO2 is not the only driver of climate" and then "It’s not us." -
Alec Cowan at 08:47 AM on 21 December 2010A Merchant of Doubt attacks Merchants of Doubt
@Phil #21 No, #17 was just an run-of-the-mill innuendo, with a basic formulation. Thanks for that link, very interesting! -
adelady at 08:46 AM on 21 December 2010An online resource for the IPCC 4th Assessment Report
Absolutely brilliant! Congratulations. And thanks. -
Ebel at 08:14 AM on 21 December 2010Stratospheric Cooling and Tropospheric Warming - Revised
#61 danielbacon at 04:45 AM on 21 December, 2010 "With Kirchhoff’s law and no molecule collision the frequency absorbed and re-emitted ..." There is no re-emission, but only an emission according to the temperature. Absorption and convective heat transfer only replace the emitted energy, so that the gas temperature remains approximately constant. -
Joe Blog at 07:52 AM on 21 December 2010Stratospheric Cooling and Tropospheric Warming - Revised
danielbacon at 04:45 AM on 21 December, 2010 says Its more a question of opacity, a molecule will emit proportional to its T^4, so at higher altitudes, CO2 is still emitting at 15 micron, but much less intensely than at the surface(and also, just because something can absorb a wavelength, dosnt mean it emits it, if its T is not sufficient, take O3, absorbs UV, emits 9-10 micron , Kirchhoff's law is really just saying you cant heat something above the T o the source radiation.) The reason being, that at just above the surface, the atmosphere is extremely opaque to 15 micron, so even though it is emitting much more intensely than at the tropopause, what is emitted is absorbed within 3m. So it doesn't loose energy through radiation in this wavelength at these path lengths. Where as when you rise through the atmosphere, and it becomes more rarefied, the amount of energy moved through radiation increases, just because the probability of what it emits being reabsorbed in close proximity to it decreases. The path length shortens. So the vast majority of the energy emitted from just below the tropopause in 15micron escapes directly to space, some is absorbed in transit, and re emitted, and this emission can be seen as a spike in the center of the 15micron band looking down from space. Because its more intense than what is emitted from the tropopause(around 220K). I think Ebel and Tom Curtis both posted graphs of this in the other thread. Truth is, the net flow of energy is from the stratosphere to the troposphere, and this is a result of the transparency to LW in the stratosphere, but opacity to UV, so it emits more to the troposphere than it absorbs coming up from the troposphere. Good paper on stratospheric tropospheric radiative interaction that im going to post yet again, because it does give some great insights. Quantum mechanics is not my thing however, but emission is T dependent. -
citizenschallenge at 07:08 AM on 21 December 2010An online resource for the IPCC 4th Assessment Report
hope you don't mind me doing a cut and paste of something I just posted at the CFI discussion Forum. The way I see it Miloslav Nic site deserves to be trumpeted around a little. ~ ~ ~ ~ ~ ~ ~ Lookie what just hit cyberspace. A clear, easy, searchable database to the Fourth Assessment Report of Intergovernmental Panel on Climate Change and its hundreds of reports. You can do searches under contents, authors, or journals. The presentation of the pages is beautifully simple and clear. The typo is a clear crisp Ariel (or something close) so it's readable, even with them fading eyes. I played around for a while and all the cascading links worked fine and dandy. NO unnecessary bells’n whistles that only serve to distract and delay download time…. meaning when you click a link it comes up fast and clear - very very nice touch. It will be great fun watching this site develop. I recall when SkepticalScience.com was taking its first baby steps and see what a valuable and formidable site that has evolved into. It would be wonderful to see this site flourish. ~ ~ ~ ~ ~ ~ ~ pssst pass it* on {*that is: Zvon.org Guide to IPCC AR4 } cheers PM -
archiesteel at 06:49 AM on 21 December 2010A Merchant of Doubt attacks Merchants of Doubt
I still don't understand why the Register gets it so wrong on Climate Science. I used to enjoy reading that site back in 2000, but along the way they just lost their relevance - and now this. -
Phil at 06:31 AM on 21 December 2010A Merchant of Doubt attacks Merchants of Doubt
I wonder whether the "Observations indicate global warming less than the low end scenario," @17 is a mis-statement of this misinformation -
Paul D at 06:24 AM on 21 December 2010Stratospheric Cooling and Tropospheric Warming - Revised
RSVP: "As the context is electromagnetic radiation, and the exchange of heat from solids on the ground to CO2 molecules that make up the atmosphere, it is hard to understand where the obscurity lies." You assume that everyone knows what level of understanding you have. I generally assume denialists have a poor understanding of science. Hence coming from such a person, a packet can mean anything. You clearly do not explain yourself clearly in order to disrupt and play games. That isn't clever and is considered to be morally corrupt by some. -
Paul D at 06:14 AM on 21 December 2010Stratospheric Cooling and Tropospheric Warming - Revised
Xplain: "Shame RSVP has scrawled graffiti all over the comments..." Indeed. -
muoncounter at 05:42 AM on 21 December 2010A Merchant of Doubt attacks Merchants of Doubt
#17: "Observations indicate global warming less than ..." Really? I hadn't heard. What observations are you referring to? Subsequent comments should go to It's not bad or IPCC is alarmist or It's not happening. -
archiesteel at 05:39 AM on 21 December 2010A Merchant of Doubt attacks Merchants of Doubt
@CW: "Observations indicate global warming less than the low end scenario" Actually, they don't. They're right in line with a 2-4.5C. Except now we have another problem: oceans are soaking up more heat that we originally thought, and they are acidifying. That's a double whammy on marine life, with potentially devastating results on many aquatic ecosystems. But yeah, let's continue raising CO2 concentrations to levels not seen for millions of years. That sounds like a swell idea... Any more doubt to sell? -
A Merchant of Doubt attacks Merchants of Doubt
ClimateWatcher - Can you point to where "Observations indicate global warming less than the low end scenario..." is demonstrated? It was my understanding that we're tracking right along the mid-level IPCC projections, matching the modeled response to what we are actually emitting, although with much higher ice melt rates than projected (as the IPCC did not include melt feedbacks in their estimates). I do not think your claim is correct. -
hfranzen at 05:32 AM on 21 December 2010Human CO2 is a tiny % of CO2 emissions
i have posted a power point on charge balancing and buffering in aqueous solutions on my website, hfranzen.org. This web post, "CB with Buffering", provides a rather complete, explicit treatment of the reactions involved in the dissolution of carbon dioxide in the absence of buffers and a general treatment providing the fundamental equation for determining the pH of a solution containing any number of weak acids and weak acid anions and in equilibrium with gaseous carbon dioxide. -
ClimateWatcher at 05:19 AM on 21 December 2010A Merchant of Doubt attacks Merchants of Doubt
The IPCC peddles the first doubt. Observations indicate global warming less than the low end scenario, yet the public discourse is: 'yeah, yeah, but it could be really bad.' The longer the observations converge to a mild rate of change, the more we must question the IPCC range of doubt.
Prev 2031 2032 2033 2034 2035 2036 2037 2038 2039 2040 2041 2042 2043 2044 2045 2046 Next


