


 Arguments


Recent Comments
Prev 2032 2033 2034 2035 2036 2037 2038 2039 2040 2041 2042 2043 2044 2045 2046 2047 Next
Comments 101951 to 102000:
-
XPLAlN at 05:11 AM on 21 December 2010Stratospheric Cooling and Tropospheric Warming - Revised
Good article. Very educational. Shame RSVP has scrawled graffiti all over the comments section by denying the very principle that we all know from merely getting under a duvet when we go to bed. Or perhaps I'm still dreaming... -
Stratospheric Cooling and Tropospheric Warming - Revised
danielbacon - Collisions will dominate energy transfer down to <1 Torr, or about 1 millibar (0.75 Torr/millibar). That means any part of the atmosphere below about 48km, the top of the stratosphere: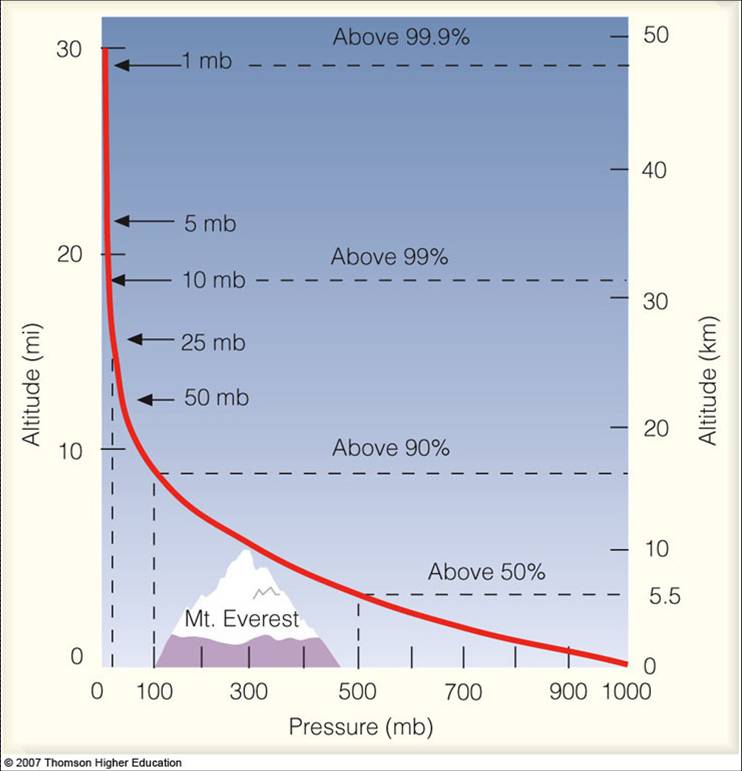 As the current topic is discussing tropospheric and stratospheric radiative states, not mesospheric or thermospheric, we can consider collisional effects dominant.
As to which particular energy states, I can't speak to the statistical distribution between various vibrational/electron states. - perhaps someone else can. Is it relevant?
As the current topic is discussing tropospheric and stratospheric radiative states, not mesospheric or thermospheric, we can consider collisional effects dominant.
As to which particular energy states, I can't speak to the statistical distribution between various vibrational/electron states. - perhaps someone else can. Is it relevant?
-
Phila at 04:51 AM on 21 December 2010Debunking this skeptic myth is left as an exercise to the reader
Humanity Rules #11 When you accuse people of circular reasoning, it's kind of an obligation to present actual evidence of their circular reasoning. That way, we can see that you're not simply being frivolous. wingding #47 the simplest counterargument (one that everyone can understand the logic to) Well, maybe not everyone. Apparently, some people just know when a scientific argument is "flawed," just as some people can reportedly sense Magnetic North. Personally, I like the idea of a luminiferous aether. It's a shame that modern physics is conspiring to suppress an idea that really deserves to be true. muoncounter #48 #40: Yooper, you and I apparently misspent our youth in much the same way. Although The Hollow Earth (fact or fiction?) would explain why the Arctic ice is melting -- heat from the internal sun! Close, but no cigar. The warming actually comes from the underground UFO bases at New Swabia. -
danielbacon at 04:45 AM on 21 December 2010Stratospheric Cooling and Tropospheric Warming - Revised
I am the one unclear here sorry. With Kirchhoff’s law and no molecule collision the frequency absorbed and re-emitted are the same correct (or am I making a mistake here). Now as we move up now adding collision you are saying that the emitting of IR is more due to molecules collision creating one of three vibration states then emitting, is more dominate then ad-reemit? As the collision drop off absorbed and re-emitted would be stronger. Now are both collision and the major absorbed are both dominate on one particular vibration state and if so which a-sync or one of the two bending states. -
CBDunkerson at 04:44 AM on 21 December 2010Lindzen and Choi find low climate sensitivity
RW1 writes: "logarithmic, which means each additional amount added only has about half of the effect of the previous amount" The man has his own (false) definition of 'logarithmic'. What more need be said? -
Riccardo at 03:53 AM on 21 December 2010Stratospheric Cooling and Tropospheric Warming - Revised
danielbacon to elaborate a little bit on what KR said, once excited, the molecule have two possible paths to jump back to the fundametal state, emit the excess energy at the same frequency or give it away as kinetic energy to other molecules by collision. The first proces is radiative, the second is not because the vast majority of mouecules in the atmosphere is IR inactive. In principle, higher order processes may occur, but they can be safely neglected. Having said this, I think the best way to understand it is look at an emission spectrum. -
archiesteel at 03:53 AM on 21 December 2010A Merchant of Doubt attacks Merchants of Doubt
@TOP: referring to a man's past record is completely legitimate when one tries to ascertain his credibility. Singer has a history of twisting science to serve powerful corporate interests. He's a shill, pure and simple. You wouldn't take the time to defend him if you didn't share his politically-motivated opposition to AGW theory. -
archiesteel at 03:47 AM on 21 December 2010Stratospheric Cooling and Tropospheric Warming - Revised
@RSVP: "Let's see. If an IR "photon", energy packet, (however you want to call it) is emitted from a roof's slate shingle, and is captured by a CO2 molecule two feet away, has not the roof lost the energy, and the air gained the energy? And in losing this energy, has not the roof effectively "cooled"?" Indeed. However, without the GHG molecule, the IR photon would be more likely to escape into space, while here it is being captured by a CO2 molecule and re-radiated, possibly back to that rock, re-warming it. Eventually the Earth will reach temperature equilibrium, but all this extra time the IR photons spend in the atmosphere and back to the ground means higher temperatures overall. You know this already. Please stop wasting everyone's time. -
Stratospheric Cooling and Tropospheric Warming - Revised
Ebel - Sorry if I was unclear. The energy of the CO2 molecule will vary greatly over time, including both quantum effects (electron orbital states), vibrational energy, and the more continuously variable rotational values. By continuous I meant over time, not total energy. Due to the frequent collisions and energy exchanges emission energies of any particular CO2 molecule will have at most a very weak correlation with previous absorption energies. -
Ebel at 03:14 AM on 21 December 2010Stratospheric Cooling and Tropospheric Warming - Revised
#56 KR at 02:59 AM on 21 December, 2010 "The energy state of the CO2 molecule will be changing continuously due to collisional interactions," The energy state of the CO2 molecule will be changing not continuously, but in quantum. See also Milne, Edward Arthur: The effect of collisions on monochromatic radiative equilibrium ( http://adsabs.harvard.edu/abs/1928MNRAS..88..493M ) Atoms in Milne = molecules in the atmosphere -
Stratospheric Cooling and Tropospheric Warming - Revised
danielbacon - That depends a bit on altitude and pressure. At surface pressures a CO2 molecule will collide with ~1000 other molecules before it has time to transition down and emit a photon. This means that an individual absorption is unlikely to directly result in an emission, but rather emission is driven by the air mass average temperature of thermally (re)excited CO2. The energy state of the CO2 molecule will be changing continuously due to collisional interactions, not just absorption events, and the emission spectra will reflect that. At stratospheric pressures/temperatures, of course, collision frequency will drop, but there should be >>1 collisions before emission down to roughly single Torr pressures. -
Riccardo at 02:45 AM on 21 December 2010An online resource for the IPCC 4th Assessment Report
I gave it a few tries. Unbelievable. Congrats Miloslav Nic. -
danielbacon at 02:45 AM on 21 December 2010Stratospheric Cooling and Tropospheric Warming - Revised
A few questions about the different vibration states (3 IR ones) and the frequency of the IR packet? What I understand that CO2 will not (~90%) transition between the different oscillations so is the energy frequency absorbed and re-emitted the same (as in the same band) or is it on one of the other two bands? If this is so would it not change the shape of the spectrum (frequency absorbed and re-emitted) with altitude? I understand band winging etc. But I have heard both answers (Same and not the same frequency) from people in the field. I know it is more of a quantum mechanics but I have not been able to get an answer or a better undemanding of the changing frequency in the oscillations states. I know what the answer would be if it was the electron changing states but not with vibration states. If you have a reference would be nice. My last quantum mechanics class was late 70s so sorry for a basic question. Thanks -
muoncounter at 02:29 AM on 21 December 2010Greenland Ice Sheet outlet glaciers ice loss: an overview
#25: A document that turns against one's intended use is the digital petard. As for Rosencrantz and Guildenstern, "They are not near my conscience; their defeat Does by their own insinuation grow" -
DSL at 02:16 AM on 21 December 2010A Merchant of Doubt attacks Merchants of Doubt
Actually, TOP, while it does appear that rockytom is attacking the man and not the ideas, Singer has consistently produced the same ideas, even in the face of perfectly understandable criticism. It could be said, then, that Singer has become ideologically driven--no longer capable of dialectical engagement with his field of expertise. Is rockytom, then, pulling a typical "ad hominem" case, like attacking based on skin or hair color, or the brand of Singer's cologne? No. Everything rockytom says is related to the man's professional life and its apparent ideological solidification. -
Alec Cowan at 01:30 AM on 21 December 2010A Merchant of Doubt attacks Merchants of Doubt
Oreskes and Conway simply cite in their paragraph this text (notes 97 and 98 to chapter 1 in Merchants of Doubt): Presentation to Operating Committee. R.J. Reynolds Industries, Inc. by F. Seitz "There is much talk these days about the effects of the environment in causing cancer. This is often coupled with an attempt to lay much of the blame for cancer upon industrialization. While there's no doubt that certain industrial occupations carry special hazards, it seems quite fair to say that under the best circumstances the natural environment is not carcinogen free. Among other things we know that the oxygen in the air we breathe and which is essential for life plays a role in radiation-induced cancer". and they add "(Oxygen, like most elements, has a radioactive version -- oxygen 15 -- although it is not naturally occurring.)" and refer to note 99 Michel Ter-Pogossian et al, "Radioactive Oxygen 15 in Studies of Kinetics of Oxygen of Respiration," American Journal of Physiology 201 (1961) So Oreskes and Conway know well what they are saying. Seitz is making a blurry statement which contains an induced inference about oxygen being related with radiation-induced cancer ('plays a role' is the blurry statement that happily produces the expected inference), so the authors only can cite a proper text saying that Oxygen 15 in not naturally available and let the reader to infer Seitz' intentions. That is, nothing to blame on O. and C. It's a pity that Dr. Singer hasn't followed the same protocol and quoted "Merchants of Doubts" properly. I only can add two things: 1) Intentionally blurry pseudo-assertions are common in any debatable topic. Singer, Seitz and a few people hanging comments here are good evidence of that. We can't let them misguide us nor we can answer their tricky ways with impatience and using their methods. 2) Let Singer do all the hating. Criticizing Singer morals and abilities is following his steps. -
Riccardo at 01:27 AM on 21 December 2010A Merchant of Doubt attacks Merchants of Doubt
TOP are you a lawyer? That's my impression judging from your comment. The fact is that Singer, in the one example cited, was wrong. That's it. We'll wait for the many others he possibly found. -
TOP at 01:22 AM on 21 December 2010A Merchant of Doubt attacks Merchants of Doubt
It sure looks like Oreskes and Conway took a misleading comment from Seitz and plunked it down in their book. Singer calls them on this by saying, "...To cite just one example...and apparently, they assume that the burning of tobacco creates isotopes." In order to point out that Singer is mis-characterizing Oreskes and Conway you need to show that the one example is uncharacteristic of other examples and statements that Singer could have quoted regarding oxygen or other naturally occurring substances and that O&C called Seitz on using a straw man or mis-characterization themselves. Not having read either book I could be wrong about both, I have to go by what facts the OP has included and assume that he is taking both comments in context. And of course the first comment on the article by rockytom has to be an ad hominem argument against Singer. Whether it is true or not, it is still an ad hominem argument. -
Ebel at 01:17 AM on 21 December 2010Stratospheric Cooling and Tropospheric Warming - Revised
Without ozone heating would be no inversion - but the temperature gradient would still fall to nearly 0. The ozone mass is very little (lower 5 mbar). Stratosphere lower 200 mbar. See http://www.skepticalscience.com/news.php?p=5&t=245&&n=468 #234 -
Anne-Marie Blackburn at 01:16 AM on 21 December 2010An online resource for the IPCC 4th Assessment Report
Can only echo shdwsnlite - wow. I've only had a quick look but that looks like a phenomenal resource. Thank you. -
Daniel Bailey at 01:09 AM on 21 December 2010Greenland Ice Sheet outlet glaciers ice loss: an overview
Re: muoncounter (24) Does being done-in by one's own furnished link constitute being hoist by one's own petard? Re: Arkadiusz (23) If you're going to dig into the paleo record, by all means let us do so. You do realize, by doing so, the inevitable comp to today's warming/GHG concentrations is the PETM...(I can see a need to write up a piece on this one, too...sigh; always more work to do and never enough time in the day). The Yooper -
Riccardo at 00:56 AM on 21 December 2010Stratospheric Cooling and Tropospheric Warming - Revised
Ebel I don't think so. Indeed, ozone is one of the main factor affecting our troposphere/stratosphere structure. As far as I know, we'd not have a temperature inversion in the stratosphere without ozone; this has been recognized around the 1930s of last century and never changed. But sure I won't fall into the mistake of thinking that only one factor matters. -
muoncounter at 00:48 AM on 21 December 2010Greenland Ice Sheet outlet glaciers ice loss: an overview
#23: "an example of a decisive influence: direct and indirect - of solar activity." Please substantiate this claim. It is neither in the Arctic Report Card you linked to, nor in the Overland et al paper. However, this is: Referring to 2009, ... there were still extensive regions of open water in the Chukchi, East Siberian Laptev, and Kara Seas ... which allowed extra solar and longwave radiation to be absorbed by the ocean ... . The heat accumulated in the ocean can be released back to the atmosphere the following autumn That is clearly a reference to reradiated IR, the source for IR trapped by the greenhouse effect. So you've actually substantiated the case for greenhouse warming. Thanks! -
muoncounter at 00:37 AM on 21 December 2010Lindzen and Choi find low climate sensitivity
#115: Thank you, Eric. Figure 4 in Antonov 2004 shows the nearly sinusoidal annual variation, which averages over the year to very nearly 0. Taken over the long term, oscillations don't add anything. That would also be the case for +/- orbital heat flux differences. However, we have other ongoing discussions of OHC here and here. -
Alec Cowan at 00:25 AM on 21 December 2010Stratospheric Cooling and Tropospheric Warming - Revised
@RSVP #40 Again, what makes you think that B relates to A, being:A = "The interaction of IR radiation with CO2 is a two way street in that IR radiation can interact with unexcited CO2 molecules and cause them to vibrate and become excited and excited CO2 molecules can become unexcited by releasing IR radiation."B = "How does a packet of energy that raises the troposphere's temperature, also raise the temperature of the Earth's surface or ocean waters? Afterall, hasnt it been said that all this extra energy is accumulating in the oceans and raising water temperature? If that little bit more of IR gets absorbed at a lower altitude due to the extra CO2, this should raise its kinetic energy or that of the gases around it,... in which case the work is done and accounted for... end of story. How can it then do "double-time", going off and warming other things? " [SIC]You took a simple dynamic process (A) yet one you don't understand and cast it into The Brothers Menaechmus (B). Basically you are saying "something I have no clue violates the law of conservation of energy! What about that!?!?". I was tempted to answer that and explain it to you, as many patiently do here daily. But I think that you, as any learner, must do your effort, and as I am sure you are not here because of control issues or 'being a playa, yo' or 'I'm making them mad with my observations because they have no clue' or 'There's no AGW because I have no clue but still I get them in a swamp trying to explain it to me' or anything like that, God forbid, I suggest you to start by explaining what "unexcited" means in A. -
Ebel at 23:28 PM on 20 December 2010Stratospheric Cooling and Tropospheric Warming - Revised
#45 VeryTallGuy at 19:42 PM on 20 December, 2010 "what's the difference in heat capacity for an atmosphere with 560 vs 280 ppm CO2?" Almost no difference The difference is the height of the tropopause It results in the following outline of the greenhouse effect in 5 points: 1. The atmosphere is divided into two parts, in essence, bottom the troposphere with a lot of convection, where the weather is and where we live, and top the stratosphere without convection, with a possible move the border between the two spheres. 2. The temperature gradient in the troposphere is (almost) constant - even when changing the thickness of the troposphere. This consistency is result of convection. 3. The almost constant optical thickness of a changing stratosphere. This constancy is due to radiation and is due to the scaling (scaling) of the radiation transport equation for change in optical thickness with change in concentration of CO2. 4. If the temperature gradient exceeds a certain threshold, the air can not stay calm and stratification becomes unstable - and the convection is the characteristics of the troposphere 5. In the steady state (ie, even though time passes, the state no changes) does mean the heat of the earth just as great as the heat absorption - would otherwise be the temperatures change constantly. But this would contradict the stationarity. These 5 points provide a basic sensitivity of the average surface temperature as a result of changes in concentrations of CO2. Addition: The thicker troposphere has a greater temperature difference between top and bottom, and this greater temperature difference is so distributed to warming bottom and cooling top, that the total radiation of the Earth is equal to the total absorption. -
Ebel at 23:21 PM on 20 December 2010Stratospheric Cooling and Tropospheric Warming - Revised
#49 @ Riccardo auf 22.04 Uhr am 20. Dezember 2010 "stratosppheric ozone influences stratospheric temperature." - But only very little -
snapple at 23:08 PM on 20 December 2010A Merchant of Doubt attacks Merchants of Doubt
Maybe these authors will take a look at Gazprom and their newspapers in their next book. I have some ideas about that. -
shdwsnlite at 22:53 PM on 20 December 2010An online resource for the IPCC 4th Assessment Report
Wow! -
Riccardo at 22:04 PM on 20 December 2010Stratospheric Cooling and Tropospheric Warming - Revised
Arkadiusz Semczyszak stratosppheric ozone influences stratospheric temperature. This simple fact has been known for almost a century. But your figure is just for the arctic while the stratospheric cooling is seen on a global scale. -
Arkadiusz Semczyszak at 21:59 PM on 20 December 2010Stratospheric Cooling and Tropospheric Warming - Revised
I'm not a physicist, so I'm interested in where - how to extract it - for example on the figure - is the impact of tropospheric temperature on the temperature of the stratosphere? -
Arkadiusz Semczyszak at 21:36 PM on 20 December 2010A Merchant of Doubt attacks Merchants of Doubt
@rockytom S funding of research related to AGW is a "slippery subject" ... : “Even the big oil companies have long since been putting their real money into projects dedicated to showing how they are in favour of a "low carbon economy". In 2002 Exxon gave $100 million to Stanford University to fund research into energy sources needed to fight global warming. BP, which famously rebranded itself in 2004 as "Beyond Petroleum", gave $500 million to fund similar research.[...]” -
Eric (skeptic) at 21:34 PM on 20 December 2010Lindzen and Choi find low climate sensitivity
#112 VeryTallGuy, if we said 1000 years that would give us 4000 year watts / m^2. I don't think year watts has any physical meaning. #105 RW1, I don't think there is any other explanation of the year-to-year rise in OHC other than CO2 forcing despite the annual fluctuation due to app/peri. It is the same idea as the steady rise in atmospheric CO2 despite the seasonal fluctuation which exceeds that rise. The only explanation of the year-to-year increase is man-made CO2 in the atmosphere being only about 1/2 absorbed over the year and the other 1/2 remaining. -
Eric (skeptic) at 21:27 PM on 20 December 2010Lindzen and Choi find low climate sensitivity
#108 muoncounter, the plot in 108 does not show annual cycles. This paper does ftp://ftp.nodc.noaa.gov/pub/data.nodc/woa/PUBLICATIONS/grlheat04.pdf and shows a 3 x 10^22 J annual fluctuation (zero to peak) or about 3 times the average annual rise of the plot in #108 -
RSVP at 21:20 PM on 20 December 2010Stratospheric Cooling and Tropospheric Warming - Revised
The Ville #44 "what exactly do you mean by a packet of energy." As the context is electromagnetic radiation, and the exchange of heat from solids on the ground to CO2 molecules that make up the atmosphere, it is hard to understand where the obscurity lies. My point has been fairly straightforward, but if I lost someone (and by the way, it seems odd you are so sure what others may or may not understand), I suppose it can be worded anew. Let's see. If an IR "photon", energy packet, (however you want to call it) is emitted from a roof's slate shingle, and is captured by a CO2 molecule two feet away, has not the roof lost the energy, and the air gained the energy? And in losing this energy, has not the roof effectively "cooled"? Now with this question, I am not attempting offend, bait, or work up my ego as you say. My intention is to simply point out what to me looks inconsistent with what is understood to be "global warming", a term which in itself is hiding something. Global "surface" warming?, global "atmospheric" warming?, global ocean warming???. Which is it? Yes. The replies I have received so far are saying global "everything" warming, (even though of late, the idea that the stratosphere is cooling has come forward.) And these replies include nonsense about how CO2 in acting like an isotropic antenna is synergetically increasing the "Earth's" temperature. I would be nice if in these explanations it was clearly stated what exactly is warming, and how this actually happens. About the only accurate thing I read above was the words, "fictitious model". -
VeryTallGuy at 21:01 PM on 20 December 2010Lindzen and Choi find low climate sensitivity
Riccardo yes, I agree with everyrthing you say. Just thought the rough calc might help to explain. -
Arkadiusz Semczyszak at 20:59 PM on 20 December 2010Greenland Ice Sheet outlet glaciers ice loss: an overview
“... please furnish a concluding summation ...” Sorry to reply so late ... The conclusion is simple and obvious after all - the Arctic - the current changes, as a whole, the melting ice in Greenland and the Greenland Sea, severe winters in Europe, Canada, USA and central China, this is an example of a decisive influence: direct and indirect - of solar activity. The current accelerated melting of ice in NH - it is even (according to some authors, the above-mentioned papers) to 91% - just nature. Contrary to appearances, the tropics and Antarctica - SH, contain the best examples of the potential GHG RF! By the way you see - a comparison of the Eemian - Greenland ice - that physicists of atmosphere do not know what it is: "post-glacial rebound" (...). ... and paper: Overland, Wang, and Walsh, 2010.: blog news - frequently asked question: since at least 2003, and especially in 2007 - it was a record warm in Greenland - similarly, with regard ice (mass, area) - why then the winters in the temperate zone NH were warm? -
Riccardo at 20:09 PM on 20 December 2010Lindzen and Choi find low climate sensitivity
VeryTallGuy it's even worse than that. The climate system does not have time to fully respond to a 6 months forcing; also, 14 W/m2 is the maximum peak-to-peak value and it should be average over half a cycle. You badly exagerated the response to the annual cycle :) Anyways, it's true that the NH winter would be a little worse if it occured at the aphelion. -
Paul D at 19:46 PM on 20 December 2010Stratospheric Cooling and Tropospheric Warming - Revised
RSVP said: "By double time, I am referring to a single packet of energy. If it gets into the air via CO2,(coming from a hot stone on the ground), the hot stone has just lost that heat. That is not double time. That is heat transfer." Firstly most people have a hard time decoding what on earth you are trying to convey and you return the favour to everyone hear by posting a number of replies by revealing more in a critical and patronising fashion. In future, if you get a number of responses and don't get an answer consistent with what you were expecting. I suggest you actually clarify your original query. RSVP said: "Most of this incoming energy is in the visible band, so the exchange you are talking about is favor of the stone getting a much larger share of it. And as far as the stone's cooling by radiating IR upward, the more CO2 above it, the bigger the sink for that IR." Indeed, does your ego feel better now? -
VeryTallGuy at 19:42 PM on 20 December 2010Stratospheric Cooling and Tropospheric Warming - Revised
RSVP @41 Why not do the calculation yourself - what's the difference in heat capacity for an atmosphere with 560 vs 280 ppm CO2? -
Paul D at 19:36 PM on 20 December 2010Stratospheric Cooling and Tropospheric Warming - Revised
RSVP: "The stone absorbs energy in the visible portion of the electromagnetic spectrum, CO2 does not (which accounts for it not being visible, unless cold enough to become dry ice)." You referred to a packet of energy, you did not refer to any particular flavour. I suggest in future that you make it clear what on earth you are talking about and what you mean. For a start, what exactly do you mean by a packet of energy. eg. if you want to be precise, then be precise, if you are talking about general principles then do so. But don't hide your intentions and play dumb games that you know are intended to disrupt without a view of making progress or helping others to understand. If you are not interested in the subject then leave the classroom and sign up for another course. -
VeryTallGuy at 19:36 PM on 20 December 2010Lindzen and Choi find low climate sensitivity
Oh, and here's a way to think about the 14W/m2 perihelion point you made to start with. 4W/m2 over (say) 100 years = 400 year watts/m2 energy change 14 W/m2 over 6 months = 7 year watts/m2 energy change So the effect of doubling CO2 over a century is 57x larger than the energy imbalance during the year. Assuming your unreferenced 14 W/m2 is correct - I haven't checked it and you haven't provided a reference. -
VeryTallGuy at 19:14 PM on 20 December 2010Lindzen and Choi find low climate sensitivity
RW1 @39 (in reply to my 38) You completely fail to understand what the 4W/m2 represents. Your point 5 implies that 4W/m2 is the upwards flux from the surface absorbed in the atmosphere, some of which goes up and some down. This is mistaken. 4W/m2 is the net change in power emitted at the top of the atmosphere. The number is the result of a stepwise line by line heat balance; your point that CO2 radiates in all directions equally has already been taken care of in the calculation. Repeating this ad nauseum does not make it correct. You cannot halve it just to make your calculation yield the result you want it to. -
Ebel at 18:40 PM on 20 December 2010Stratospheric Cooling and Tropospheric Warming - Revised
#40 RSVP at 17:22 PM on 20 December, 2010 "The only unexcited CO2 molecule I can imagine is one at zero Kelvin." The most CO2 molecule be unexcited. The ratio unexcited CO2 molecule to excited CO2 molecule is given from Boltzmann-Distribution exp(-hv/(kT)). -
archiesteel at 18:21 PM on 20 December 2010Lindzen and Choi find low climate sensitivity
Seriously, not only do you have the same writing patterns as damorbel, you seem hell-bent on using the same tactic: repeat your erroneous ideas over and over again, ignoring rebuttals, in order to waste everyone's time. Put up or shut up: provide concrete evidence that the current warming *isn't* caused by CO2, or go do something else with your precious Internet time. Whatever you do, *don't* start over with another user name - we can see right through that. -
archiesteel at 18:17 PM on 20 December 2010Lindzen and Choi find low climate sensitivity
@RW1: "I'm well aware that any CO2 warming will be in addition to, or on top of, the normal variations. I don't dispute this, and nothing I've written disputes it." Then why do you act as if that wasn't the case? It matters little that CO2's additional forcing is 30% of the seasonal variation. What matters is that the average global temperatures go up. "I'm saying there is no physical reason why the globe as a whole would respond any slower than the individual hemispheres do to increases in radiative forcing." Actually, there is a very simple reason. The cyclical changes revert back and forth too quickly to trigger any feedback. On the other hand, increasing global temperatures nudges the cycle out of its rut, triggering feedbacks. Anyway, the point is moot. You have failed to come up with any credible alternatives to CO2 for the current warming. I don't understand why you continue to act as if you had a leg to stand on, because you don't. -
RSVP at 17:41 PM on 20 December 2010Stratospheric Cooling and Tropospheric Warming - Revised
#40 "So the only thing that can happen if one CO2 dumps some energy to another is for both to get less excited (i.e. cooler). " correction of my own post... One will get a little more excited, and the other a little less excited. However, the net temperature should remain unchanged. -
RSVP at 17:33 PM on 20 December 2010Stratospheric Cooling and Tropospheric Warming - Revised
JeffT #32 "The result of increasing CO2 is an imbalance: solar energy is still arriving, but it's not leaving as fast." If you douse a campfire with water, in order to quench it faster, do you pour more, or less water? Normally the concern in such occasions is not how hot the water gets, but in any event, the more water you dump, the less it will warm on the whole. This is because the more water you dump, the more thermal mass you are providing for transfering heat from the embers and stones to the water. Why doesnt this happen to CO2 as the concentrations increases? Afterall, isnt the amount of energy coming from the Sun the same? -
RSVP at 17:22 PM on 20 December 2010Stratospheric Cooling and Tropospheric Warming - Revised
The Ville #30 "CO2 is no different to a hot stone" The stone absorbs energy in the visible portion of the electromagnetic spectrum, CO2 does not (which accounts for it not being visible, unless cold enough to become dry ice). The Ville #30 "The stone is continually receiving packets of energy (during the day), as would the CO2." Most of this incoming energy is in the visible band, so the exchange you are talking about is favor of the stone getting a much larger share of it. And as far as the stone's cooling by radiating IR upward, the more CO2 above it, the bigger the sink for that IR. Alec Cowen #31 "What makes you think that the post is saying something like what you are describing... " The article states "The interaction of IR radiation with CO2 is a two way street in that IR radiation can interact with unexcited CO2 molecules and cause them to vibrate and become excited and excited CO2 molecules can become unexcited by releasing IR radiation." I mentioned dry ice and the article talks about an "unexcited CO2 molecule". The only unexcited CO2 molecule I can imagine is one at zero Kelvin. Dry ice forms way above that, and CO2 in its gaseous state is at a still higer temperature and generally speaking, excited. So the only thing that can happen if one CO2 dumps some energy to another is for both to get less excited (i.e. cooler). -
Daniel Bailey at 17:22 PM on 20 December 2010Stratospheric Cooling and Tropospheric Warming - Revised
His words:"Since 1996, lunar eclipses have been bright, which means the stratosphere is relatively clear of volcanic aerosols. This is the longest period with a clear stratosphere since before 1960."
So what, exactly, is the point of your comment, Camburn? Because it seems to be along the lines of:"I drink coffee and marsupials have legs"
To put confidence into a presentation at a conference funded by a petroleum-shill instead of work vetted in peer-reviewed publications by actual working climate scientists speaks volumes... An analysis of Keen's other body of work can be found here. The Yooper
Prev 2032 2033 2034 2035 2036 2037 2038 2039 2040 2041 2042 2043 2044 2045 2046 2047 Next


