


 Arguments


Recent Comments
Prev 2060 2061 2062 2063 2064 2065 2066 2067 2068 2069 2070 2071 2072 2073 2074 2075 Next
Comments 103351 to 103400:
-
Tom Dayton at 15:56 PM on 5 December 2010It's albedo
Rovinpiper (bagpipes?), try playing with this calculator. -
Ned at 15:56 PM on 5 December 2010It's albedo
Hi, Rovinpiper. Good questions you're asking. Kirchoff's Law refers to absorptance and emissivity at the same wavelength -- i.e., an object's emissivity at a given wavelength will equal its absorptance at the same wavelength. In the case of a planet (e.g., earth), almost all the radiation it receives from the sun is at short wavelengths (UV, visible, and near-infrared). In contrast, all the radiation it emits is at long wavelengths (> 3 micrometers). So, a change in the earth's albedo can increase or decrease the amount of energy that is absorbed, without necessarily increasing or decreasing the amount of energy that is emitted. When this happens, the planet then warms or cools until the outgoing radiation is once again in balance with the incoming radiation. Hopefully that's clear. It's around midnight here and I'm not really a night person, so my explanations may not be all that coherent...... -
Rovinpiper at 15:44 PM on 5 December 2010It's albedo
Hi Tom, Thanks for replying to my question. Do you have a solid source for a proof of that? I just read about Kirchoff's Law and it seems to say that if the Earth becomes more reflective it becomes less emissive by an equal amount and so temperature remains unchanged. -
michael sweet at 15:04 PM on 5 December 2010A Cloudy Outlook for Low Climate Sensitivity
Excellent post Dana. It is so sad that the data look so bad. -
Leland Palmer at 14:42 PM on 5 December 2010Positive feedback means runaway warming
Hi muoncounter- I've read one of Archer's papers, but it's been a few months and I'll reread it. I'd feel more confident in Archer's stuff if he hadn't written several joint papers with ExxonMobil chief scientist Kheshgi: ExxonMobil Contributed Papers on Climate Science17. Archer, D., Kheshgi, H., and Maier-Reimer, E. 1997. Multiple Timescales for the Neutralization of Fossil Fuel CO2, Geophysical Research Letters, 24: 405. 19. Archer, D., Kheshgi, H., and Maier-Reimer, E., 1998. The dynamics of fossil fuel CO2 neutralization by marine CaCO3, Global Biogeochemical Cycles, 12:259-276. 35. Kheshgi, H. S. and Archer, D. 2004. A non-linear convolution model for the evasion of CO2 injected into the deep ocean. Journal of Geophysical Research,109, C02007, doi:10.1029/2002JC001489. 13. Kheshgi, H. S., and D. Archer, 1999: Modeling the Evasion of CO2 Injected into the Deep Ocean, in Greenhouse Gas Control Technologies, edited by B. Eliasson, P. Riemer and A. Wokaun, pp. 287-292, Pergamon.
I can see why an earth scientist might collaborate with ExxonMobil, or it's chief scientist. They undoubtedly have a monumental knowledge of geology, and an immense treasure trove of geological information. Having said that, though, Archer's estimate of the total amount of methane hydrates is on the low end of current estimates. It's a really important subject, and I'll get my information about it from sources with no known connection to ExxonMobil. -
Roger T. Thomes at 14:05 PM on 5 December 2010A Cloudy Outlook for Low Climate Sensitivity
This is a superb article. Here is something that is not dumbed-down. There are enough facts on this topic to allow the readers to make their own conclusions.--R.T. Thomes -
dana1981 at 13:37 PM on 5 December 2010A Cloudy Outlook for Low Climate Sensitivity
My name's not John, but thanks dansat! Bob Guercio - I agree, the odds are not too good that Lindzen and Spencer are right. Not nearly good enough to bet the farm on. -
Bob Guercio at 13:16 PM on 5 December 2010Stratospheric Cooling and Tropospheric Warming
Daniel, This is the other cause of cooling of the stratosphere. However, this is relatively easy to understand and I do not want bring it into my writeup because it will only confuse the very complex mechanisms that cause greenhouse gases to cool the stratosphere. But yes. Thinning of the ozone layer also causes the stratosphere to cool. Bob -
Bob Guercio at 13:06 PM on 5 December 2010A Cloudy Outlook for Low Climate Sensitivity
Richard Lindzen and Roy Spencer believe that the formation of low level clouds resulting from global warming will result in a negative feedback keeping the warming in check. I just don't get it! How much statistical certainty do they have that this is going to happen? My guess is "not too much" so where is the logic in taking such a chance with our only world. Furthermore, suppose they can give a certainty which is ridiculously high, say 99.99% Does it really make sense to allow the chemistry of the planet to change so drastically considering the unknown and potentially devastating consequences? Like I said "I just don't get it!" Bob -
dansat at 12:51 PM on 5 December 2010A Cloudy Outlook for Low Climate Sensitivity
That's a heavy weight paper. Had not seen it yet. You deserve your growing reputation John! Thnx for the post! DanResponse: This post was written by Dana (who does deserve his heavyweight reputation as he's written most of the advanced rebuttals). -
Daniel Bailey at 12:47 PM on 5 December 2010Stratospheric Cooling and Tropospheric Warming
From one following the discussion as best I can, thought I'd throw this out there:"The loss of ozone that has occurred in the Antarctic lower stratosphere during each spring since 1980 has led to a decrease in the lower stratospheric temperature that persists into the summer season." "Comparison of the summer temperatures in the NH and SH indicates a distinctive offset beginning around 1980. The increase in temperature near the SH summer mesopause has implications for the presence of polar mesospheric clouds." "The Antarctic ozone hole is perhaps the largest persistent perturbations to the atmosphere during recent decades. As shown here, the climate impacts of this anthropogenic change extend into the upper mesosphere. As the ozone recovers in upcoming decades, we expect to see shifts in the SH summer mesopause that bring it closer to that in the NH."
From a science news article in Science daily; free copy of source study available here. A good chunk of the study goes over my head, like much of this thread. But these caught my eye (eye-candy, heh-heh): and
and
 If this was discussed already here, my apologies.
The Yooper
If this was discussed already here, my apologies.
The Yooper
-
Rob Painting at 12:18 PM on 5 December 20102009-2010 winter saw record cold spells
Muoncounter - I'm talking about the cold winter UK, in particular, being a regular occurrence, based on changes in the Arctic Oscillation. Not the "but there's record cold in Wagga Wagga" or whatever line the skeptics cling to. Sure it's likely to be a transient phase (the rest of the world will still be getting warmer) but I expect a similar future break-down in the circum-polar winds around Antarctica (Southern Annular Mode) will lead to similar outbreaks of cold weather. Living in New Zealand, that may affect me personally, but I probably won't be around when that happens.
-
muoncounter at 12:04 PM on 5 December 20102nd law of thermodynamics contradicts greenhouse theory
#299: "nonsensical claim that planetary albedo is irrelevant to temperature" We went through a week or so of back-and-forth on the Chaos theory and global warming thread over 'climate calculators' that show specifically how albedo influences temperature. Seemed like a no-brainer at the time. -
muoncounter at 11:54 AM on 5 December 2010The human fingerprint in the seasons
#69: "It isn't exactly what I was expecting." When you do mean:66 after doing every:12, aren't you averaging 66 years? Cutting back even to a 30 year mean gives a cleaner break between NH summer and winter; SH summer and winter are overlain. -
Tom Curtis at 11:48 AM on 5 December 2010Stratospheric Cooling and Tropospheric Warming
Bob @133, this is correct, and I must have misunderstood what you where asking. My claim was only about the stratosphere which will (I believe) reach a steady state very quickly given constant inputs. Whether "very quickly" is a few month or a couple of years I'm not sure. @144, I believe this is correct, with motion of the whole molecule contributing to temperature, while vibration contributes to heat capacity. I am, however, not sure. In passing, Joe Blogg's first paragraph @146 is a brilliantly succinct explanation of optical depth as related to this issue. Regarding your furture article, in a topic this subtle, I suspect it would be better to write an advanced version first, and only post a basic version once the advanced version is up. When you write a basic article, you may be able to do something along the lines of comment by Nullius in Verba at Science of Doom. Doing this, I would not treat the temperature profile as a rigid bar, but rather treat the stratosphere seperately from the troposphere. Essentially, you would be appealing to the not often commented upon fact that in the presence of a negative lapse rate, greenhouse gasses cool rather than warm. -
Tom Curtis at 11:06 AM on 5 December 2010The human fingerprint in the seasons
@69, I don't particularly like that analogy because blankets work by limiting convection. As such they can have very low emissivity and their final radiant energy can still be much less than the initial radiant energy of the body covered. However, going with the analogy, it is more accurate to consider a blanket partially covering a cold blooded animal. Once a steady state is reached, there will be less energy released per unit surface from the blanket than there is from the exposed body, or there was from the exposed body before being covered. -
Tom Curtis at 10:56 AM on 5 December 2010The human fingerprint in the seasons
Chris G #67, you may be failing to consider that the troposphere is optically thick in the 15 micron (CO2) band, while the stratosphere is optically thin. Because the troposphere is optically thick, if you increase CO2 the net outgoing radiation will stay relatively constant but originate slightly higher in the atmosphere. (The increased altitude will mean the source CO2 will be slightly cooler, resulting in a slight reduction in outgoing CO2.) In contrast, because the stratosphere is optically thin, absorption will approximate to the Beer-Lambert law, so doubling CO2 will approximately double absorption and emission. The effect of this depends on the difference between tropospheric and stratospheric temperatures. If the stratosphere were cooler than the upper troposphere by an amount greater than the change in temperature at the effective altitude of radiation for the troposphere, then the effect would be to warm the stratosphere. Otherwise the effect is to cool it. More importantly, doubling CO2 concentration will double the amount of energy absorbed by CO2 in collisions; and double the amount of that collisional energy radiated away by CO2. A significant source of that energy is UV radiation absorbed by ozone. Because, with higher concentration, the CO2 would be radiating away that energy more efficiently, the stratospheric temperature will drop to reestablish a steady state. I believe this to be a larger effect than the first one. I have discussed this in more detail on the Stratospheric Cooling post on this site, particularly at comment 83 and comment 120. -
Camburn at 10:48 AM on 5 December 2010Renewable Baseload Energy
Rob@351: 1. I do think the electric populsion of masses is going to happen. That is not very far away. Utilities are already planning how to sell more electricity. 2. Most of the "power up" is going to happen in the late night, early morning. 3. That in itself will require a more constant source of power. I agree, we need to do everything we can to limit the use of fossil fuels. They are a finite resource and should be used ONLY when necessary. It is obvious that solar is in its infancy. Nuclear is a mature energy source. Yes, in the US we have lots of NIMBY folks. We have fallen behind the rest of the world in thinking it seems as the rest of the world is building and planning to build 150 nuclear power stations. We are at one presently. Pretty dumb isn't it? http://www.world-nuclear.org/info/inf17.html -
Ned at 10:44 AM on 5 December 20102nd law of thermodynamics contradicts greenhouse theory
OK. So, damorbel recently wrote this gem: The wavelenth difference is indeed great but what that count for? Sure it indicates that the Sun/Earth system is in considerable disequilibrium. But the only significance of this is the nature of the disequilibrium, which is precisely what we are talking about, the contradiction of AGW/GHE 'science' and the 2nd Law of thermodynamics, exactly the OP topic of this thread. Now, he/she tries to explain it, but the only explanation is: (1) The difference in the wavelengths of radiation emitted by the sun vs. by the earth means that the sun and the earth are not at the same temperature. (2) This temperature difference means that heat will flow from one to the other. It should be obvious that this contributes nothing whatsoever of value. None of this justifies damorbel's nonsensical claim that planetary albedo is irrelevant to temperature ... and none of it has anything to do with AGW, let alone proving a "contradiction" between AGW and the 2nd law of thermodynamics. Damorbel, did you ever read the last paragraph of this comment? Did you understand it? I'd also note that damorbel has still not explained why he/she approvingly cites an explanation at wikipedia that explicitly relies on the exact same mechanism that he/she thinks violates the 2nd law of thermodynamics. -
Chris G at 10:37 AM on 5 December 2010The human fingerprint in the seasons
I don't know enough geology to produce heat content measurements for land, though I have seen heat content papers of the oceans. However, it struck me that NH versus SH should be similar if I were right about the heat content at depth. So, I tweaked my graph. No disrespect to Muoncounter, but I'm not sure which three samples 'mean:3' is applied to at WoodForTrees; so, I stuck with my first method for now. Besides, as much data is being aggregated already, I doubt that the additional months will change the shape much. Sea Surface Temperature Anamolies 2x2 of NH-SH, January-July It isn't exactly what I was expecting. Instead of NH and SH being very similar, instead, the SH is showing more disparity between winter and summer warming than the NH is. I wonder if I'm just seeing a random correlation or if there is a physical reason for this difference. I'd hazard a guess that it might have something to do with the north pole being in the middle of an ocean and the south pole being in the middle of a continent. Tom Curtis, Continuing... To use a loose analogy, if there is a body being heated by some relatively constant energy source, and you cover it with a blanket, until a new equilibrium temperature is reached, the blanket will be cooler and radiate less energy than the body used to. But, after a new equilibrium is reached, it will radiate exactly the same. Of course, the body will be warmer. -
Phil at 10:31 AM on 5 December 2010The human fingerprint in the seasons
actually thoughtfull @65 I still think you are missing HR's point. If you need to invoke TSI measurements then this work does not supply new independent evidence for an increased GHE, because you are reliant on the TSI measurements to interpret the results "correctly". I'm no expert in this field but it seems to me that Michael Sweet @24 had a good point: Given the short lifetime of Water Vapour in the atmosphere then surely it responds to the changing local solar irradiance, but not to heat "trapped" by CO2. Given that, it seems that this work is more convincing the Nighttime/Daytime argument when WV has less time to respond. -
Spaceman Spiff at 10:03 AM on 5 December 2010Stratospheric Cooling and Tropospheric Warming
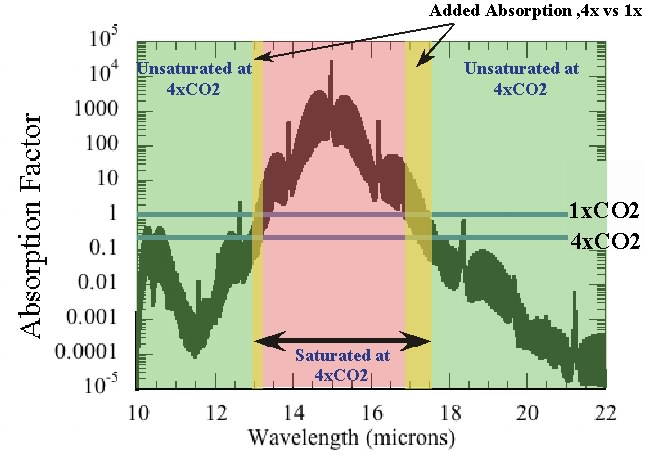
Sphaerica at 03:12 AM on 5 December, 2010: You said: "So CO2 prevents energy from escaping from the troposphere into the stratosphere in the CO2-IR bandwidth, and CO2 actively cools the stratosphere by emitting energy in the CO2-IR bandwidth." This is not correct. CO2 within the troposphere is responsible for emitting most of the light within the 13.5-17 micron CO2 band. This light (except for the sharp spike right near 15 microns) emerges from somewhere within the mid and upper troposphere, where the gas is just becoming optically thin to those transitions. This is what is meant by a "photosphere". The light of stronger transitions (near the bottom of the CO2 spectral feature) will emerge higher up in the troposphere (where the density is lower and the remaining path length out is shorter), where the T is lower and so the thermal emission is weaker. The light of weaker transitions emerges from deeper within the troposphere, where T is higher and thus the thermal emission is greater (the walls of the CO2 spectral feature). Have a look at the figure (from RealClimate) I posted in #126: CO2 absorption strength vs. wavelength. Nearly all of this radiative energy passes through the stratosphere, with the exception of the very strongest transitions lying very near to 15 microns (the sharp spike in the figure I linked to, and visible by running a default radiative model from Archer's website). The photosphere for these transitions lies in the stratosphere, where T is higher and thus so is the emission intensity. -
Chris G at 09:57 AM on 5 December 2010The human fingerprint in the seasons
So Tom (#54), Convection is a result of lower air holding more energy (or being warmer, and thus relatively less dense on a curve described by atmospheric density driven by gravity and PV=nRT) than the air above it; where does this energy come from if not radiated or conducted from the surface? Convection is a movement of matter, not really a transfer of energy from some matter to some other matter. Flippancy aside, I see your point that the stratosphere will radiate more with more CO2, but it is also true that the troposphere will absorb more with more of any GHG. If it absorbs more, it will also be warmer and radiate more. What I've read leads me to believe that stratospheric cooling has more to do with the radiative imbalance that the earth is currently in. Mouncounter, Thanks! Don't mind at all, wouldn't have posted what I had if I wasn't looking for some other ways of doing it. Thinking more on the difference between the degree of warming of the NH compared to the SH. I would hazard a guess that it has something to do with the NH having a lot more land surface than the SH. Heat at the surface of the ocean gets distributed downward a lot more readily than heat at the surface of land. So, you'd want to look more at heat content down to some depth than surface temperatures. -
Joe Blog at 09:55 AM on 5 December 2010Stratospheric Cooling and Tropospheric Warming
Bob Guercio at 08:51 Yes, its one of those subjects that takes a bit o nutting out... but then it all becomes clear, and the T profiles vrs altitude suddenly make sense. It was something that took me many hours to fully "get". (thanks to science o doom, and Ramanthan and Dickinson) -
muoncounter at 09:51 AM on 5 December 20102009-2010 winter saw record cold spells
#14: "become an annual skeptic talking point. " It already has. Try searching 'coldest November in living memory'. But here is some interesting anecdotal perspective on historic winters in the UK. -
Tom Dayton at 09:28 AM on 5 December 20102nd law of thermodynamics contradicts greenhouse theory
No, damorbel, you are incorrect that "the total scattering depends only on the amount of scattering material." Scattering does depend on frequency of the radiation and the size of the reflecting matter. But your obsession with scattering is not relevant to absorption, which is the problematic behavior of greenhouse gases. Just to get you off of your reflection obsession, let's assume that you are correct that the same amount of radiation emitted by the atmosphere, water, and land toward space are reflected back, as the amount of radiation coming from the Sun that is reflected by all those. As that emitted radiation is on its way toward space, before it is reflected back down, some of it is absorbed by greenhouse gases. The absorbed radiation's energy can't be reflected, because it's not in the form of radiation any more. Only some of that energy immediately is turned back into radiation. So right there you've got a greenhouse gas trap of radiation and therefore a trap of energy, completely in addition to any reflection. Even if you were correct about reflection (you're not), the greenhouse gas absorption effect would exist, so increasing greenhouse gases would trap more energy. -
Bob Guercio at 08:51 AM on 5 December 2010Stratospheric Cooling and Tropospheric Warming
Joe, As I reread what you wrote, I realize that you were correct. I needed time to digest everything and put the pieces together. Thank you, Bob -
Joe Blog at 08:43 AM on 5 December 2010Stratospheric Cooling and Tropospheric Warming
Bob Guercio @ 145 Yes... but the thing is with the denser atmosphere at lower altitudes, is that what is emitted by co2, is absorbed by co2, simply because there are more molecules per volume. As you rise in altitude, with the reducing pressure, the molecules absorb less and less of the emitted radiation of their neighbors. Just due to the distance/space between molecules. So at lower altitudes, even though a molecule at a warmer T is emitting more, its simply swapping energy with its neighbors. But once you reach the tropopause, the distance between molecules, means that more energy escapes than what is absorbed from its neighbors. I tried to explain the reason for this at 57. Collisional exchanges with a gas at radiative equilibrium, will mean that energy is being deposited into the n2, o2, when the co2 is a net radiator, the collisional exchange will work the other way, from the warmer n2 @ o2 to the cooler co2(because it is loosing energy through radiation.) -
muoncounter at 08:42 AM on 5 December 2010The human fingerprint in the seasons
#63: "either a solar or CO2 initial forcing will be accompanied by a strong H2O GHG positive feedback" The cause and effect of this mechanism seems a trifle thin and the story quickly becomes quite convoluted. a. If we postulate that once the initial solar or CO2 forcing gets a warming cycle started, do we then suggest that H2O feedback alone is sufficient to keep it going? Is H2O feedback sufficient to restart the warming system after a transient cooldown, such as a Pintatubo type event? b. If solar alone is the initial forcing, where is the record of that solar event? Have they happened in the past? Where are those records? c. How can CO2 be an 'initial forcing', when CO2 forcing continuously increases with the log of the CO2 concentration relative to 'pre-industrial'? Initially the ratio of CO2 to pre-industrial would be close to 1 and its log close to 0. d. If it is accepted that CO2 is the initial forcing, why is the same mechanism (CO2 forcing) not continuously doing the forcing? How does it get switched on and off? As I said, convoluted. It is stunning that some folks will accept these complicated schema when there is a far simpler answer at hand. -
actually thoughtful at 08:36 AM on 5 December 2010The human fingerprint in the seasons
Sphaerica - we KNOW there is no notable solar input to the current warming - from direct measurements of insolation, not from the seasonal patterns this post discusses (although the data here re-confirms the fact of no solar fingerprint). It seems my analogy stands. -
Rob Painting at 08:33 AM on 5 December 20102009-2010 winter saw record cold spells
11 & 12 - Sure it's not winter 2009-2010, but given the change in Arctic weather patterns, it may become an annual skeptic talking point. -
Rob Honeycutt at 08:21 AM on 5 December 2010Renewable Baseload Energy
Camburn @ 350... Can you really not see that you are doing exactly what you are claiming renewables proponents are doing? You are presenting nuclear as a "proven technology" that we should be "crowing from the rooftops" about. That says to me that you are completely ignoring the inherent negative aspects of nuclear. And again, you are also ignoring that nuclear can't switched off when people go to bed at night. That means you run spin reserve. So, ultimately nuclear is not very flexible. The larger a percentage of output that is dedicated to nuclear the less efficient it is. Renewables are exactly the opposite. Everyone here is saying both are needed to address the issue of AGW. Neither is a panacea. Both have strengths and weaknesses. But we need to do everything we can to limit our use of fossil fuels. The only thing I'm going to crow from the rooftop about is our political leaders accepting publicly that we need to address this important issue so that we can begin to get serious about it. -
Bob Guercio at 08:15 AM on 5 December 2010Stratospheric Cooling and Tropospheric Warming
Guys, I guess I'm thinking of one thing after another. The troposphere. More CO2 so more absorption of IR. This causes the vibrational energy of CO2 molecules to increase. Somehow this vibrationalal energy gets converted to K.E. to increase the temperature. In this case, a collision results in more k.e. of the particles. Right? My intuition here is not as solid even though this is probably what is happening. Bob -
Bibliovermis at 08:12 AM on 5 December 2010The human fingerprint in the seasons
The prescription medicine would still be detectable through multiple methods. Historical solar irradiance changes are also detectable. -
Bob Guercio at 07:55 AM on 5 December 2010Stratospheric Cooling and Tropospheric Warming
Sphaerica and everybody else who helped me. I'm sure that temperature differentials play a role in all of this but getting into that would just add complexity to a nice and simple model and make the essence of all of this more difficult to understand. Do you agree? Bob -
Bob Lacatena at 07:52 AM on 5 December 2010The human fingerprint in the seasons
actually thoughtful, I think you missed HR's point. The fact is that either a solar or CO2 initial forcing will be accompanied by a strong H2O GHG positive feedback. That strong positive feedback will have the same GHG signature, and that will obscure the fact that in the case of solar forcing the initial forcing does not have such a signature. In your analogy, a better example would be for two different drivers, one who drank a lot of alcohol, and another who drank a little bit of alcohol, but combined it with prescription medicine. Both test positive for a blood alcohol content over the limit, and both caused horrific car crashes, and in that way the two are difficult to distinguish, but the prescription medicine distinction is lost without further evidence to support it. -
Bob Guercio at 07:42 AM on 5 December 2010Stratospheric Cooling and Tropospheric Warming
Sphaerica, You said: As a result, the CO2 in the troposphere is more likely to absorb IR in that narrow CO2 band, but then passes it on through collisions to the abundant, non-emitting O2/N2, raising temperatures and somewhat "blocking" that band of radiation. Alternately, the CO2 in the more rarefied stratosphere is more often excited by collisions with the more abundant O2/N2, and emits the gained energy through radiation before it can pass it on through another collision. Me: I can't believe this but I understand this perfectly. I've had one of those Eureka moments. I'll add one fine point for total clarity or maybe I'm simply rephrasing what you guys have said. And I'm keeping with my very simple model of an atmosphere of two layers, the troposphere and stratosphere and composed only of nitrogen and carbon dioxide. Temperature depends only upon the kinetic energy of the molecules. Thus, after a collision, a molecule with no vibrational energy may now have vibrational energy and that molecule has less kinetic energy. So this diminution of kinetic energy from multiple molecules lowers the temperature. That molecule that has more vibrational energy deexcites and emits IR that may be absorbed by another deexcited molecule or it may simply fly off into space. This IR flying off into space is kinetic energy that is now lost forever from the stratosphere. I also now believe that, as Tom has stated, it doesn't matter whether we are talking about the steady state or the transient state with these states being as I have defined them. So I can now make my model simpler yet. I won't talk about whether or not we are at equilibrium! It's amazing how much you can do in Physics without the heavy mathematics. Just say "you've got it!" and I'll run with it. I also would like all you guys that helped me to send me email so that I can acknowledge you with your real names and, something tells me, titles. robertguercio@optonline.net Thank you, Bob -
Bob Lacatena at 07:41 AM on 5 December 2010Stratospheric Cooling and Tropospheric Warming
Bob,Are you guys interpreting these two very important emails the same way that I am?
Yes, I think that's exactly it, it all seems to add up to the fact that the primary mechanism by far is IR emission by CO2 in the stratosphere, as professor Robock explicitly says and Gavin implies when he says "First, all GHGs emit as well as absorb, and whether you will get warming or cooling in a region depends on the ratio of the change in absorption and the change in emittence." I think Gavin's spot-on comment probably meant that what you told him was correctly stated, but he didn't emphasize how much importance lay in the pieces missed. -
damorbel at 07:34 AM on 5 December 20102nd law of thermodynamics contradicts greenhouse theory
Re #294 Tom Dayton you wrote:- " I can't get past even your second paragraph, which seems to be gibberish." My 2nd para. goes like this:- 'Sun/Earth system is in considerable disequilibrium.' You may not be familiar with the thermodynamic meaning of the term 'equilibrium'; a thermal system is out of equilibrium when there is a temperature difference inside the system. This means that the entropy is below the maximum and there will be energy transport within the system according to the 2nd law of thermodynamics. The reason why the wavelength of incoming radiation is of no great importance is fairly simple; incoming radiation is either scattered (the albedo or reflected, if you like) or absorbed; the third possibility, transmitted, is not generally considered in planetary physics for reasons that should be self-evident. By definition the absorption does not affect the scattering, it is the scattering that affects the absorption. However it remains true that the scattering that gives the albedo its characteristic wavelength function i.e. its spectral characteristic. From this you will realise that the total scattering depends only on the amount of scatteing material present and the magnitude of the scattering is independent of the direction of arrival of the scattered wave; meaning the material that causes the albedo (scattered solar radiation) will have the same total effect on the emitted radiation, even though the response is in a different part of the spectrum. It is this that makes the emissivity and absoptivity the same in terms of power, even if not at the same frequency. -
Billhunter at 06:54 AM on 5 December 2010A basic overview of Antarctic ice
Albatross at 05:19 AM on 5 December, 2010 "PS: I have not "cherry-picked" data, nor is applying an OLS model and stating the statistical significance of the model fit "arm waving"." I didn't mean to imply you were arm waving. My reply was to Phillipe. I think our conversation was being productive until Phillipe stepped in and flat made a claim that global ice loss was statistically significant because on a graph it appeared to be. There was nothing unique about such an observation because we know ice melts and we can see it. My similar statement was not based on the visual graph but was a rough rule of thumb mathematical estimate of the effect of reducing the ice loss percentage by 30 to 40% from subtracting the antarctic ice gain from the arctic ice loss and by increasing the extent by 50% by adding the Antarctic maximum extent to the Arctic maximum extent. Should come out to be roughly the same significance as the Antarctic ice gain though it may fall on either side of the arbitrary significance line. Perhaps Phillipe misinterpreted what I was estimating. Consistently pursuing these arguments will remove any arm waving whether intended or not. Then of course to move the conservation forward in the spirit of consistency, it is always important to include all the elements of a theory in your theory. If the theory is feedback from loss of polar albedo (polar amplification) then the antarctic land mass should also be included in the calculations to estimate the significance of polar albedo loss (and polar amplification) to determine if the loss of albedo is in fact currently statistically significant. I think this is entirely consistent with the mathematical approach you offered in post #74 and allows each argument to be fully weighed in and avoid inconsistencies. My comment on "other months" was simply a layman's observation that the arctic ice extent differences seem relatively compressed during the equinoxes as opposed to the solstices. Since albedo is an ongoing year round phenomena I simply thought they should also be included though I realize that significantly ups the workload. I think it is important to get to solid answers as populations and the use of plant resources continue to accelerate. And the only way to get to solid answers is through a combination of critical, complete, accurate, and consistent collection and evaluation of data. Where we can go astray as a specie is through improper weighting of risks. The weighting of risks is inherently (philosophically and functionally) democratic in nature as none of us possess crystal balls and crystal balls is all we have until we get solid answers. Because of that fact, the only thing to be achieved by inconsistency is the exact opposite of that which we wish to achieve. That issue has already been well explored in philosophical and psychological literature and represents an ongoing concern supporting the viewpoint of Judith Curry. -
muoncounter at 06:39 AM on 5 December 2010We're heading into an ice age
#150: "poor ability to predict the glacial cycle using models" You are aware that the Oerlemans paper you refer to bases its explanation on a model study? Experiments with a Northern Hemisphere ice-sheet model show that the 100,000-yr cycle and its sawtooth shape may be explained by ice sheet/bedrock dynamics alone. This cycle seems to be an internally generated feature and is not forced by variations in the eccentricity of the Earth's orbit. Too bad just about everybody else goes with the orbital variations. -
Ned at 06:36 AM on 5 December 2010Positive feedback means runaway warming
It probably goes without saying, so I didn't bother saying this in my comment above. But obviously the consequences of a Venusian style runaway warming are so completely unacceptable, that even a very small probability of that outcome needs to be taken seriously. So I guess I'd characterize my position as "this is very unlikely to happen, but we should be investing a lot more in understanding the relevant processes (clathrates, etc.) just in case". -
actually thoughtful at 06:32 AM on 5 December 2010The human fingerprint in the seasons
Humanity Rules introduces a new, high bar for a fingerprint. Let's apply it to a different milieu and see what happens. I go out and get drunk. I drive home, hit another car with a woman and 2 kids. They all die. One would expect that I would be charged and convicted with vehicular manslaughter, DUI and a few other crimes. Enter HRlogic! As I myself did not hit the other vehicle (it was rather my vehicle that hit their vehicle; indeed those poor unfortunates did not die from *my* car - it was instead various objects within their own vehicle that led to their untimely death. No fingerprint here). But it gets worse! My actual fingerprints are on the glass that contained the alcohol - 1) I didn't touch the alcohol 2)Even if you ignore the HRlogic in (1) - yes, I drank the alcohol - the fact that this alcohol interacted in predictable, knowable ways with my own biochemistry is not my fault - my only fingerprints are on the glass! The jury, following HRlogic, finds me innocent! I am back in the bars now. HR - care to drive in my town around 2am (when said bars close and me and my HRlogic fingers are driving home again)? -
muoncounter at 06:24 AM on 5 December 2010The human fingerprint in the seasons
#52: Chris G, nice approach! Hope you don't mind, I tweaked it a bit and came up with a similar plot. I started in 1900.05 (January 15) and used a 3 sample average (hoping this would give a seasonal winter, ie DJF average). Then picked every 12 (should now be each winter) and then applied a smaller mean (since the dataset should now be sampled in years). Similarly for summers (JJA) beginnning in 1900.6. I hope I'm not reading too much into WFT's ability to resample monthly data into annual. Indeed winter rises faster than summer, although not by as much as NH rises faster than SH. -
Camburn at 06:20 AM on 5 December 2010Renewable Baseload Energy
Rob@348: No one thinks nuclear is the only solution. People who believe in AGW should be shouting from the rooftops for nuclear. It is proven tech. They aren't. It shows the falasy of their arguement. Baseload is extremely important to people. Cost is extremely important to people. I don't believe in the magnitude of GAWG that some do. The error bars, the missing links in the hypothosis all point out that it is not as strong as some would have others believe. I am a conservative, and have not figured out, now that the opportunity has presented itself, why we are not building more nuclear baseload plants to take the place of coal/petroleum/gas power plants. We have a resource that is available for over 1,000 years. Rather than burn a short term finite resource, it makes much more sense to use a long term resource. The cost of implimenting a grid system to try and provide "baseload" ability of solar/wind is huge. We have infrastructure in place to utilize nuclear right now. Reliable, baseload power. The future is in elec vehicles for short spans of travel. Those vehicles will be recharged at night for the most part. Interuptions of available electricity will only slow the advancement of elec propulsion on a large scale. That is why in an earlier comment I stated that CPS makes sense in the southwest, but not really anywhere else. Nuclear can and should be filling that gap. It is a win win for everyone. -
cjshaker at 06:14 AM on 5 December 2010We're heading into an ice age
This article is quite interesting as well. It explains ice sheet/bedrock dynamics, and explains the rapid deglaciation. He also contends that ice sheet/earth crust dynamics are enough to explain the 100,000 year cycle. He contends that raised bedrock and low summer insolation are enough to start the next glaciation cycle. http://igitur-archive.library.uu.nl/phys/2007-0730-200322/oerlemans_80_modelexperiments100000yr.pdf Chris Shaker -
cjshaker at 06:03 AM on 5 December 2010We're heading into an ice age
Daniel Bailey asks And your source for that claim would be...? Re: cjshaker >"I think the bottom line is that climate modelers don't really understand the glacial >cycle, nor how it really works." I make that claim because of articles like this one, which appear to show poor ability to predict the glacial cycle using models http://www.igsoc.org/annals/5/igs_annals_vol05_year1984_pg213-214.pdf And this one, which attempts to use spectral analysis to predict future behavior of the glacial cycle http://www.nosams.whoi.edu/PDFs/papers/surveysingeo_time_series.pdf Chris Shaker -
Albatross at 05:19 AM on 5 December 2010A basic overview of Antarctic ice
Bill, "Since it appears to be statistically insignificant it probably either is or very close to it." Now the goal posts shift, again. OK, I'll look into that for you. But I have a bunch of things to take care of this weekend...so please be patient. Actually, I do not have the global data for sea ice. Those data I showed earlier were area from NSIDC while the graph I posted was extent data from "Cryosphere today". PS: I have not "cherry-picked" data, nor is applying an OLS model and stating the statistical significance of the model fit "arm waving". The reason for me selecting the months I did is because (if you have read the original post) we have been discussing the impact of changes in albedo around the time of the solstices. -
actually thoughtful at 05:01 AM on 5 December 2010Renewable Baseload Energy
Based on this thread, I have come to some conclusions for energy goals in the United States. Currently electricity comes from the following sources: 2005 energy production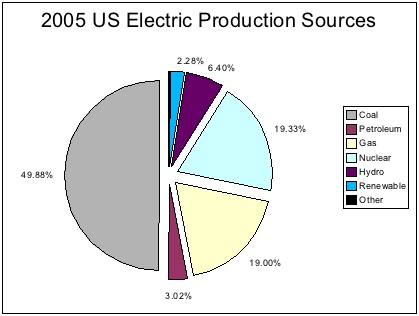 Source:
http://montaraventures.com/blog/2006/10/09/how-does-the-us-produce-electricity/
So, we need a future that is different. Based on the statement that 60% of energy consumption is baseload, we should aim for for a fossil free future that looks something like this:
coal 0%
nuclear 30%
petroleum 0%
hydro 5%
renewable 65%
gas backup (normally not used, but available): 20%
This will require an intermediate stage where gas takes on a larger role as we get off of coal and ramp up renewables and supporting technologies.
Moderator Response: Fixed image tag.
Source:
http://montaraventures.com/blog/2006/10/09/how-does-the-us-produce-electricity/
So, we need a future that is different. Based on the statement that 60% of energy consumption is baseload, we should aim for for a fossil free future that looks something like this:
coal 0%
nuclear 30%
petroleum 0%
hydro 5%
renewable 65%
gas backup (normally not used, but available): 20%
This will require an intermediate stage where gas takes on a larger role as we get off of coal and ramp up renewables and supporting technologies.
Moderator Response: Fixed image tag. -
Bob Guercio at 05:00 AM on 5 December 2010Stratospheric Cooling and Tropospheric Warming
Folks, I corresponded via email with a distinguished professor at Rutgers and this is that correspondence. Dear Bob, You correctly wrote up what Gavin told you, but he is wrong. The stratosphere cools because its emissivity goes up with more CO2, and it still absorbs the same amount of energy being emitted from below. It is a balance of energy. You cannot just look at one term. Designing a graph with not enough room to do it correctly is not a good reason in my opinion to do it wrong. Alan Alan Robock, Professor II (Distinguished Professor) Editor, Reviews of Geophysics Director, Meteorology Undergraduate Program Department of Environmental Sciences Phone: +1-732-932-9800 x6222 Rutgers University Fax: +1-732-932-8644 14 College Farm Road E-mail: robock@envsci.rutgers.edu New Brunswick, NJ 08901-8551 USA http://envsci.rutgers.edu/~robock On 12/2/2010 10:22 AM, Robert Guercio wrote: > Dear Alan, > > I'm sure you're correct; however, here is the email correspondence > that I had with Gavin. > > The ordinate should be (watts/meter square wavenumber) and I had > trouble making it all fit. I was actually working pixel by pixel and > I guess I was a bit lazy but that is easily corrected. > > The solar insolation that I used was very fictitious as everything > about my model is. I just kept on playing with different numbers > until the fictional atmosphere that I came up with made for "good" > graphs. > > Bob > > > > ----- Original Message ----- From: "RealClimate" >
Prev 2060 2061 2062 2063 2064 2065 2066 2067 2068 2069 2070 2071 2072 2073 2074 2075 Next


