


 Arguments


Recent Comments
Prev 2083 2084 2085 2086 2087 2088 2089 2090 2091 2092 2093 2094 2095 2096 2097 2098 Next
Comments 104501 to 104550:
-
Ken Lambert at 00:45 AM on 26 November 2010The question that skeptics don't want to ask about 'Climategate'
The Skeptical Chymist #154 Dr Trenberth expressed private doubts about the observation system and 'lack of warming' in the Climategate emails. He does touch on the central issue of 'missing heat' on pp25 of his Aug09 paper as follows: "Possibly the heat is being sequestered in the deep ocean below the 900mm depth used for the Argo analyses...........Or the warming is not really present? In this case the blame would point to the atmosphere and cloud changes, and it should be confirmed by CERES and MODIS measurements. However, preliminary estimates for 2006 thru 2008 suggest that net radiation heating increased, which if true exacerbates the imbalance identified here" The fact is that the 'imbalance identified' (0.9W/sq.m) is based on Hansen's 2005 models. Dr Trenberth goes on: "Accordingly another much needed component is the TOA radiation, but CERES data exist only through 2005 and are not yet long or reliable enough to bear on the question" While drawing a picture of an inadequate observation system, and expressing private doubts - he has defended the 'party line' on AGW - a line dependent on Mr Hansen's models. In short he has publicly used the 'its there but we can't measure it' argument. That does not detract from the technical issues he has raised and legitimate discussion of the probability that "the warming is not really present?" (at least for the last 10 years or so) -
Ken Lambert at 00:05 AM on 26 November 2010Climategate: Hiding the Decline?
kdkd #89 "Hide" in this instance is a shorthand for "producing a graph that is straightforward for the reader to view and interpret". I assume you are joking with this preposterous explanation. The tree ring issue is not important enough for me to drill down into the proxies and study their methodologies. Whether the MWP was warmer or cooler than the present is not as critical as monitoring OHC, SLR and trying to work out WV-CO2 feedback interactions and the magnitude of TOA imbalances. As far as CRU 'losing' the raw data - the advantage of being 50+ is that you can remember (just) the state of computer technologies going back 30 years. Twenty years ago you could get 1.44MB onto a 3.5" floppy. A big HDD was 340MB. 250MB on a Travan tape drive. 250MB is a lot of data in a simple format of that era. You could store a helluva lot of numbers in simple text files on tapes or even floppies. Lack of storage space seems like a convenient excuse which might impress the kiddies used to GB not MB. -
h-j-m at 23:47 PM on 25 November 20102nd law of thermodynamics contradicts greenhouse theory
Phil, I am referring to your posts #98 and #110. In your post #110 you state: "The part of the body under the clothes is emitting just as much heat as the exposed areas" and ask me to comment on this. Unfortunately you fail to provide any evidence to back that assumption. To explain something on the base of pure assumptions is called speculation in contrast to science where explanations are based on facts. -
Phil at 22:51 PM on 25 November 20102nd law of thermodynamics contradicts greenhouse theory
h-j-m @112 If you refer to my post @98 I suggested you explain the temperature distribution, I did not suggest that you describe it. If you do not wish to try, then thats up to you, but doing so should help you with the errors you are making in your comments. -
mspelto at 22:48 PM on 25 November 2010Twice as much Canada, same warming climate
The warming is confirmed by glaciers all across Canada it is not just some Bugaboo's. Somebody needs to be at the Helm who understands the implications or there will be few glaciers to steer around. -
Phil at 22:19 PM on 25 November 20102nd law of thermodynamics contradicts greenhouse theory
damorbel @108 You need to understand the difference between GHGs warms the surface and GHGs cause a warming of the surface These statments are different. My analogy with clothes may help you. Clothes do not warm your body, but they do cause your body to warm. -
h-j-m at 22:15 PM on 25 November 20102nd law of thermodynamics contradicts greenhouse theory
Phil, I just answered to your question which was about what a picture showed. The picture itself can only show an image of the radiation that arrived at the camera. Sorry, I thought that to be obvious. To deduce from a picture what it does not show is pure speculation. I try to avoid entering that realm. -
damorbel at 22:12 PM on 25 November 20102nd law of thermodynamics contradicts greenhouse theory
Re #109 Riccardo, you do not respond about the effect on the Earth's average temperature of removing all the GHGs from the atmosphere, will it go up or down? -
Phil at 21:26 PM on 25 November 20102nd law of thermodynamics contradicts greenhouse theory
h-j-m @101 So areas of the human body that are surrounded by clothes and hair emit less heat than those exposed ? Is that what you're saying ? I'm affraid thats not true. The part of the body under the clothes is emitting just as much heat as the exposed areas (the face, for example). But the clothes are clearly emitting less heat. Whats happened to the rest ? -
Riccardo at 21:24 PM on 25 November 20102nd law of thermodynamics contradicts greenhouse theory
darmobel I meant exactly that. It should not come as surprise, often physics and common language share words with slightly different meaning. GHGs cause a change in the balance of the energy fluxes, but do not directly heat the surface. (Note the difference between energy and heat). It would be more correct to say that the greenhouse effect impedes cooling. -
damorbel at 21:04 PM on 25 November 20102nd law of thermodynamics contradicts greenhouse theory
Re #107 Riccardo you write:- "I understand its use in common language, but it's not to be taken litterally." I do hope you don't mean this. Either the GHGs cause a warming of the surface or they don't. I have yet to read anything on the GH effect that doesn't posit an actual (literal?) warming of the surface. Since they are found in the atmosphere CO2 and H2O in the atmosphere actually are big players in radiating heat from Earth, you can see how much by looking at IR images of Earth here But the Earth wouldn't bake if there weren't any GHGs in the atmosphere. The average temperature would not be different, only the distribution of temperature would change, given the lack of heat transport from equator to poles by oceans and atmosphere. -
Riccardo at 19:57 PM on 25 November 20102nd law of thermodynamics contradicts greenhouse theory
We often hear people say that GHG warms the surface. I understand its use in common language, but it's not to be taken litterally. Indeed they don't, they only reduce the outgoing flux. It's the unbalanced flux from the sun that makes the surface warmer. -
damorbel at 19:37 PM on 25 November 20102nd law of thermodynamics contradicts greenhouse theory
Re #98 muoncounter you wrote:- "However, we know that both objects radiate, albeit at different wavelengths. Some of the cooler object's radiation is absorbed by the warmer; however, more total energy is transferred from warmer to colder." Which is fair enough, it is what your MIT link explains. And then for some bizarre reason you appear to make an exception for GHE radiative transfer :- "The 2nd Law is satisfied AND the greenhouse effect still works." (my emphasis) But the GHE requires that GH gases increase the temperature of the surface that is already hotter than the upper troposphere. (The troposphere can only get warmer than the surface in the exceptional condition of temperature inversion.) To get the surface temperature to increase the GH gases would have to cause, as you put it, 'a net transfer of total energy' from the troposphere to the surface. You also cite this post:- #83 CBD Your belief that this means energy can ONLY flow from 'hot' to 'cold' is simply nonsense, and rejected as such by all but the outermost looney fringe of modern physics. with favour. Surely you notice this post is in complete conflict with your MIT link? -
damorbel at 18:26 PM on 25 November 20102nd law of thermodynamics contradicts greenhouse theory
Re #104 muoncounter you wrote:- "Anyone who still doubts that CO2 absorbs infrared radiation should see this demo..." True, I don't know anybody who thinks CO2 doesn't absorb IR radiation. But there is a large number of people who believe they exist; rather like bad fairies, somewhere out there, trying to prove there is no greenhouse effect. I also know a lot of people who doubt CO2 doesn't emit infrared in exact proportion to the amount it absorbs... Now let us all think hard where these really strange people are to be found! -
apeescape at 17:12 PM on 25 November 2010Climategate: Keeping Skeptics Out of the IPCC?
Eric, although I think you're making too much out of one comment from one author attaching it to one graph of the IPPC report, I think the paleoclimate section would be greatly improved with rigorous model intercomparisons and model averaging of the paleoclimate. This exercise is not trivial (not just in comparing the data, but the statistical methods, proxy types, spatial locations, heterogeneity in the time series, etc.; just a nasty missing data problem), and AFAIK, not even done in the literature. I thought Figure 6.10(c) provides a nice coherent picture of the heterogeneity (or homogeneity) in the model reconstructions. The overlap values are something that can be used for future reports. The 10% number was chosen because there are 10 series, and the choice of the width of the SE is always arbitrary (but necessary) to an extent. The thing about the IPCC is, it's just a summary of the current lit. So doing stuff that's not even in the literature is I think overextending the purpose of IPCC. Or maybe the IPCC reports should include them anyways.. that's the authors' to decide. But once the analysis is out there, it will/should be discussed in the IPCC report. The GCM guys are at it already, and I'm sure the paleoclimate folks will follow. Heck, they say this in the conclusions of the paleoclimate section: "Differing amplitudes and variability observed in available millennial-length NH temperature reconstructions, and the extent to which these differences relate to choice of proxy data and statistical calibration methods, need to be reconciled." -
Phila at 16:31 PM on 25 November 2010Climategate: Keeping Skeptics Out of the IPCC?
Eric, Phila, yes while "factual" is neutral, my charge of "politically motivated" is not neutral. Actually, the claim that it's factual isn't neutral either. It's a positive opinion, and it's increasingly contradicted by straightforward evidence that you clearly have the ability, if not the will, to read and understand. You're free to believe whatever you want. But please don't pretend you're being neutral while you're taking a position of advocacy. And please don't request neutrality from us while making scattershot accusations of a "politically motivated" attack on Wegmen. -
actually thoughtful at 16:00 PM on 25 November 2010Climategate: Keeping Skeptics Out of the IPCC?
#2 fydijkstra - the better analogy is this: You get a chest x-ray and it shows a fuzzy mass . One doctor says it is an artifact of the equipment, one says it is lung cancer. You now have a fact with two different interpretations. The interpretation you choose has serious repercussions for how you live your life, and how long that life is. You get a 2nd opinion (all the other scientists who are telling us AGW is real and needs to be dealt with). You wonder if their process is valid - you go to yet other Doctors (in different fields) to review the process (the 6 reviews that showed Mann et. al. were simply doing good science). So you now have 2 opinions that tell you the exact same thing and a team of trusted Doctors in other fields telling you the process is robust. Now you can talk about skeptics and pro-cancerists (aka warmists). The skeptics choose to believe there is no cancer - it could be a bad x-ray (even though you have now had 3 different x-rays, from 3 different machines, and an MRI to boot - all showing the identical lump (well, actually, the lump has grown in the time you have been studying it)). And, your body is producing the exact same chemicals it would IF you had cancer. And you have the pro-cancerists. These crazy coots believe you actually have cancer! It must be politically motivated. Or they just want your money. Or something. So - it is your life. Do you "believe" the skeptics or the pro-cancerists? That is a much better analogy then some "gee-the-truth-is-in-the-middle" pablum. There are real, verified facts as the basis of AGW claims. And the more you look, the more clear their conclusions become. -
gallopingcamel at 15:58 PM on 25 November 2010Twice as much Canada, same warming climate
Daniel Bailey (#52), The Christidis, N., Donaldson, G.C. and Stott, P.A. 2010 paper says: "The decrease in CRM [Cold Related Mortality] far outweighs the moderate increase in HRM [Heat Related Mortality] after 1976." This is what CO2Science is saying and it is contrary to the IPCC position. The quote you cited as a refutation relates to causation. Is the observed effect (CRM >> HRM) a result of temperature alone or is adaptation an important factor?Moderator Response: [Daniel Bailey] Read the Christidis paper for that answer. -
Philippe Chantreau at 15:56 PM on 25 November 2010Climategate: Keeping Skeptics Out of the IPCC?
I wonder how Wegman would respond to a barrage of FOIA requests akin to that used against UEA... -
Daniel Bailey at 15:32 PM on 25 November 2010It's Pacific Decadal Oscillation
It might be instructive to read Atmoz' take on PDO: On the Relationship between the Pacific Decadal Oscillation (PDO) and the Global Average Mean Temperature. [Edit: After much searching, I finally was able to resurrect a cached copy of this post on PDO by Tamino: Exclamation Points !!! as well as this one: PDO: the Pacific Decadal Oscillation. End edit] The Yooper -
muoncounter at 15:30 PM on 25 November 2010Twice as much Canada, same warming climate
52: "CO2Science should change its name" The principals behind CO2Science have a rap sheet at sourcewatch, including a name on the good ol' Oregon Petition. At Arizona State, they did some early research into urban CO2 domes -- Phoenix had 200ppm more than Mauna Loa back in 2000 -- and they maintain a nice collection of urban CO2 dome papers. See the human fingerprints thread for some examples. -
gallopingcamel at 15:26 PM on 25 November 2010Twice as much Canada, same warming climate
Daniel Bailey (#52), You said, "PS: My understanding is that we're in an interglacial of an ongoing ice age. Kinda like remission from cancer (with CO2 being the "cure")." Are you saying that changing CO2 concentrations caused the glaciers to recede?Moderator Response: [Daniel Bailey] My comment was half-based in fact (technically we are still in an ice age; see here) and half-throwoff-humor. However, mankind does have it within its power to keep the return of the glaciated portion of the ice ages at bay by (in the absence of changes in other forcings) keeping atmospheric CO2 levels elevated. And no, I'm not saying that changing CO2 concentrations caused the glaciers to recede; that one was you. -
Daniel Bailey at 15:07 PM on 25 November 2010Twice as much Canada, same warming climate
Re: gallopingcamel (51) Thanks for the link to CO2Science's take on Christidis, N., Donaldson, G.C. and Stott, P.A. 2010. This is CO2Science's position on the paper:"Warming is highly beneficial to human health, even without any overt adaptation to it. And when adaptations are made, warming is incredibly beneficial in terms of lengthening human life span."
Cross-referencing back to Christidis, N., Donaldson, G.C. and Stott, P.A. 2010, this is what they have to say:"The need for a formal statistical tool when one attempts to make attribution statements that link impacts of climate change to possible causes is clear. A less stringent approach could be very misleading. For example, it would be easy to compare the recent decrease in cold-related mortality with the increase in temperature and make the seemingly logical assumption that fewer people have died because of milder winters. Our work, however, shows that this is not the case.
Underlining and bolding added. I think it's quite clear that we have a "skeptical" spin on an attribution study that is at odds with its conclusions from those of the authors of the study. Based on CO2Science's miss-take of the attribution study in question (which doesn't conclude what CO2Science says it does, according to the study itself), CO2Science then states, based on one study, that:"Clearly, the IPCC's "very-high-confidence" conclusion is woefully wrong.
The conclusion I draw is clear: CO2Science should change its name to CO2CrapScience. PS: My understanding is that we're in an interglacial of an ongoing ice age. Kinda like remission from cancer (with CO2 being the "cure"). The Yooper -
kdkd at 14:36 PM on 25 November 2010It's Pacific Decadal Oscillation
WDWK #21 I've done this type of regression analysis on a range of variables (solar variation, volcanic activity, ENSO and CO2 from memory. I found the only statisticaly significant predictors were CO2 and solar variation for annual mean temperature data. The effect of ENSO was miserably small, even in the context that it was not statistically significant, indicating that it's involved in the redistribution of heat, not a sink/store phenomenon. In the early 20th century, solar accounted for the majority of variance, and in the late 20th century, CO2 did. There were also some interesting non-linearities in the system indicating poorer predictive power (underestimating anomaly) with increasing CO2 concentration. Happy. Feel free to replicate it. The data and some of the R code I used for analysis is here. Disclaimer: I used the methods I'm used to as a social scientist rather than more 'correct' (or convention bound to your taste) methods that an earth scientist would use, so my results, while in good agreement with the peer reviewed literature, are only really worthwhile as an impressionistic analysis. However, given that limitation, they are in good agreement with the published literature. -
kdkd at 14:27 PM on 25 November 2010Climategate: Hiding the Decline?
KL #88 "So it is fine going back to say AD1560, or AD1060 or however old these trees are? And how do we know that?" Good agreement with ice core data and other proxies. More recently (pre-1960) you can show that the thermometer record and the tree ring proxies are in good agreement, but after that there's a decline in reliability of the proxies. So hiding the decline refers to this. "Hide" in this instance is a shorthand for "producing a graph that is straightforward for the reader to view and interpret". I suspect that given that there is good independent validation with other records, reverse engineering the original raw data would be seen as an ineffective use of limited resources. If the CRU had realised that the data set was going to be so important, they would have curated is better in the early days (I hit that problem from time to time with my work too, although these days I have a very effective process). -
gallopingcamel at 14:22 PM on 25 November 2010Twice as much Canada, same warming climate
Daniel Bailey (#36), Thanks for the welcome! I have been too busy to blog lately even though my visit to NOAA was very informative with regard to what is going on at high latitudes in the northern hemisphere. Yes, I did read all the links on this thread but was not persuaded. The weighing of extreme cold vs. extreme heat depends on who is doing the weighing. Taking the big picture, by which I mean "Ice Age" vs. "Interglacial" there is nothing to debate. North America was a very inhospitable place during the last ice age owing to the extent of the Laurentide glacier. Looking at the present day things are not so clear cut as there are plenty of studies that support Ned's thesis. However, for a contrary point of view take a look at this: http://www.co2science.org/articles/V13/N46/B1.php -
Ken Lambert at 14:13 PM on 25 November 2010Climategate: Hiding the Decline?
Albatros #85 "Nothing nefarious is going on here; really there isn't. And the data were not "simply" discarded as you claim. As you and others have been told multiple times, several papers have been written on the "divergence problem" going back to 1998." Oh, OK so the divergence problem is something peculiar only to the 20th century and only after 1960?? So it is fine going back to say AD1560, or AD1060 or however old these trees are? And how do we know that? Furthermore - we all seem to agree that Jones 'lost' the original raw data - and we could reconstruct it by taking CRU's reconstruction and 'back-winding' it using Jones' documented correction methods in the published literature? Has anyone done that in order to verify what the raw data was, and whether it had been 'corrected' correctly?Moderator Response: The divergence from temperatures since the 1960s is seen in only some tree ring series, in particular those at high northern latitudes. However, both the diverging and non-diverging tree rings are in good agreement back to the Medieval Warm Period. – James -
WHATDOWEKNOW at 14:01 PM on 25 November 2010It's Pacific Decadal Oscillation
Warming only since 1970... You can't simply draw a straight regression line through any data that has a trend... you need to detrend it first! 1) First of all you need to de-trend the global temp since it has a has an annual cycle. 2) you then need to de-trend it based on the PDO and ENSO long term cycles (which are multiple cycles in it self and by it self) 3) after that you need to do a trend-reversal analsys to make sure that your data isn't experiencing different signs of slope for certain periods of time. 4) Finally, you can then do simple linerar regression through all the data with the same slopes (so if global temperatures have changes of sign-of-slope, then you can't run linear regression through the entire data set. That's just plain wrong, but done so frequently it's amazing. 5) Now please go and do that and please then come back and tell me how much of the increase in temp since ~1970 can be explained by any and each of the variables: PDO, ENSO, CO2 etc. ps: even the oceanic heat content has a cycle. Can you calculate it? All the data is freely available and all these statistics are relatively easy to perform for an expert. It will take some data transformation, blood, sweat and tears, but only by doing it yourself can you trust your own analysis. Please note that I've never said that there is no global warming/climate change (due to excess anthropogenic CO2 emissions). I am only conveying the importance of oceanic long term cycles on the little over a hundred year of direct observations. These cycles should not be dismissed and in fact can only help in explaining the observations. The better we understand our observations, the better we can act if necessary. Any of the trends in ENSO, PDO and global temperatures I've presented so far are solid and a fact! Still they don't say there is no human induced global warming, that's a deducted PERCEPTION. See the difference? -
kdkd at 13:50 PM on 25 November 2010It's Pacific Decadal Oscillation
WDWK #18 The PDO merely redistributes heat. It is not a heat input into the earth's atmosphere. It's action is complex and/or chaotic. With the state of our current knowledge of the PDO it's very difficult to say what it's behaviour will be as a consequence of climate change, but it does seem to help create temperature extremes (high and low), so is an important noise component in the system. When I looked at the statistical behaviour of the PDO compared to temperature anomaly, I could not draw any conclusions from the simple methodology I employed. -
NewYorkJ at 13:36 PM on 25 November 2010Climategate: Keeping Skeptics Out of the IPCC?
I'd like to see a post on the general CRU hack incident that simply states what should be obvious to anyone that takes a step back: if ANYONE had most of the emails that they wrote (presuming they use email regularly) over the past 10+ years stolen and placed in the hands of individuals badly wanting to embarass them, those individuals would almost surely find something. Aside from being able to easily take things out of context, forming a "greatest hits" to support a certain narrative, I doubt that many of us who use email regularly can honestly say we've never written anything via email that we at least moderately regret or believe could have been worded differently or more clearly. Eric (#30), "BTW, it appears that Wegman has been instructed to not comment" He had been. No longer I guess. http://www.usatoday.com/weather/climate/globalwarming/2010-11-21-climate-report-questioned_N.htm His email correspondence related to the Wegman Report have mysteriously disappeared at GMU. What happened to that transparency he claimed to advocate? -
JMurphy at 12:47 PM on 25 November 2010It's Pacific Decadal Oscillation
WHATDOWEKNOW, are you looking at the Intermediate version of this thread ? Have you also read this thread ? Do you see the figure which shows "the contrast in trends between PDO and global temperature. Obviously the PDO as an oscillation between positive and negative values shows no long term trend. In contrast, temperature displays a long term warming trend." And, despite what you may believe, the warming is continuing. -
muoncounter at 12:35 PM on 25 November 20102nd law of thermodynamics contradicts greenhouse theory
Anyone who still doubts that CO2 absorbs infrared radiation should see this demo. A picture ... worth a thousand words. A video ... must be a thousand pictures! -
h-j-m at 12:28 PM on 25 November 20102nd law of thermodynamics contradicts greenhouse theory
Tom Dayton, because the clothes constitute the isolation I mentioned! -
Eric (skeptic) at 12:20 PM on 25 November 2010Climategate: Keeping Skeptics Out of the IPCC?
Phila, yes while "factual" is neutral, my charge of "politically motivated" is not neutral. -
Daniel Bailey at 12:19 PM on 25 November 2010Twice as much Canada, same warming climate
Re: adrian smits (43) Since Albatross and JMurphy have ably dealt with the majority of your comment, let me then say this: it is a matter of historical fact that I remember the specific part of the 70's that was so horribly cold that you refer to. The part called winter. ;) OK, enough of the fun stuff. Serious time. Do you have anything you'd wish to discuss on the topic of this thread? You do? Good! Tell us, what is your concern and what led you to think other than what the post shows? What was that source? If your concern was not in line with this thread, but about some other area of climate science, please use the search function in the upper left of every page to search for a more appropriate thread to submit your concern. Thank you for flying Skeptical Science Airlines, where we live to help educate the public on climate science related matters. Please make sure your tray tables are in the upright and locked position before deplaning. Have a great day! The Yooper -
Tom Dayton at 12:15 PM on 25 November 20102nd law of thermodynamics contradicts greenhouse theory
h-j-m, how do you explain the clothes staying cool when there is a warm body underneath them? -
h-j-m at 12:10 PM on 25 November 20102nd law of thermodynamics contradicts greenhouse theory
Phil, what is to explain there? The picture clearly shows a heat source (human body) emitting less heat where it is isolated. Unless you consider the earth to be it's own source of heat it has nothing to do with what needs discussed here. -
Daniel Bailey at 12:08 PM on 25 November 2010Twice as much Canada, same warming climate
Re: JMurphy (48) Thank you! I was having dinner with the family and then undertook the pre-Thanksgiving preparations for the big feast tomorrow. BTW, someone by the name adrian smits has been commenting on other sites (RC was one, IIRC). Same MO, starts off slow, gives the idea he is just misunderstanding things, then pulls you in. The "adjusted data/raw data" bit is the dead givaway. The Yooper -
WHATDOWEKNOW at 12:00 PM on 25 November 2010It's Pacific Decadal Oscillation
I am pretty sure you know what I mean, so don't take things word for word, I am talking about scientific objectivity; scientific discussions drive science forward, not (forced) agreement. Of course those matters you point out are absolute facts that cannot be argued with (though some still like to debate evolution...). Nevertheless if somebody PERCEIVES a circle as a square, and is absolutely convinced about that; you can bring any fact to the table proofing the circle is indeed a circle, but that person will only become more steadfast in the opinion that it's a square! That's called reducing dissonance: our human mind has a very hard time agreeing with the fact we actually might be wrong and will do almost anything to stay in consonance. And by the way, it's not about being wrong; it's about not always having to be right... Not until the person actually accepts he/she is not right; then her/his mind opens up for arguments. But only then. Hence, bringing different facts to the table need to be embraced 100% objectively, open-minded and scientifically. Not instantly dismissed or ridiculed due to opinion. Continuing, since Biblio and Murphy can only comment on my phrasing and word choice; I assume they agree ENSO and PDO affect to a large extend global atmospheric temperatures. Jeee, the oceans cover >2/3 of our planet... if anything is important to understand climate change it are the oceans. So the fact thus stays that the global atmosphere responds to PDO and ENSO cycles. More proof needed? Looking at the GISS data: PEAK monthly index temps since 1990 shows that January 2007 had the highest temperature index (0.89) since 1880, again I apologize for making the mistake of claiming 1998. Almost each and every peak coincides with pre-occuring el ninos. The GISS temperature peaks between 1990 and 2007 actually increase with 0.0159C/month; exactly the same increase for el nino peaks between 1973 and 1998 (0.0159C/month) when the PDO was in it's warm phase ('77-'98). The last el nino of 1.8 already shows the trend reversal and with a PDO having shifted from warm to cold in 1998, and the peak 2010 temp is (therefore) also lower than that in 07. Why isn't it much lower? Well, since the 09/10 el nino was 2nd to last in strength since NOI records began in 1950 and since PDO has shifted to cold. Simply because we've been in an el nino dominated phase for the last 40yrs: more net-release of heat than there was heat adsorption (la ninas). Given the latent response properties of the GLOBAL atmosphere this makes perfect sense. Now this theory will be challenged rather soon with the current developing la nina (still not official since 5 consecutive seasons haven't been below an SST of -0.5C yet). -
Tom Dayton at 11:30 AM on 25 November 20102nd law of thermodynamics contradicts greenhouse theory
damorbel, previously I was explaining to you merely that "net" means "difference." Now here is what the second law says for objects A and B, complementing the picture muoncounter provided. "Net" in this case means the difference in the flows between the two objects: Given: HeatFlow(from A to B) - HeatFlow(from B to A) = Net Heat Flow, If A initially was hotter than B, then Net Heat Flow has a positive sign. (A cools and B warms.) If B initially was hotter than A, then Net Heat Flow has a negative sign. (B cools and A warms.) If you want to nitpick about the word "heat," substitute "Energy." Example: A Flow To B = 100 units B Flow to A = 80 units Net Flow = 100-80 = 20 units from A to B. From A's perspective, A gets 80 units and emits 100 units, so A ends up with 80 - 100 = -20 units relative to its initial state. From B's perspective, B gets 100 units and emits 80 units, so B ends up with 100 - 80 = +20 units relative to its initial state. -
Phil at 10:12 AM on 25 November 20102nd law of thermodynamics contradicts greenhouse theory
h-j-m and damorbel. You might like to explain the temperature distribution illustrated here -
oamoe at 10:10 AM on 25 November 2010The human fingerprint in the daily cycle
KR, Thanks so much. So, is the thermal emission spectrum of planet earth characteristic of the surface temp or of some temperature in the troposphere? If so, approximately what temp does the emission spectrum correspond to. -
JMurphy at 09:44 AM on 25 November 2010Twice as much Canada, same warming climate
adrian smits wrote : "yooper I'm not talking about the adjusted data. Just the raw please.Then you will see the 70s where very cold and there was a lot of famine.Historical fact by the way." Just in case Daniel Bailey is busy, I believe you will find raw data here. Can you use it to prove your assertion about the "very cold" 70s ? Also, as Albatross mentions, WIKIPEDIA shows that the only large famine I can see in the 70s was in Bangladesh - ranked 21 out of 22. Could you provide links to the "historical fact" you mentioned ? Generally, will you actually reply or will you divert onto something else ? I wonder... -
Albatross at 09:35 AM on 25 November 2010Twice as much Canada, same warming climate
Adrian, Please direct us to the official data source which leads to believe that "Then you will see the 70s where very cold and there was a lot of famine." Please also provide sources to support your claim that "there was "a lot of famine" in the seventies. I found this list, and it doesn't support your claim. And agin I fail to see what any of this has to do with "Twice as much Canada, same warming climate" -
Marcus at 09:30 AM on 25 November 2010Twice as much Canada, same warming climate
Muoncounter is right, Adrian. The temperature anomolies are based off the average temperatures for 1969-1990 (which includes the 1970's, obviously). Most of the 1970's were no more than -1 degree C below this average, whereas its clear that the bulk of the 1900-1930 period was closer to -1 to -2 degrees C below this average. -
Marcus at 09:27 AM on 25 November 2010Twice as much Canada, same warming climate
There were also drought-related famines across the bulk of Africa during much of the 1980's & 1990's Adrian-so what's your point? Global Warming is expected to accelerate Hydrologic Cycles-which essentially means more severe droughts & more severe flooding-neither of which spells a bright future for expanding agriculture. I also wouldn't pin much hope on the unlocking of Northern Tundra to make up for significant losses of prime agricultural land closer to the equator. Most of the Tundra regions lack sufficient soil nutrients & also don't get enough sunlight to grow the crops needed to feed 6 billion people. This suggests that future famines will make anything from the 1970's-or the 1980's-look like a walk in the park! -
muoncounter at 09:25 AM on 25 November 2010Twice as much Canada, same warming climate
#43: "a lot of famine. Historical fact" Here is a database of sorts of global famines. Take your pick as to which decade was worse. As far as the 70s colder than the teens? Every climate data says not! -
JMurphy at 09:20 AM on 25 November 2010It's Pacific Decadal Oscillation
WHATDOWEKNOW wrote : "If everybody in the room agrees and all nod there heads; now that's when I, as a scientist, get scared, really scared." A room full of people agree with the theory of evolution and nod their heads when someone states that the theory is correct. WHATDOWEKNOW gets scared, really scared... -
muoncounter at 09:16 AM on 25 November 20102nd law of thermodynamics contradicts greenhouse theory
#97: "'seriously not understand the basic concept of net change?'" I just don't recognise any other." Perhaps that's the problem. Here is a summary of 2nd Law statements from a class at MIT. Note the figure below, which appears under the statement: No process is possible whose sole result is the transfer of heat from a cooler to a hotter body. The key word is sole, which appears in bold in the original for good reason.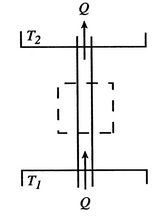 The caption states for T1 less than T2 this is not possible.
However, we know that both objects radiate, albeit at different wavelengths. Some of the cooler object's radiation is absorbed by the warmer; however, more total energy is transferred from warmer to colder. The 2nd Law is satisfied and the greenhouse effect still works.
As for the rest, you can talk QED if you like, but that will not help you answer any of CBD's excellent points.
The caption states for T1 less than T2 this is not possible.
However, we know that both objects radiate, albeit at different wavelengths. Some of the cooler object's radiation is absorbed by the warmer; however, more total energy is transferred from warmer to colder. The 2nd Law is satisfied and the greenhouse effect still works.
As for the rest, you can talk QED if you like, but that will not help you answer any of CBD's excellent points.
-
adrian smits at 09:10 AM on 25 November 2010Twice as much Canada, same warming climate
yooper I'm not talking about the adjusted data. Just the raw please.Then you will see the 70s where very cold and there was a lot of famine.Historical fact by the way.
Prev 2083 2084 2085 2086 2087 2088 2089 2090 2091 2092 2093 2094 2095 2096 2097 2098 Next


