


 Arguments


Recent Comments
Prev 2093 2094 2095 2096 2097 2098 2099 2100 2101 2102 2103 2104 2105 2106 2107 2108 Next
Comments 105001 to 105050:
-
adrian smits at 06:47 AM on 21 November 2010The Fake Scandal of Climategate
even if we have to redefine what the peer-review literature is! Don't you get it? Even if the (peer reviewed papers) were crap which most are by the way.That doesn't mean you change rules of the game so you can keep an extra man or 2 or three or more on the field to maintain your unfair advantage.It's like asking the other team to play a man down the whole game! -
cjshaker at 06:37 AM on 21 November 2010The question that skeptics don't want to ask about 'Climategate'
I would rather be pointed to a science based argument that refutes Professor Shaviv's claims. Would the rejection letters be considered private communications? Thank you for the education about the peer reviewed publication process. I'll note that there are well known Astrophysicists who also doubt the AGW premise, including Freeman Dyson. I don't believe the claims that he is senile. Read some of his recent interviews, and he seems quite lucid to me. Chris Shaker -
batsvensson at 06:26 AM on 21 November 2010The Fake Scandal of Climategate
@tobyjoyce Just to get one thing straight first: are you accusing me for being a creationist? If you do, then do not bother to read the reminder of this answer - just as I will not bother to read anything written by you hereafter. - I don't understand your what your objection is or why you think it is controversial what I claim. I am perfectly aware there is many scientific fields that fall under the category of being observational sciences. However the border line between being experimental and observational is not a black and white one but a gray scale. Other fields are named observational not because it is not possible to conduct experiment but because it would be clearly unethically to perform experiment. Psychology is good an examples as any of this. There preferred method is of course experimental if available, if not the observational method will do. In the case of climate science we do not have a parallel universe, not even an duplicated Earth, we can compare with therefore out of necessary reason climate science is an observational science. To me this is pretty obvious. However my purpose was not to catalog all and every science filed, as observational or experimental but to point at the fact there is exists a division and that climate science is observational. Because if this there are certain assertion that can not be hold as true in the same manner as in an experimental fields. -
SoundOff at 06:19 AM on 21 November 2010Economic Impacts of Carbon Pricing
Elasticity of demand describes how demand responds to price changes with all else being equal – e.g. alternatives don’t change in price. The goal of additional carbon pricing is not just to discourage fossil fuel usage but to raise capital towards development and use of low-carbon emitting technologies, advances that would change the alternatives available and/or their prices. This greatly complicates our assumptions about elasticity rates over longer time periods. -
cjshaker at 06:18 AM on 21 November 2010We're heading into an ice age
How does this warming phase look different from the previous seven warming phases during the past 800,000 years? So far, I have not been able to find a graph of the derivative of the glacial cycle temperature record. Would that not be interesting to show the rate of change during the warming phases, and compare this one to previous ones? Chris Shaker -
caerbannog at 05:41 AM on 21 November 2010The Fake Scandal of Climategate
On 8 July 2004 Phil Jones e-mailed to Michael Mann about some papers by Michaels and McKitrick and by De Laat and Maurellis, both discussing the influence of urbanisation on temperature. About half of the observed warming could be explained from the warming effect of urban agglomerations. Jones and Mann were not amused, and Jones wrote: ‘I can't see either of these papers being in the next IPCC report. Kevin and I will keep them out somehow - even if we have to redefine what the peer-review literature is! Cheers, Phil’ The real scandal here isn't that Jones and Co. tried to keep those papers out of the IPCC report; it's that those papers even got published in the first place. The first paper (MM-2004) contained a very fundamental (freshman-level) error -- a degrees/radians mixup in its calculations that rendered its conclusions invalid. A paper with a blunder like that simply should *not* have been included in the IPCC report. The second paper contained more subtle problems rendering its conclusions invalid. Scientists who try to keep papers with fundamental errors from being published aren't engaging in censorship or suppression of competing views; they are simply *doing their jobs*. -
Daniel Bailey at 05:19 AM on 21 November 2010The question that skeptics don't want to ask about 'Climategate'
Re: Marco (125) Another insightful comment, thanks! BTW, check your email. The Yooper -
Marco at 05:01 AM on 21 November 2010The question that skeptics don't want to ask about 'Climategate'
Chris Shaker, if Nir Shaviv is surprised that an editor rejects a paper without forwarding Shaviv's response to the reviewers, Nir Shaviv does not understand the publication process. The Editor has the final word on what gets published, and what not. Plain and simple. In fact, I know several journals that due to page restrictions have to reject up to 75% of all submissions. This poor understanding by Shaviv puts significant doubt on his other claims. Sounds to me to be the Galileo-syndrome. -
tobyjoyce at 04:20 AM on 21 November 2010The Fake Scandal of Climategate
@batsvensson "It is a fact that climate science is not a experimental science but at most an observational science - compare with say astrophysics. The problem with observational science is that they are limited to only tell "just so"-stories. " Brilliant, Bat, you have just ruled out most of biology, epidemiology, geology, palaeontology and oceanography as being mostly "just-so" stories. That accusation had hitherto been made solely by creationists against evolution. These sciences depend on experimentally demonstrated physical and chemical models, together with field observations verified by statistical analysis. I think "not even wrong" adequately describes your assertion. -
batsvensson at 04:10 AM on 21 November 2010The Fake Scandal of Climategate
@The Ville 1. Granted with a one reservation - never forget scienetist is also humans, and fraud has been committed in science. However this does not imply I suggest to say any fraud has been committed in climaet science. To my knowledge no such fraud has been committed. 2. Not sure about that really. Science is use a bat in the debate. -
Riccardo at 04:08 AM on 21 November 2010The question that skeptics don't want to ask about 'Climategate'
Camburn "Statistically, there has been no warming during the past 10 years" you're not correct, not even statistically. The correct claim would eventually be "There's has been a non statistically significant warming". It's not the same. -
ligne at 04:08 AM on 21 November 2010The question that skeptics don't want to ask about 'Climategate'
fydijkstra: "A hacker would have an enormous job to find all these relevant texts, and he must have hacked many times without being noticed. For an internal whistleblower, this is all much easier. And indeed (RSVP, 45) a whistleblower could have known where he had to look." nah, not really. most computer systems are arranged in fairly standard ways. there are only a handful of places that are likely to contain emails, and standard tools such as grep make sorting through even large amounts of data a trivial task. so there really isn't any need to have inside knowledge. from my experience, most research groups' systems administration is likely performed by a member of the group, on top of their other duties. they've almost certainly not received any formal training. the end result is almost always a system that's more than secure enough for most purposes, but which is no match for a determined, targeted attack. -
batsvensson at 03:59 AM on 21 November 2010Climategate a year later
Okay, you win. -
batsvensson at 03:56 AM on 21 November 2010Climategate a year later
Btw, Daniel Bailey funny picture, but I am from the north hemisphere you see. -
Daniel Bailey at 03:54 AM on 21 November 2010Climategate a year later
Re: batsvensson (49) Do tell. Consider me from Missouri and "show me". 'Cause I'm a bit thick I guess and connecting the dots you're drawing isn't working for me. The Yooper -
Argus at 03:43 AM on 21 November 2010The Fake Scandal of Climategate
Daniel Bailey (#13), I certainly admit to making a sloppy quote about 'three quarters of climate science papers'. But even if, as you point out, "the author sampled 1 issue of 1 Climate Science journal", I am guessing that he would get about the same result from another issue, or from another journal. That is my hypothesis. Scientists who rely on statistical methods to present their results, should be very well versed in how to use statistics. If they are not, it is not good science either. Robert Way (#15), Thanks for the link! I quote a passage from it: "For one thing, I don’t believe climate science should be singled out for this property. I suggest that errors of statistical interpretation are just as common in most scientific fields as they are in climate science, and that in this regard climate science is typical of science in general." I totally agree. All scientists should be equally aware of how they use statistics. -
batsvensson at 03:42 AM on 21 November 2010Climategate a year later
@Daniel Bailey Do I need to explain the obvious? -
The Skeptical Chymist at 03:38 AM on 21 November 2010The question that skeptics don't want to ask about 'Climategate'
Ken @114 Since you obviously value the knowledge and opinion of Dr Trenberth I find it somewhat curious that you don't seem to have taken the time to learn what he is talking about. As discussed on this very site (and in his linked paper) Dr Trenberth's concern is that while satellite measurements show the earth is continuously accumulating heat, our ability to measure that heat and track where is it going is limited. The temperature record doesn't rise monotonously every year, even though the earth as a whole now contains more heat, it is this inability to "account for the lack of warming" that Trenberth refers to. So nothing to do with climate models either. And as to Trenberths current opinion, well in the same paper he says "global warming is unequivocally happening" so I think it likely he would agree with what John wrote. Given the esteem in which you obviously hold Dr Trenberth I am hopeful you will read his paper and the one linked by Daniel (@119) and desist from putting forth arguments that misrepresent his views. -
Camburn at 03:18 AM on 21 November 2010The question that skeptics don't want to ask about 'Climategate'
muoncounter: You brought it up...and statistically speaking, I am correct. -
Riccardo at 03:10 AM on 21 November 2010The human fingerprint in the daily cycle
Disentangle the different contributions to the DTR change is not easy. As for CO2, the reason lies in the non linearity of the temperature-forcing relation. If you apply the forcing F starting at temperature To, the temperature change depends on To. Though, it's true that this is not the whole story, effects not directly related to CO2 play a role. -
batsvensson at 03:07 AM on 21 November 2010The Fake Scandal of Climategate
@Marcus "the reality is that the underlying science behind climate change has always been sound-& remains sound-a fact" So there is no conspiracy. "in Perth its the worst its ever been-& even if it does, that doesn't automatically rule out the possibility that future rises in global temperature won't be catastrophic." Neither does it rule out the possibility it wont be catastrophic either. "The reality remains that the Fossil Fuel Industry-using its connections" But there are some conspiracies. "it still amounts to CRIMINAL ACTIVITY-something I've yet to see the AGW proponents to be guilty of." So we got Bad Guys and Good Guys. "in spite of the claims ... no contrarian has been able to provide *evidence* " So, when Bad Guys claims there is a conspiracy there isn't one, but when Good Guys claims there is conspiracy there is one. "Seriously Ken et al, the moment you have something amounting to *evidence* that the predictions about AGW are false-rather than ever more fanciful ad hominem attacks-then maybe you'll gain some credibility." I would rather call it projections than predictions. But it doesn't matter because a prediction or projection or whatever label we like to use, can not be true (nor false) in climate science. It is at it best in state of being unknown until confirmed by an observation and as far as I know someone has yet to came back from say year 2100 and reported X meter elevated sea levels with predicted catastrophic events in case we do nothing. However, even if such observation would be the case, which may or may not be the case, at year 2100 we will still at that future time point have no means to tell if the made prediction was correct (i.e. true) due to an accurate model or a temporal relations since we have no parallel universe to compare the result with. It is a fact that climate science is not a experimental science but at most an observational science - compare with say astrophysics. The problem with observational science is that they are limited to only tell "just so"-stories. So whatever the case turns out to be in the predictions; if we do everything in our power, or do nothing a pro-AGW'ist can always find an add-hoc answer that will explain just exactly what happen no matter what the end result is, i.e. we are limited to fit data to a theory that best explains the observations. Any science theory must work like this, the difference for observational science is that the laboratory happens to be the subject of observation itself. Hence things can not be falsified until observed as such - if ever observed. This is one of the reason why hard core experimentalist are critical to observational science as their proposition in advanced can not be tested in a controlled test environment. As of no big surprise some valid scientific critics against climate science are made from the most hard core of all science we have, namely physics. At last, to round this up, if you because of what you claim think you are more credible than the bad guys just because you you claim your self to be with the good guys, then consider that the arguments you makes, makes you in my eyes no better then the one you condemn as being the bad guys. -
tobyjoyce at 02:58 AM on 21 November 2010The Fake Scandal of Climategate
In one way, I agree with Ken Lambert. Climate scientists and climate blogs have probably paid more attention to Climategate than it merits. Most of what has happened since is unrelated. "Happened afterwards, therefore because of" (post hoc ergo propter hoc) is an old, old fallacy that has given rise to a heap of superstitions. Climategate's residual significance is that a lot of US states are suing the Federal government on the grounds that the data for global warming is faked. It is the old "hockey stick is broken" argument, and we know that leads nowhere. With so many investigations completed, it is time to move on. Responses on Climategate should be only as appropriate when it arises. -
dana1981 at 02:55 AM on 21 November 2010The Fake Scandal of Climategate
Nice article James, very thorough and excellent points. I particularly agree about the double standard when it comes to climate change. It's an interesting question to ask how much press the Wegman Report investigations would be getting if it was "pro AGW". No doubt a whole lot more than it's presently receiving. "Skeptics" seem immune to scandals somehow, while virtually everything climate scientists do becomes a media-driven scandal. -
muoncounter at 02:51 AM on 21 November 2010The question that skeptics don't want to ask about 'Climategate'
#118: "there has been no warming " See how that notion (yawn) went bust here. Switch to that thread for further comments if you like; but really, why start the same discussion again? -
Paul D at 02:47 AM on 21 November 2010The Fake Scandal of Climategate
batsvensson: "A second point I been thinking about when reading this article is why should scientist be granted immunity to dirty tricks/propaganda in a political debate?" 1. There are no dirty tricks on the scientists side. 2. What political debate? The science is not political. The solutions and policy are political. -
tobyjoyce at 02:45 AM on 21 November 2010The Fake Scandal of Climategate
Imagine that the Watergate burglars had actually installed their bugging equipment in Democratic Party HQ in 1972. Suppose they actually taped some compromising conversations before they were caught (e.g. a senior figure talking to a wealthy backer, another making unflattering statements about senior Republicans, maybe some discussing how to "spin" news stories in their favour). Imagine, that in the aftermath, most press coverage focuses on the conversations, which are sensationally inflated into a theory of a conspiracy to subvert the whole political process. The illegality of the break-in and the conspiracy behind it are virtually ignored. A shocking dereliction by the media? No Woodward and Bernstein? But case for case, it is what happened in the instance of so-called Climategate. -
Gestur at 02:44 AM on 21 November 2010Economic Impacts of Carbon Pricing
actually thoughtfull--Thanks very much for your thoughtful comments. Your response got me to do what I should have done in the first place and that’s to look at the CO2 emissions by economic sector and then think about how a carbon tax would actually work in the economy. The assumption that I used in my back-of-the-envelope exercise (I wouldn’t grace it by calling it a re-analysis)—that the CO2 reductions should be more or less proportional across all the economic sectors—was naïve at best, at very best. What I relatively quickly realized is that a tax of a specified amount on a ton of carbon would represent quite different amounts of the prices of various products due to the quite different amounts of carbon in the final products. Specifically, the initiation of a carbon-tax would entail a larger _percentage_ increase in the price of ten thousand tons of delivered coal than it would for the price of 100 gallons of gasoline at the station. Consequently, other things constant like elasticities of demand, the drop in CO2 emissions by product or sector will not be anywhere close to proportional. And by the first end-point of 2030, I think that this consideration likely explains by itself—given that the reductions in total CO2 emissions are modest enough—why the contribution of coal-generated electricity could be pretty out-sized, as you correctly note, and why the contribution of gasoline could be pretty small proportionately, as I puzzled over. That noted, when we move to the last end-point of 2050, things become more complicated. Looking at the CO2 emissions by economic sector, according to the EPA and in 2006, electricity accounted for 41% of CO2 emissions in the US, and eyeballing the bar graph, it looks like a good 80% of that is from coal. [Seems high to me based on where I live where it’s closer to 60%, but there are very large differences regionally across the US.] Given that the substitutes for coal in electric generation will be dominated by natural gas (although hopefully renewables will not be trivial), we will get some significant reductions in CO2 emissions from reduced use of coal but it won’t come close to being 41% x 80% , or ~ 21%. And currently (~2006), eyeballing again from the bar graphs, it looks like around 32% of CO2 emissions in the US are accounted for by transportation, and 2/3 of this, according to the EPA, is accounted for by cars and light trucks. So perhaps around 21% of CO2 emissions in the US are the result of cars and light trucks and hence the gasoline that drives them. So this tells me that by 2050 we would need to have a very substantially higher carbon tax in order to effect the reductions in CO2 emissions estimated, and that would imply some substantially higher prices of gasoline. Of course, we weren’t given those intermediate model outcomes for 2050 for the various bills. If I want to think about this some more, I need to dig into these models more deeply myself. I have to take exception to your comments about the impacts of $4/gallon gas on gasoline consumption, however. For much of the time that these gas prices were ramping up, I was downloading gasoline consumption data and miles driven from various federal websites and then calculating arc-elasticities of demand using these data over various lengths of time. Of course, these were relatively short-term measures of the sensitivity of gasoline consumption to price rises, but before the recession introduced a big income effect and clouded the picture substantially, I was really disheartened by how small these elasticities were. [This was a real pain for someone like me who won’t even drive a car anymore, I must say.] So I don’t really share your view that this period represented a tipping point, although I sure hope it comes soon. Finally, and thanking you again for getting me to think a lot more critically about this issue, it occurs to me that I just displayed what a true skeptic should do: someone who can’t quite accept some finding on initial assessment, and then through more critical analysis finds grounds for changing his initial views (or rock-solid support for them). -
muoncounter at 02:42 AM on 21 November 2010The Fake Scandal of Climategate
#8: "three quick fire threads have been run on Climatgate on this excellent blog in the last few days is an indication" Or it indicates that this so-called scandal took place a year ago? For some reason, we tend to remember events in annual cycles: The way in which people estimate when an event occurred and the accuracy of their estimates are of concern both to psychologists interested in the structure of event memory and to other researchers who, for a variety of reasons, rely on the accuracy of people's temporal estimates. -
Paul D at 02:39 AM on 21 November 2010The Fake Scandal of Climategate
Argus: "I really don't understand why the AGW lobby has to keep repeating that there never was a scandal, and that the scientists never did anything wrong. Who believes in all that white-washing anyway?" You answer your own question by stating something was white washed. -
Daniel Bailey at 02:35 AM on 21 November 2010The question that skeptics don't want to ask about 'Climategate'
Re: Ken Lambert (115) To echo Riccardo (118), by 'out of context' do you mean providing older quotes from Dr. Trenberth instead of his latest? If so, great example! Trenberth 2010:"This discrepancy suggests that further problems may be hidden within the ocean observations and their processing. It also highlights the need to do better, and the prospects for that. Experience in the atmosphere has long highlighted the desirability of working with ‘anomalies’ as departures from a well-established climatology. Moreover, methods of analysis and interpolation of gaps in space and time should take account of the warming climate, and care is needed not to bias results towards background values."
Emphasis added. The Yooper -
Camburn at 02:31 AM on 21 November 2010The question that skeptics don't want to ask about 'Climategate'
muoncounter@117: The degree of warming in your graph is not even close to the amount of warming that Mr. Trenbeth calculates should be here. That is the travesty that he is talking about. 2010 is not above average as far as temp. Statistically, there has been no warming during the past 10 years, and in fact 15 years. You can show trends without the error bars and try to fool some people. When one is talking on a site that seems to be somewhat technical, it is better to show everything. -
muoncounter at 02:22 AM on 21 November 2010The human fingerprint in the daily cycle
#14: "a simplified version of my argument:" I suspect that daytime R is much greater than nighttime R, as a hotter body radiates more energy. So D = S - Rd and N = -Rn; with Rd > Rn, the difference is D - N = S - Rd + Rn. Another component of the impact of GHGs and anthropogenic aerosols in this process is the DTR difference between weekdays (typically higher urban CO2, corresponding with urban traffic patterns) and weekends. From Forster and Solomon 2003: The “weekend effect,” which we define as the average DTR for Saturday through Monday minus the average DTR for Wednesday through Friday, can be as large as 0.5 K ... We conclude that the weekend effect is a real short time scale and large spatial scale geophysical phenomenon, which is necessarily human in origin. We thus provide strong evidence of an anthropogenic link to DTR, an important climate indicator." -
Daniel Bailey at 01:58 AM on 21 November 2010Climategate a year later
Re: batsvensson (46) And in your world, the "broader picture" is...? The Yooper -
robert way at 01:52 AM on 21 November 2010The Fake Scandal of Climategate
Re: Argus (10) "Only a week ago, on this site, we could read that significance tests are misused in three quarters of climate science papers." http://tamino.wordpress.com/2010/11/13/much-ado-about-something/ -
muoncounter at 01:50 AM on 21 November 2010The human fingerprint in the daily cycle
#13: "how much higher can carbon dioxide concentrations be around densely populated urban areas" Phoenix, due to its topography, is one of the worst CO2 domes I've found in the literature, as in Wang and Starzewski 2004: Recent measurements reveal that atmospheric carbon dioxide (CO2) concentrations in the urban core of Phoenix, Arizona, are often 200 ppmv above the surrounding areas. This increase is up to two orders of magnitude higher than comparable values in other cities. ... Measurements taken to date reveal that the CO2 levels are greatest during the winter morning periods when the atmosphere is most stable and Phoenix vehicular traffic is increased substantially by its many winter visitors. As far as the direct impact on temperature due to 'locally' increased CO2, that seems to be an open, and in my opinion, very interesting question. Balling et al 2001 concluded that the impact was small, as the "elevated levels of CO2 decline rapidly to the height of the morning inversion layer". How they measured this by airplane during the morning rush hour is not clear. On the other hand, Stott et al 2004 spoke in terms of probabilites: ... estimate the contribution of human-induced increases in atmospheric concentrations of greenhouse gases and other pollutants to the risk of the occurrence of unusually high mean summer temperatures throughout a large region of continental Europe. Using a threshold for mean summer temperature that was exceeded in 2003, but in no other year since the start of the instrumental record in 1851, we estimate it is very likely (confidence level >90%) that human influence has at least doubled the risk of a heatwave exceeding this threshold magnitude. -
Daniel Bailey at 01:47 AM on 21 November 2010The Fake Scandal of Climategate
Re; Karamanski (9) Here's a link to the Muir Russell report. I also commented on it here. In a nutshell, the Muir Russell Commission was indeed an independent investigation. I'll let you read it rather than influence your opinion in any way. The Yooper -
batsvensson at 01:42 AM on 21 November 2010Climategate a year later
@actually thoughtfull "As usual, the bad guys have better marketing than the good guys." This argument is known as playing the victims card. Used carefully, like here, it is very powerful but never less not an argument. -
Daniel Bailey at 01:41 AM on 21 November 2010The Fake Scandal of Climategate
Re: Argus (10)"Only a week ago, on this site, we could read that significance tests are misused in three quarters of climate science papers."
Argus, if you had taken the time to read the linked paper that the post you reference was based on, you'd have noted that the author sampled 1 issue of 1 Climate Science journal. Sample size of one. Pretty tiny. What Maarten Ambaum (the author of that paper) did not do was examine other publications in other disciplines to get a reference baseline for comparison purposes. I mean no disrespect to the author; a canvassing-the-field-type of investigation was not the intent of the paper. That would be like me reading your comment and extrapolating your words I quote above to mean that most of your comments take things out of context. One has to be careful with one's quotes, doesn't one? The Yooper -
Marcus at 01:34 AM on 21 November 2010The Fake Scandal of Climategate
As always, Ken, we can rely on you to post complete & total rubbish. The reality is that the underlying science behind climate change has always been sound-& remains sound-a fact that has irked the contrarians like yourself. Also, one good year of rain does *not* mean the drought is well & truly broken-indeed, in Perth its the worst its ever been-& even if it does, that doesn't automatically rule out the possibility that future rises in global temperature won't be catastrophic. The reality remains that the Fossil Fuel Industry-using its connections in Russia (probably Organized Crime)-hacked Web Sites & then distributed the e-mails (out of context) so as to coincide with the Copenhagen Conference. No matter how you try & spin that, Ken, it still amounts to CRIMINAL ACTIVITY-something I've yet to see the AGW proponents to be guilty of. Also, in spite of the claims that temperature data was fabricated (which would, if true, have been a real scandal) no contrarian has been able to provide *evidence* that the CRU data was false (hilariously, due to the smaller coverage of their weather stations, CRU show a *smaller* temperature gradient than the NOAA, RSS or GISS). Indeed, the worst that the e-mails reveal is that some scientists suffer from bouts of pettiness, anger & frustration-just like the rest of the Human Race. Seriously Ken et al, the moment you have something amounting to *evidence* that the predictions about AGW are false-rather than ever more fanciful ad hominem attacks-then maybe you'll gain some credibility. Until then, remember that even those from your own side *privately* don't believe their own propaganda. Now that should tell you something, shouldn't it? -
batsvensson at 01:34 AM on 21 November 2010Climategate a year later
This thread is hilarious, normally we would see at skepticalscience.com arguments that skeptics are cherry picking and do not see the broader picture. However in this case the situation has been reversed. *Gets some pop corns and beers and leans back in the chair...* -
Jeff T at 01:21 AM on 21 November 2010The human fingerprint in the daily cycle
Rob @11, thank you for the link to Dai et al. (1999). They find that changes in cloud cover cause the reduced DTR. Therefore, GHGs would be responsible for reduced DTR only if they change the clouds. That sequence of causation seems to be a negative feedback. muoncounter @12, I don't follow your logic. Here is a simplified version of my argument: During the day, the vertical heat flux is D = SolarInsolation(S) - NetLongWaveRadiation(R) At night, the flux is N = -R The difference in the fluxes is D - N = S - R -(-R) = S Suppose that GHGs reduce R to R'. Then we have D = S - R', N = -R' and D - N = S. The day/night difference doesn't change. If the difference in fluxes doesn't change, the temperature range shouldn't change. The argument that GHGs cause the observed reduction in DTR seems pretty weak. -
batsvensson at 01:15 AM on 21 November 2010The Fake Scandal of Climategate
@Riccardo #5 I think your comment sweeps under the carpet an issue that have concerned at least me for a very long time. John made this comment to a post of mine once: "Perhaps a more precise description would be that a common pattern in global warming skeptic arguments is to focus on narrow pieces of evidence while ignoring other evidence that contradicts their argument." And this is the issue the article discuss, but in my opinion this article is in guilt of this as well. It focus on a narrow set of non representative claims, claims which is indeed pure propaganda by some skeptics, however the article also suggest guilt buy association and as such these propaganda claims then gets attributed to the be opinions of the entire skeptic camp. In doing so, the OP becomes guilty of the very same issue the OP tries to address. In other words, the issue I try to raise is not about the exact numbers or figures or any particular facts but the fact that the claim I quoted is obvious nonsense. It is nonsense because it a sweeping statement with no specifics and as such it is an empty statement and means nothing. A second point I been thinking about when reading this article is why should scientist be granted immunity to dirty tricks/propaganda in a political debate? Is it because they speak under the name of science? If that is the case, why shall we not grant the same right to other spokesmen for other organization?Moderator Response: This is the first post in a series on Climategate. I will address more specific allegations in the coming days. - James -
Argus at 01:13 AM on 21 November 2010The Fake Scandal of Climategate
I really don't understand why the AGW lobby has to keep repeating that there never was a scandal, and that the scientists never did anything wrong. Who believes in all that white-washing anyway? Everybody knows that there was a bit of a scandal, and that the scientists did what they did, and wrote what they wrote. The fact that the scientific community, afterwards, is unable to find any errors within itself, is not convincing, just a bit boring. Climate scientists, who keep claiming that the Earth is heading towards a global disaster, have to be very careful with what they write and say. Only a week ago, on this site, we could read that significance tests are misused in three quarters of climate science papers. And what about the Himalayan glaciers? -
Karamanski at 01:11 AM on 21 November 2010The human fingerprint in the daily cycle
muoncounter, how much higher can carbon dioxide concentrations be around densely populated urban areas compared to the global CO2 concentration? How large of an impact can local variations in carbon dioxide concentrations have on nightime temperatures? -
Riccardo at 01:09 AM on 21 November 2010The question that skeptics don't want to ask about 'Climategate'
Ken Lambert, what's the context, in your opinion? -
Karamanski at 01:05 AM on 21 November 2010The Fake Scandal of Climategate
Many conservative columnists claim that the investigations were sponsored by the Unversity of East Anglia. Is this even true? If so, is it relevant to the accuracy of the investigations? Just to clarify, I am not a skeptic. -
muoncounter at 00:45 AM on 21 November 2010The question that skeptics don't want to ask about 'Climategate'
#115: KL, Hasn't the old 'lack of warming - its a travesty' dodge run its course?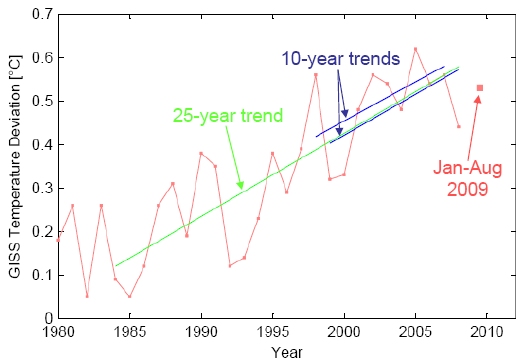 --Realclimate
Even the highly “cherry-picked” 11-year period starting with the warm 1998 and ending with the cold 2008 still shows a warming trend of 0.11 ºC per decade (which may surprise some lay people who tend to connect the end points, rather than include all ten data points into a proper trend calculation).
And then we have 2010, which continues to be well above average:
- The October worldwide land surface temperature was 0.91°C above the 20th century average
- The October worldwide ocean surface temperature was 0.40°C above the 20th century average
- The global average ocean surface temperature for the period January–October tied with 2003 as the second warmest on record, behind 1998.
Taking all the evidence, seems pretty solid.
--Realclimate
Even the highly “cherry-picked” 11-year period starting with the warm 1998 and ending with the cold 2008 still shows a warming trend of 0.11 ºC per decade (which may surprise some lay people who tend to connect the end points, rather than include all ten data points into a proper trend calculation).
And then we have 2010, which continues to be well above average:
- The October worldwide land surface temperature was 0.91°C above the 20th century average
- The October worldwide ocean surface temperature was 0.40°C above the 20th century average
- The global average ocean surface temperature for the period January–October tied with 2003 as the second warmest on record, behind 1998.
Taking all the evidence, seems pretty solid.
-
Ken Lambert at 00:41 AM on 21 November 2010The Fake Scandal of Climategate
Original Post The fact that three quick fire threads have been run on Climatgate on this excellent blog in the last few days is an indication that Climategate (fairly or not) has does serious damage to the cause of AGW activism. Mass media always overshoots and exaggerates. The AGW alarmists had a very good run - here in Australia protagonists like Tim Flannery and our living science legend Robin Williams were talking catastrophe - the 10 year drought was definitely permanent climate change - rivers might never run again - Robin (100 metre sea level rise) Williams refused to even read the Climategate emails. Climategate swung the pendumum to the other extreme - the scientists (nearly all funded by you and me) were under the pump. Their socks rubbed harder on their sandals as they scrambled for clear air. Cries about criminal hackers funded by big oil, tobacco, rightist conspirators etc were heard. Panchuri cried 'voodoo science' as he denied ever knowing about objections to the preposterous 2035 claim. How things change in a year. The drought is broken over most of Australia - Tim Flannery has gone quiet and Robin Williams is airing a science journo who says that AGW scares have been exaggerated. Some balance might have been restored as the pendulum swung, and our hard working misunderstood scientist bretheren will take more care with their emails in future. -
muoncounter at 00:28 AM on 21 November 2010It's the sun
#731: "The glacial cycle would seem to have made a much bigger difference " The 'glacial cycle' is a result, not a cause. Increased atmospheric CO2 is a causative agent (aka 'forcing') of increased warming. See CO2 is not the only driver. Please find the appropriate threads for further comments about whatever you refer to as 'cycles' -- this is 'its the sun'. -
muoncounter at 00:17 AM on 21 November 2010The question that skeptics don't want to ask about 'Climategate'
#99: "Given what has been reported in the press about suppression of articles critical to the AGW premise," If by press, you mean the usual crowd of denial blogs, conservative 'think-tanks' or the claims of the ID crowd that they aren't allowed to 'teach the debate'. But on balance, you've got it backwards: Hansen on censored science Research findings suppressed by government
Prev 2093 2094 2095 2096 2097 2098 2099 2100 2101 2102 2103 2104 2105 2106 2107 2108 Next


