


 Arguments


Recent Comments
Prev 2125 2126 2127 2128 2129 2130 2131 2132 2133 2134 2135 2136 2137 2138 2139 2140 Next
Comments 106601 to 106650:
-
What should we do about climate change?
Peter Lang - If you have no wind for weeks at a time, then you have the wrong power mix. There should be solar plants in the network as well, possibly "in place of". It's important to site renewable supplies in a way consistent with local climate. I must admit that I too find your advocacy for nuclear a bit off-putting, and your claims that renewables don't reduce CO2 production difficult to believe. There are certainly a lot of countries and businesses investing renewables. http://www.xkcd.com/808/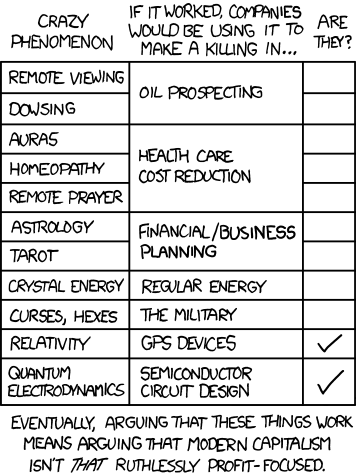
-
Turboblocke at 07:58 AM on 31 October 2010What should we do about climate change?
Sorry, please use this link for the UKERC 2006 Intermittency report -
Turboblocke at 07:34 AM on 31 October 2010What should we do about climate change?
A review here gives costs for each electricity generating technology, including by country, which is a bit of an eyeopener: Estimates of electricity production costs I disagree with Peter Lang's posts about renewables' effects on CO2 reduction. Renewables punch above their weight, as what they put on the grid means that the lowest-efficiency/most expensive fossil plant drops off the grid. This is known as the merit-order effect. Merit order In practice this means the CO2 emissions savings tend to be from the dirtiest coal plant. * The UKERC 2006 TPA Intermittancy report deals with the subject of intemittency and shows that the efficiency losses in FF plant range from zero and 7% of the emissions savings from wind. This means that the wind savings range from 93- 100% of the emissions from the most polluting FF plant.* * Actually, this may not always true as it depends on the relative price of gas, coal and oil. Which brings me to Ann's concern: any tax on carbon has to be global otherwise, as she rightly implies, FF usage will just be transferred to the market where it is cheapest. However, a global carbon tax and a level playing field by taking away the annual $550+ Billion subsidies to fossil fuels will make renewables competitive enough to make fossil fuels way too expensive to burn. -
Riccardo at 06:05 AM on 31 October 2010What should we do about climate change?
quokka the US is probably going to loose its leadership in all the renewable energy sector. Estimates are that it invest about half of what China does. In relative terms, it invest less than almost any european country. And yes, China "game plan" is to invest a lot and gain the leadership in the modern energy production and distribution sector. USA should play the same game, but apparently they're not willing to. -
Peter Hogarth at 05:58 AM on 31 October 2010DMI and GISS Arctic Temperatures: Hide the Increase?
I have updated all appropriate charts in all posts with the new DMI data. The overall DMI average trend increases slightly from 0.376 to 0.383 degrees C/decade. I also calculated trends for the difference between the Lansner and DMI Summer "above zero" data, which was 0.024 degrees C/decade. Whilst this error may seem small, it effectively doubles the real trend which is most likely due to small bias errors in transitions between models. -
Peter Hogarth at 05:03 AM on 31 October 2010DMI and GISS Arctic Temperatures: Hide the Increase?
I now have the updated 2010 ECMWF T1279 model (used by DMI since January 2010) daily 2m temperature values for >80N, (courtesy of DMI). From this data the average Summer “above zero” temperature is 0.48 degrees C for 2010. Although this is indeed a relatively low value, it is from the first Summer data from the new T1279 model time series, and as DMI have pointed out this model change alone could easily account for small bias steps (similar to those seen elsewhere in the series). It is obviously too early to say yet for trends from the T1279 model. If the Lansner “pixel count” errors (-0.23 degrees C for 2009, -0.14 degrees C for 2010) are also factored in we can explain the apparent Summer "cooling" as an artifact due to a combination of these two errors. Bias errors are discussed (with respect to corrections applied to different overlapping satellite sensor data) in some of the references in the advanced article. The ERA-Interim does attempt to resolve these bias differences. The daily ERA-Interim re-analysis values are not readily available for Summer 2010 yet. Given the relatively low variability of Summer temperature values from 1989 to date and the very small positive summer “above zero” trend of 0.1 degrees C/decade in the ERA-Interim daily "above zero" data there is no reason to expect large deviations for summer 2010 values. The Summer monthly ERA-Interim values for >80N (JJA) give what is statistically speaking a flat line trend between 1989 and 2009. Given that melt season temperature rises as well as falls are constrained by the ice melt temperature (whilst the ice exists) this is to be expected. -
quokka at 04:02 AM on 31 October 2010What should we do about climate change?
#181 archiesteel 1. German PV solar has an installed nameplate capacity of ~13 GW. The capacity factor is ~12%. The amount of electricity generated from solar PV is about the same as one EPR nuclear power plant. But at around ten times the cost. Germany could have had ten EPR's for the cost of solar PV and that would represent a significant CO2 abatement. I find it impossible to find any sense in this. 2. Lumping together solar and wind with hydro under the banner of renewables is very misleading. Hydro is readily dispatchable. Solar and wind are not. This is critically important. Furthermore hydro is resource limited and cannot grow indefinitely. The issue is not whether solar and wind can generate some electricity with low life cycle CO2 emissions, because they clearly can. The issue is whether they can displace fossil fuels in baseload electricity generation. This is far more problematic. We do know that nuclear can because of the French example. As to "hot or not", the hand wringing over nuclear is very much a Western political affliction. The major Asian economies are all committed to nuclear power and China in particular is building 80 GW of nuclear by 2020. To put this in perspective it is the equivalent of about 660 GW of solar PV in Germany. Germany currently has 13 GW. The cost of new nuclear in China is substantially cheaper than wind and hugely cheaper than solar. China has announced the investment of $180 billion in a "nuclear city" - a giant technology park for manufacture of nuclear components, R&D, education and training etc. The intent is obvious - a massive gearing up for large scale nuclear deployment. There are many countries now very seriously considering or planning for nuclear - including a number of middle eastern and north African states. Italy is reconsidering nuclear. Vietnam is proceeding with nuclear and recently called for regional cooperation to develop nuclear power. South Africa is planning for much increased nuclear. Of course it remains to be seen how widespread new nuclear deployment develops but worldwide it is simply untrue that renewables are not and nuclear is not. It is very obvious also that if the US keeps on dithering, it's lead in nuclear science and engineering will be lost to the Asian countries and the latter will become the worlds major exporters of nuclear technology and engineering and that is their game plan. -
muoncounter at 02:24 AM on 31 October 2010What should we do about climate change?
#158: "The actual measurements that have been made (in Netherlands, Texas and Colorado), suggest that wind power avoids little if any emissions." The headlines regarding the rate at which wind farms are growing required posing the question in #153. Your objection to my quote from a wind industry group was certainly warranted. However, citing measurements made in Texas is not a meaningful point of reference: Texas is home to a large refining and industrial industry, thousands of old oil and gas wells (many still flaring methane) and Texans loooove to drive them big ol' cars. So the state that simultaneously has the largest wind energy capacity in the US is also the worst carbon emitter in the US. Denny and O'Malley 2006 It was found that wind generation could be used as a tool for reducing CO2 emissions but alone, it was not effective in curbing SO2 and NOx emissions. Environmental impacts of wind energy projects, NAS Based on U.S. Department of Energy projections for wind-energy development in the United States, the committee estimated that by 2020, wind energy will offset approximately 4.5 percent of the carbon dioxide that would otherwise be emitted by other electricity sources. White 2007 The normalized CO2 emissions, in tonnes of CO2 per GWeh, ranges from 14 to 33 for the wind systems, 974 for coal, and 10 and 34 for nuclear fission using gas centrifuge and gaseous diffusion enriched uranium, respectively. -
archiesteel at 00:52 AM on 31 October 2010What should we do about climate change?
@Peter Lang: Renewables currently provide 18% of energy production worldwide. Germany's solar power output in snow at 4,1 GW, 1.1% of the country's energy, but it is expected to get to 25% by 2050. Renewable energy in Germany is now 16% of total energy production. It's clear you are not being objective in your argument, and that your enthusiasm for nuclear energy has clouded your judgement. Again, many of us are not discounting nuclear, but your nothing-but-nuclear attitude is highly suspicious. It's hard not to believe you have a personal stake, sorry. "I see. And what do you base that on? Greenpeace, I suppose" No, physics. Nuclear power requires complex and extensive security protocols in order to keep it safe. Nuclear waste disposal is a serious issue (just remember the debate about Yucca mountain). "archiesteel, I'd urge you to challenge your beliefs too." You first - although I suspect they're not actually beliefs, but rather self-interest. Doesn't really matter: renewable are hot, nuclear is not. You didn't even address the argument of private client-producers contributing to the power grid. In other words, you are sticking to your guns and refusing to hear any other argument in favor of renewables... -
Riccardo at 22:04 PM on 30 October 2010What should we do about climate change?
I wonder how anyone could calculate the externalities due to nuclear plants and facilities decommissioning, long term storage and possible accidents related to them. As far as I know, there's still no well assessed solution. Indeed, the EternE study left them out; hence the 0.2-0.7 EUR-cents per KWh estimate should be considered as a lower bound. A few words on subsides. Given that externalities are by definition a market failure, we can not rely on any self-regulating mechanism. Then, even dropping all the direct and indirect subsides is not enough, we need to internalise the costs. -
Peter Lang at 20:18 PM on 30 October 2010What should we do about climate change?
CBDunkerson "And that's despite a ridiculously pro-nuclear bias, limiting the study area to exclude all previous nuclear disasters, and defining 'safety' based on what HAS happened in the past rather than what COULD happen in the future?" Clearly, you haven't understood. But you could hardly expect to in 10 minutes. Here is the link to ExternE? http://www.externe.info/ . You probably need to start here because you have no understanidn about the subiect. -
Peter Lang at 20:12 PM on 30 October 2010What should we do about climate change?
CB Dunkerson "In short... you're wrong and even a study biased towards your position STILL says you're wrong." Why do you say that ExternE is biased one way or another? -
Peter Lang at 20:10 PM on 30 October 2010What should we do about climate change?
CBDunkerson What did you look at? Did you look at figure 1 and figure 2 here? Can you interpret them? Did you read the article? -
RSVP at 19:45 PM on 30 October 2010Waste heat vs greenhouse warming
RSVP #353 "...I must be considering too much air (the problem at hand must be limited to a lower altitude). This makes sense, because we know that its much colder at 27,000 feet than "near the ground". " so continuing... with this idea... you can assume less air, and make the comparison for 2700 feet, one tenth of the height, so as to equal the amount of energy to raise the temperature of air 30 degrees, to that which is received in a twelve hour period. The question arises, as this is just the amount of energy to warm this amount of air 30 degrees, what is left to warm the surface as well? A surface that is contantly radiating during the full 24 hours. The altitude to consider must be lower then. So, lets take it down to 1000 feet for the comparison. Now there is energy for warming that amount of air 30 degrees, and double for the surface which is radiating constantly. The 30 degrees may as well be due to convection for all we need to care. Its doesnt really matter, since the object here is to figure out how much air to consider for a comparison of solar to the effects of waste heat. If you now only consider the mass of air associated with 1000 feet around the entire globe (instead of 27000 feet), the effects of waste heat as calculated earlier goes up 27 times. Crossing you fingers doesnt make this energy dissapear, yet it is always considered insignificant to what can be imagined as a greenhouse effect. I have lost the debate here not for what I have said, as the numbers speak for themselves, but for commitment to an entrenched theory. Whether the GHG is real or not shouldnt really matter to anyone that is truely concerned with global warming, since fossil fuels are running out anyway. Waste heat on the other hand will always be an inconvenient truth, whether it comes from nuclear, or changes in albedo due to urbanization, solar panels, highways, etc. For this reason, I understand how it is not an attractive topic, especially for those with optimism about the alternative energy sources. -
CBDunkerson at 19:45 PM on 30 October 2010What should we do about climate change?
Peter #175: So... your evidence that solar, wind, and hydro power are NOT safer than nuclear is that nuclear is safer than coal. Who could argue with such logic? BTW, the report you cite... doesn't cover solar at all, but finds hydro and wind to be safer than nuclear. And that's despite a ridiculously pro-nuclear bias, limiting the study area to exclude all previous nuclear disasters, and defining 'safety' based on what HAS happened in the past rather than what COULD happen in the future. In short... you're wrong and even a study biased towards your position STILL says you're wrong. -
Peter Lang at 19:30 PM on 30 October 2010What should we do about climate change?
CBDunkerson "Are you arguing just for argument's sake or are you truly that delusional?" Are you capable of questioning your beliefs? Seriously are you? If so look at this, then ask your questions? I suggested in the post you replied to to Google: "ExternE, NewExt". Obviously you didn't bother. You just posted your comment based on your beliefs. Nuclear is about the safest of all electricity generation technologies on a properly comparable basis (life cycle analysis). It is about 10 to 100 times safer than coal. -
scaddenp at 19:02 PM on 30 October 2010What should we do about climate change?
daisym - I am not sure I understand you. You claim that scientist cant tell you what will happen to climate if you go to zero emissions? This seems to be at odd with published papers. Eg. Hare and Meinshausen or Matthews and Weavers. You will much more in references and citations for these. If these papers dont cover what you mean, can you explain more? Meinshausen has also published on what limitation on GHGs is needed to meet a 2deg limit. -
CBDunkerson at 18:53 PM on 30 October 2010What should we do about climate change?
Archiesteel: "Solar, Wind and Hydroelectric are all safer than current nuclear power production," Peter: "I see. And what do you base that on?" Seriously? You're actually going to argue that sunlight, wind, and/or water are more dangerous than nuclear radiation? Are you arguing just for argument's sake or are you truly that delusional? Yes, there are numerous safety precautions taken with nuclear power... precisely BECAUSE it is so very dangerous. No matter how 'safe' those precautions make it there is still a possibility of error or disaster which simply does not exist with renewable power. Imagine a terrorist attack on a wind farm... worst case scenario it takes out the power and maybe some cows get crushed by falling wind turbines. Things could be just a bit worse with a nuclear plant. Radiation release. Stolen radioactive materials. Possible meltdown. -
Peter Lang at 18:38 PM on 30 October 2010What should we do about climate change?
JohnD "what is the actual payback time in terms of energy input, and carbon emissions, that goes into the manufacturing, installation and maintenance of these renewable sources and extra infrastructure required when the real operating efficiencies are allowed for?" I'll refer you to Professor Barry Brooks article here to answer this question. John, thank you for your question. I don't take much interest in discusions about energy return on energy invested (ERoEI) because I feel it is irrelevant given that the fuel for nuclear power is effectively unlimited. So, from my perspective, such discussion are a distraction from what is important. -
John Mason at 18:07 PM on 30 October 2010The Grumble in the Jungle
Peter #6 - Indeed - the reality is being acted out on the ground! Good to see the refutations mounting up - this is already the best source for quick factual debunks and is improving all the time. Cheers - John -
Glenn Tamblyn at 17:42 PM on 30 October 2010Isn't global warming just 2 °C and isn't that really small?
Wow ClimateWatcher misquotes a post to make a point. ON THAT POST. That is magnificently Brazen. CW Said "There are 3 problems with even small sounding global warming. Firstly, 2 °C is a very optimistic assessment: ..... if the skeptical Dr Roy Spencer is correct here then we’re on course to get more like 3.5 °C." My ellipses added. Actual quote from MarkR "There are 3 problems with even small sounding global warming. Firstly, 2 °C is a very optimistic assessment: WE ARE CURRENTLY ON COURSE TO DOUBLE CO2 TWICE SOON AFTER 2100. If the skeptical Dr Roy Spencer is correct here then we’re on course to get more like 3.4 °C, but if most climate science is correct then we’ll get 6 °C." My Emphasis. Now thats what I call chutzpah. -
Peter Lang at 16:39 PM on 30 October 2010What should we do about climate change?
JohnD "what is the actual payback time in terms of energy input, and carbon emissions, that goes into the manufacturing, installation and maintenance of these renewable sources and extra infrastructure required when the real operating efficiencies are allowed for?" I'll refer you to Professor Barry Brooks article here to answer this question. John, thank you for your question. I don't take much interest in discusions about energy return on energy invested (ERoEI) because I feel it is irrelevant given that the fuel for nuclear power is effectively unlimited. So, from my perspective, such discussion are a distraction from what is important. -
johnd at 16:30 PM on 30 October 2010What should we do about climate change?
Peter Lang at 15:46 PM, apart from the $ payback time for solar and wind energy installations, including the large and ongoing subsidies needed, what is the actual payback time in terms of energy input, and carbon emissions, that goes into the manufacturing, installation and maintenance of these renewable sources and extra infrastructure required when the real operating efficiencies are allowed for? -
Peter Lang at 16:04 PM on 30 October 2010What should we do about climate change?
Archiesteel, "Solar, Wind and Hydroelectric are all safer than current nuclear power production," I see. And what do you base that on? Greenpeace, I suppose. Google: "ExternE NewExt" and get your facts straight, rather than propogating wrong beliefs. Don't forget that solar and wind cannot provide power on demand so you have to include the risks from back-up generators or storage to make a fair comparison. Even if you don't do this you find that solar is far more dangerous than nuclear and wind slightly safer (but it is not an apples to apples comparison without back up or storage). archiesteel, I'd urge you to challenge your beliefs too. -
Peter Lang at 15:46 PM on 30 October 2010What should we do about climate change?
Archiesteel, Germany has spent something like EUR 46 billion on subsidies to get less than 1% of its electricity generation from solar. And that electricity is available during the day and summer only. A hopeless waste of money. Germany, Spain and Denmark are the classic examples of what not to do. is one study on Germany. Others have been released recently. Just to be clear, I am advocating we transition to least-cost, low-emission electricity at a rate that is economically rational. I also say that renewables will make an insignificant contribution to our energy supply based on the fact they are far too expensive and they depend on intermitten, low energy density 'fuels'. Therefore we should not be spending all our effort arguing for renwables (which is what happens on most sites like this) while continuoually repeating the tired old anti-nuclear arguments (all of which have been refuted reoeatedly). I argue we should remove all the impediments to nuclear and rmove all the regulations that favour fossil fuels and renewable energy. We should establish a mechanism so that any type of generator can appeal regulations that advantage one type over another. We need a level playing field. If we had that, nuclear would have an enormous advantage ver the others - eventually, because it will take a long time to eradicate all the imposts we've built in over the past 50 odd years.4 Nuclear has proven it can do the job. Non-hydro renewables have proven, so far, they cannot. They are a massive waste of a countries wealth - meaning funds wasted on supporting these schemes cannot be spent on health, education, infrastructrure and addreessing the real environmental problems. You suggest that I argue for nuclear being part of the solution. I do! I argue for the selection of technologies being on a rational basis, not belief and wishful thinking. On that basis I expect nuclear will supply about 80% of our electricity (as in France), with the balance made up of hydro, gas, oil coal and a few percent of a range of renewables, all of which are effectively irrelevant in the overall scheme of things. In other words, we should put our focus and effort where it is needed, not on the fringe technologies. -
archiesteel at 15:19 PM on 30 October 2010What should we do about climate change?
@Peter Lang: "It is about the safest of all electricity generation technologies." Yeah, good luck with that one. Solar, Wind and Hydroelectric are all safer than current nuclear power production, if only because such they do not produce radioactive waste (and, at least for the first two, aren't potential terrorist targets). Look, we get it. You like nuclear, and you see it as the sole solution to curb CO2 emissions (by the way, I'm assuming you agree that we need to cut CO2 emissions to counter global warming - is this true?). People here disagree, and think that renewables also have a role to play. At this point, I think we have to agree to disagree. -
archiesteel at 15:11 PM on 30 October 2010What should we do about climate change?
@adrian smits: are you seriously arguing that the nuclear industry is over-regulated? -
archiesteel at 15:08 PM on 30 October 2010What should we do about climate change?
@Peter Lang: "I do not have any personal stake in nuclear power." I didn't say you, I said you sounded like you did - and your insistence on nothing but nuclear is bound to turn people off of it. It is the unfounded belief and advocacy of renewables that is political. And yet, as the German example shows up (and I notice you didn't reply to that part), it *is* possible to have a significant power supply from renewables. Why are you ignoring the great opportunity Solar and Wind offer to small client/producers? "Ann, you seem to be arguing for anything but nuclear. I wonder why? What is your real reason?" It is you who are insisting that nuclear is the only way forward. Any strategy that puts all of the eggs in the same basket is doomed to fail. I'm sorry, but your posts really sound like ads for the Nuclear Industry. You'll get more traction if you start selling Nuclear as *part* of the solution, rather than the only way to go. "The wind industry, like most industry organisations, presents the most favourable view possible of its industry." Like the Nuclear industry as well, right? The criticism of wind not prevent CO2 emissions can also be applied to Nuclear. Again, I'm not opposed to nuclear power as part of the alternative to fossil fuels, but the pro-nuclear bias in your messages seems a bit extreme. -
peter prewett at 14:55 PM on 30 October 2010The Grumble in the Jungle
Interesting to see the following in the Guardian today Amazon drought leaves Brazil's Rio Negro dry http://www.guardian.co.uk/environment/gallery/2010/oct/26/amazon-drought-brazil#/?picture=368055072&index=7 Peter -
Mikemcc at 13:59 PM on 30 October 2010The Grumble in the Jungle
No problem for me, a great explanation, far better than I did when I was arguing the point at the time! -
adrian smits at 11:41 AM on 30 October 2010What should we do about climate change?
Modern nuclear power plants can be built at a fraction of the cost of the older systems if our regulators would just catch up with the new technology and get out of the way! -
Peter Lang at 11:12 AM on 30 October 2010What should we do about climate change?
@153 muoncouter quoted this statement from the wind energy advocates: "Wind energy is already making a significant contribution to saving CO2 emissions. The 158GW of global wind capacity in place at the end of 2009 will produce 340 TWh of clean electricity and save 204 million tons of CO2 every year. Has anyone considered how we could trade CO2 emissions, or tax them, if we don't have a reliable way of measuring the emissions or how much is avoided? The wind industry, like most industry organisations, presents the most favourable view possible of its industry. These figures about the emissions avoided by wind farms are based on the assumption that wind energy displaces emissions from fossil fuel generated electricity as if there was no efficiency loss in the fossil fuel generators. This assumptions is false. It has been known for some time that the penalty is substantial and recent studies confirm that wind power avoids little if any greenhouse gas emissions. The question is, how could we trade or tax emissions when we can continually misrepresent the emissions avoided by wind farms? -
daisym at 10:31 AM on 30 October 2010What should we do about climate change?
The thrust of my comment (#69) was to ask the question: If we forego use of carbon fuel energy sources by whatever extent our windmills and solar arrays can generate clean energy, why can't scientists estimate the effect this will have on global temperatures? Your comparison to calories and dieting is an excellent way to look at this: By subsidizing the manufacture and deployment of wind and solar energy devices, government has (in effect) put us on a carbon fuel energy diet, because these devices cut CO2 emissions by reducing our consumption of carbon fuels… or by reducing future increases in carbon fuel consumption. Like the dietician, why can't the scientist estimate how reducing CO2 emissions will change global temperatures? In this comparison, CO2 emissions represent the “calories” that change atmospheric CO2 content. And because atmospheric CO2 content is a proxy for global temperature, total atmospheric CO2 content thus represents global temperature or “weight.” The scientist can tell us how much “weight” (global warming) we’ll gain if we continue to consume carbon fuels. They can surely tell us how much “weight” we’ll lose when we replace a portion of our carbon fuel consumption with carbon-free wind and solar energy consumption. But scientists haven’t told us what effect the “Wind and Solar Energy Diet” will have on global temperatures. And I asked the question: “Why haven’t they?” If government has put us on a wind and solar energy diet as the solution to the manmade CO2 (i.e. global warming) problem, how can we even estimate that it will work if no one prepares the estimate? Is our faith in the wisdom of government bureaucrats so certain? Why are scientists silent on the efficacy of government’s solutions? Doesn’t government rely on scientists to provide this information? I want to see scientists prepare various timeline scenarios that show how and when we can reach the atmospheric target which will stabilize global temperatures at the “best” temperature (whatever that may be). Armed with this information, government would then have the tools they need for making better informed public policy decisions. But scientists haven’t done this. In the absence of this, and despite all the pioneering climate research that’s been done, science has done real no service to humanity. Science has identified this problem, but seems to have no interest in providing government with a workable scientific solution. Why is this? -
Peter Lang at 10:27 AM on 30 October 2010What should we do about climate change?
Why energy cheaper than from coal is important see this slide show. See Slides 29 to 38 Energy cheaper than coal is important (Slide 31) Population is stable in the developed world (about 1.2 billion) (Slide 34 Population is increasing in the developing world (currently world population is about 6.9 billion and projected to be over 9 billion by 2050). The projected increase is in the developing world. Prosperity stabilises population (Slide 35 - children per woman versus GDP per capita) Stable replacement rate is 2.3 children per woman. (slide 36) Countries with $7,500 GDP per capita have fertility rate below the stable replacement rate. (slide 37) Prosperity depends on energy (slide 38). This video, from 4 to 16 mins explains why we need to focus on providing clean electricity cheaper than from coal It makes these points: Conservation will not stop energy growth Energy and coal use is growing rapidly in the developing nations. The US uses 12,000 kWh per person in 2010; total US consumption = 3.8 PWh Assume US could halve its energy use to 6000 kWh per person by 2050, to 1.9 PWh total. The rest of the world grows energy use to get to the same per capita consumption (6000 kWh per person). Total world consumption grows from 15.4 PWh now to 37.7 PWh in 2050. So, even if the US halved its per capita electricity consumption, world consumption would grow from 15.4 to 37.7 PWh. Can’t do it with taxes. The answer is to produce electricity cheaper than from coal. We can produce electricity cheaper than we do today so that alone will improve economic productivity, reduce poverty, improve standard of living, and reduce population growth. -
Rob Painting at 10:16 AM on 30 October 2010The Grumble in the Jungle
MikeCC - This is a basic rebuttal, one of a series adressing the skeptic arguments. Eventually all arguments will have a basic/intermediate/advanced version. It will take some time for this process to be complete. Hope that helps. -
Peter Lang at 10:07 AM on 30 October 2010What should we do about climate change?
”I just think that the proposed measures to – fight climate change or reduce CO2 emissions, any way you want it – are indirect and therefore not as effective as they could be. And perhaps even not effective at all.” Why do you believe replacing coal power stations with nuclear (in an economically rational way) is not effective at cutting emissions? It is proven that it works. See France for example. Why do you argue that replacing coal with nuclear is an indirect way to cut emissions but then argue for CCS? Why do you think CCS would be a more direct way of cutting emissions? You still have the coal mining, the burning of the coal and making of CO2 (plus all the other particulates and toxic emissions) the waste from coal mining, the fly ash, the transport, the leakage from CCS and the mass suffocations when the CCS pipes leak or fracture (which will happen). ”The effectiveness of deploying green energy, or nuclear energy in the battle against climate change rather hinges on the assumption that this will cause humanity to leave a substantial part of all fossil fuels in the ground. If this assumption is wrong, the ultimate effect of these efforts will be 0. I think we should directly try to control the amount of CO2 or carbon that enters the carbon cycle. Through the development of the CCS (carbon capture and sequestration) technique that can remove up to 85-90 percent of CO2 emissions of coal powered plants,” Why do you believe CCS would be more direct than replacing coal with nuclear (or any economically viable low emission technology that would be capable of replacing coal)? Why do you believe that CCS can remove 85% to 90% of CO2 emissions? This seems like an enormous leap of faith. Just as big a leap of faith as thinking that solar thermal with energy storage may be able to provide base-load generators by 2030. Those are enormous leaps of faith. I don’t believe either of these technologies will be viable as much more than demonstrations and heavily subsidised ways to keep the gas industry and coal miners happy through a few more elections (the gas industry loves wind and solar because that means lots of gas). Ann, you seem to be arguing for anything but nuclear. I wonder why? What is your real reason? Nuclear is by far the least cost way to cut emissions from electricity generation. It is about the safest of all electricity generation technologies. It has by far the smallest footprint. Most importantly it is well proven. The other technologies you are hoping for are decades from being available at the scale needed, and probably will neve be viable except as a small token contribution. What is the real reason you are anti-nuclear. I challenge you to challenge your beliefs - your underlying fears. -
scaddenp at 09:42 AM on 30 October 2010Medieval Warm Period was warmer
Government and business fund research everywhere. I am sure you would have no problem getting research money from fossil fuel companies - they already fund misinformation. Oil companies spend enormously on research and many have serious internal grunt. You might ask why they havent invalidated climate theory from their own resources if it was that easy? My guess - misinformation is far more likely to succeed, cheaper and effective. -
Mikemcc at 09:36 AM on 30 October 2010The Grumble in the Jungle
Why are you reacting to an event that happened back in January? I can appreciate that it was a point that needed tackling. But it does seem odd that it has taken this long. -
David Horton at 09:07 AM on 30 October 2010The Grumble in the Jungle
And the terminology difference in the "how much of Holland is below sea level/river level/could be flooded". It would be nice of the MSM pointed out to people that indeed the Amazon forests are threatened, the glaciers are melting, Holland will be flooded. Instead of, I'm sure quite unintentionally, leaving the public with the impression that the report was "full of errors". Now don't anyone tell me it was intentional or I'll be left with no childish illusions at all (and I could have made a lot of money if the tooth fairy had been around in recent years, I can tell you). -
Ann at 09:02 AM on 30 October 2010What should we do about climate change?
Peter @145, “First let’s discuss your proposal to fight climate change” No, those are your words not mine. My proposal is for cutting CO2-e emissions, not fighting climate change. The connection is for others to make. I am also advocating the transmission from fossil fuels to nuclear for many reasons: energy security, cheaper electricity in future to power a world that wants a better life, health and safety, reduced use of resources and others. Sorry, I didn’t want to put words in your mouth. Although it amazes me that your goal would be to cut CO2 emissions but you don’t want to connect it with climate change. For what other reasons would you ever want to reduce CO2 emissions ? “Ann:Fossil fuel will continue to be used until all reserves have been depleted. Don’t you agree with that assumption?” No. The Stone Age didn’t end because we ran out of stones. It finished because we developed better technologies You (and several other people on this forum) are convinced that the use of fossil fuels will go down drastically once we start deploying nuclear/renewable energy on a massive scale. To the extent that not all available fossil fuels will ever be mined. People will at a certain point in the future just lose their interest in fossil fuels. You may be right. I am not convinced. Anyway, it is a very important assumption, and an assumption that should be backed up by scientific research. Because the answer to this question determines how much CO2 is eventually going to end up in the atmosphere (and therefore the magnitude of the climate change that awaits us). Ann, perhaps it is time for you to reveal your agenda. If it involves trying to get the wealthy nations to make a major lifestyle change, then good luck. That is not a realistic option. It is so far from being realistic there is no point in discussing it. I don’t have an agenda. I just think that the proposed measures to – fight climate change or reduce CO2 emissions, any way you want it – are indirect and therefore not as effective as they could be. And perhaps even not effective at all. The effectiveness of deploying green energy, or nuclear energy in the battle against climate change rather hinges on the assumption that this will cause humanity to leave a substantial part of all fossil fuels in the ground. If this assumption is wrong, the ultimate effect of these efforts will be 0. I think we should directly try to control the amount of CO2 or carbon that enters the carbon cycle (sorry if I start to sound repetitive, it’s just I am answering different people). Through the development of the CCS (carbon capture and sequestration) technique that can remove up to 85-90 percent of CO2 emissions of coal powered plants, through appliances that can remove CO2 from the air (artificial trees), through reforestation. However, that requires a carbon trading mechanism to be accepted worldwide. -
Peter Lang at 08:07 AM on 30 October 2010What should we do about climate change?
Muoncounter @153, You are quoting the wind energy advocates without questions what they are saying. 39% increase in capacity sounds great, doesn’t it? Until you realise that a 39% x 1% = 0.39%. Quoting figures like this is pure spin. It confuses many. So we put all our efforts into technologies that can achieve next to nothing, while we prohibit the technologies that can make a real difference. Irrational advocacy of renewable energy damages the credibility of all those pushing such schemes, and by extension damages the credibility of all they are arguing for. You quote this statement from the wind energy industry: “The 158GW of global wind capacity in place at the end of 2009 will produce 340 TWh of clean electricity and save 204 million tons of CO2 every year.” Please provide substantiation for that calculation. Where are the measurements that support it. I can tell you that they do not exist. The actual measurements that have been made (in Netherlands, Texas and Colorado), suggest that wind power avoids little if any emissions. -
Peter Lang at 07:54 AM on 30 October 2010What should we do about climate change?
A carbon tax will increase not decrease world emissions. It will increase them over the long term. A carbon tax in the developed countries will reduce emissions in those countries (a little), but the emissions are exported to other countries. This is what Europe has already done by sending its manufacturing to Asia and then buying back the products with higher embedded emissions than if they'd been manufactured in Europe. More important, raising the cost of electricity generation in the developed countries means the cost of clean generators will be higher than they otherwise would. That means the developing world will build more fossil fuel plants than they otherwise would. Carbon tax is exactly the wrong policy to cut world emissions (especially while the impediments to cheap clean electricity remain in place). -
Ann at 07:41 AM on 30 October 2010What should we do about climate change?
dr2chase, #137 An 80% reduction in CO2 emissions is what I understand is the goal. Not 100%. An 80% reduction means that we still, ultimately, drill all the oil, but it takes five times longer. “ultimately drill all the oil” -> so the resulting CO2 ultimately still ends up in the atmosphere, but it will take 5 times longer ? Is there anything crucial to the fact that CO2 emission will be freed more slowly ? I understand it may be important as a transitional effect, but it will make no difference to the final state of the earth’s atmosphere, and therefore to the eventual magnitude of the climate change, correct ? And, oil drilling is expensive; if we make conservation and non-fossil alternatives cheap enough, the lower price of oil will not justify aggressive drilling. It's not a case of wave-a-wand and it happens; as time goes by, the remaining oil will be more and more expensive to extract, and the sooner we can put cheap alternatives on the market, the sooner (reduced) price pressure will reduce the drilling rate. Economic incentives (carrots and sticks) probably help accelerate this, but there is a price for oil, relative to alternatives, that will cut its consumption by 80%. Yes, I see that could help. But another thing that may happen: installing a lot of extra power beside the traditional fossil fuel plants will only increase mankind’s hunger for energy. It might accelerate the world population growth (in nature, the growth of a animal population depends on the available resources, I guess for people that mechanism will also be at least partly true). In such a scenario we might not even be able to discard with fossil fuel, even expensive fossil fuel. -
GFW at 07:39 AM on 30 October 2010What should we do about climate change?
Now on to Ann (ah, I think Michael Sweet has just got to this too). The idea that an increased supply of non-carbon sourced energy would make carbon sourced energy cheaper is only true under the current subsidies/low taxes and (apparently) zero-liability environment for fossil fuel companies. If we took away their direct tax subsidies, charging them full mineral extraction fees, took away their international protection via the US military and imposed a carbon tax that came anywhere near to covering what should be their liability for the damage their product is causing ... the price of their product would go up a lot, and wouldn't fall much at all when larger supplies of cleaner energy are available. -
Peter Lang at 07:36 AM on 30 October 2010What should we do about climate change?
KR @147, I suspect you may have many misunderstandings about electricity supply and especially about wind energy. I can't cover it all here. The BraveNewClimate web site, 'Renewable Limits' tab might be worth a visit. By the way, The Australian National Electricity Market grid has the largest areal extent of any single grid in the world (so I am told). Wind farms are spread over the southern part of this grid. They span an area of 1200 km east-west by 800 km north-south. We commonly have no wind over that whole area for days at a time. One such period lasted about a week recently (May 2010). During that period there were about 65 5-minute periods where the wind generation was negative. That is, the wind farms were drawing more power than they were generating (by up to 4 MW negative). -
muoncounter at 07:35 AM on 30 October 2010What should we do about climate change?
#146, 147: Wind power seems to be more popular: More wind power capacity installed last year [2009] in the EU than any other power technology U.S. wind power capacity soared 39 percent last year [2009] Chinese wind power surpasses US More to the point of this thread, from the Global Wind Energy Council: Wind energy is already making a significant contribution to saving CO2 emissions. The 158GW of global wind capacity in place at the end of 2009 will produce 340 TWh of clean electricity and save 204 million tons of CO2 every year. Are these folks unconcerned by Peter Lang's objections in #141? Or those objections something out of Don Quixote? -
GFW at 07:33 AM on 30 October 2010What should we do about climate change?
This is a little late, but the short answer to daisym @69 asking "Why won't government and scientists prepare estimates of global temperature reductions to be expected by replacing SOME of our carbon fuels energy sources with power from windmills and solar panels?" is That's what the different emission scenarios are in the IPCC (and other) projections. They very carefully lay out "this is what we expect if we follow the current path of getting as much power from fossil fuels as possible" ... "this is what we expect if taxes/subsidies push x percent of power generation to non-carbon by y date", etc. So the "why won't" in your question makes the question wrong to begin with. They have. -
dr2chase at 07:31 AM on 30 October 2010What should we do about climate change?
@ hpierce: Those are standard complaints, they have standard answers. Love the patronizing tone, "Get out an atlas...." #1 Riding a bicycle in the winter risks death no worse than cross-country skiing does. I happily ride in 20 degree weather, if it routinely got colder than that, I would just put on clothes. At 20, I wear two layers -- a thin wool undershirt, and a windblock. Any more and I overheat. No idea how low I could go with serious layering. Plan B, is to ride a bike that is enclosed or semi-enclosed -- faster in good weather, more comfortable in bad weather. People who #2 The wide open space has few people in it, so their fuel consumption is less important. Perhaps they keep using cars for quite a while, at least for long-haul trips. Remember, at least 1/3 of the country already lives in places denser than a Dutch town, and that's not counting the sub-50k cities and towns. Looking at Montana (fewer than 1 million people total) I note that 10% live in Billings, which has a density of 3000 per square mile -- cities and towns less dense than that in the Netherlands hit 40% bike ride share. Other Montana cities over the threshold include Great Falls, Missoula, and Helena. #3 On my bike, 50lbs of load allows me to ride no hands. 100lbs is okay on the flats. 200 lbs is the official cargo limit. If I routinely carried more than 100 lbs up hills, I would get an electric assist. Trailers are also an option. #4 Bikes work fine in the dark, and they work fine in the winter. You can buy snow tires, with studs (best ones are from Finland -- this suggests that there are people in other countries who ride in the cold and dark, and survive). Any kid too small to ride their own bike, can ride on the back of mine. I took my daughter to school on the bike of my bike (uphill) yesterday morning. #5 Inaccessibility of a national park is a regulation, not a physical law. People on bikes (in particular, bikes very much like the one I ride every day) have traveled from Alaska to Tierra del Fuego, traversing paths that are physically impossible for any car. A car is most assuredly NOT absolute freedom. Ever been stuck in a traffic jam? Ever had a mechanical failure and had to wait for a tow truck? Ever run out of gas? Ever gotten stuck in the snow/sand/mud? Heck, ever had to look for parking? Bikes suffer very little from these problems; they may be slow, but they go. And when they don't go, you can usually push them along on your own two feet. instead of waiting for assistance. Cars are exceptionally needy vehicles -- you just don't notice this because of their extensive (and often socialized) support infrastructure. And remember, the only thing special about my situation, is that I've put 10,000 miles on a bike in the last four years, and that does help the legs and lungs. I'm 50, well past peak fitness, with a commute distance that is about at the median (my fastest car commute is over the median). Over 100 million people in this country live in density similar to what I ride my bike through on the way to work. The vast majority of those people could do just what I do, if they cared to do it. You should also be careful to avoid thinking too narrowly about what a "bicycle" is -- suppose my example for evaluating the practicality of cars, was a MiniCooper or Smart Car. Bikes span the range from super-light folders, to e-assisted cargo bikes with 4" tires. -
michael sweet at 07:25 AM on 30 October 2010What should we do about climate change?
Ann, If we had a carbon tax it would reduce carbon mining right away and make use of nuclear or renewables more cost effective. One reason fossil fuels are so cheap is because they do not pay for all the damage they do. A carbon tax could charge them for the mess they make. The carbon tax could be adjusted until fossil fuel use was at what was decided is a good level. -
Ann at 07:14 AM on 30 October 2010What should we do about climate change?
Dunkerson, #136 I'm not sure this is true. A switchover to nuclear (or renewable) power would certainly stop the ongoing rise of fossil fuel prices... but I don't think it would cause them to reverse course. This isn't just a 'supply and demand' issue after all. Rising fossil fuel prices have been driven by increasing extraction and transportation costs. Neither of those would go down if we were suddenly using less fossil fuel... indeed, they would probably go up. You may be right. Although fossil fuel prices are at least partly controlled by speculation (remember crude oil prices rising steeply in the beginning of 2008). The point is: will we ever reach the stage that alternative energy has become so cheap that part of the fossil fuels will not be mined at all, since it isn’t economically interesting ? That mines will be closed before they are exhausted ? As we see the efforts in Canada to extract oil from tar sands in spite of the enormous amount of energy it costs, it doesn’t seem that way.
Prev 2125 2126 2127 2128 2129 2130 2131 2132 2133 2134 2135 2136 2137 2138 2139 2140 Next


