


 Arguments


Recent Comments
Prev 537 538 539 540 541 542 543 544 545 546 547 548 549 550 551 552 Next
Comments 27201 to 27250:
-
Tom Curtis at 17:34 PM on 12 October 2015CO2 lags temperature
It has now been four days since my challenge to tatelylle @496 that he either justify his apparently absurd claim that ice melt is not a feedback on changes in Global Mean Surface Temperature (GMST), or confirm that his argumentation has been based on equivocating between the cause of changes in GMST (in his earliest post, and by context of the main article) and the cause of initial melt of NH ice sheets. tatelyle has done neither. Apparently he can neither provide evidence for his claim, nor honestly admit to the equivocation that lies at the heart of his rhetoric. He has therefore demonstrated that he is either not interested in, or as MA Rodger suggests @499, not capable of coherent and honest discussion of the issues involved. Consequently I have no further interest in discussing the matter with him.
For readers following the discussion, however, I need to clarrify some issues. Specifically, tatelyle continues to make grossly inflated estimates of the Milankovitch forcing involved both changes in GMST and in the initiation of NH ice sheet melt.
For GMST, global temperatures fluctuate approximately linearly with net global Top Of Atmosphere (TOA) energy flux, subject to a lag based on thermal inertia which is large relative to a single year. It follows the relevant variation in TOA insolation is the globally, and annually averaged value. As a less accurate proxy of GMST, we could estimate regionally averaged temperatures as a function of regionally averaged net TOA flux; and from that estimate a global average temperature. This is less accurate because it ignores the large lateral heat transfers at the Earth's surface due to winds and ocean currents. However, even doing this we must again take a global, annual average. That is, if we assume NH summer temperatures vary with TOA solar flux, then the impact of that variation of GMST must still be averaged over the global surface area to reflect the impact on GMST. Ergo, tatelyle's core argument for higher relevant fluxes is based on the assumption that we are not discussing the effect of Milankovich cycles on GMST (contrary to the clear context in the main post and his initial statement of the issue).
Turning to the relevant forcing for the initiation of glacial melt, tatelyle is quite correct that it should not be globally, or hemispherically averaged. Rather, the value should be considered only over the area of ice melt. Never-the-less, tatelyle's back of the envelope calculations of the value are grossly exagerated. Specifically:
1) tatelyle uses an exagerated estimate of necessary increase in July 65o N insolation.
tatelyle uses as the baseline of his estimates a 90 W/m^2 change in mean daily insolation in July at 65o North. He draws that figure from the graph below, but only one of the upswings in summer insolation shown in that graph equals or excedes 90 W/m^2 (and that one did not result in a deglaciation). The mean increase in insolation on that chart, averaged across all upswings, is 60 W/m^2 (or 61 W/m^2 if only the two upswings leading to glaciations are counted). The median is 58 W/m^2 and the 5th percentile is 20 W/m^2. Clearly based on these figures, tatelyle's figure is at least a 50% and potentially a 350% exageration of the July 60o N insolation necessary for a deglaciation. As the largest insolation upswing did not result in a full deglaciation, it is clear that no value shown on the chart is sufficient for a deglaciation by itself, but that other factors must also be involved.

For what follows, rather than trying to estimate the exact insolation change needed, I have used the deglaciation with the smallest change in insolation, ie, the Holocene deglaciation, as a benchmark. I have calculated the values for the difference in insolation between the inosolation minimum (20 Kya) and respectively, the present, the peak Holocene insolation (9 Kya) and the onset of rapid deglaciation (15 Kya). For insolation figures I have used the data from Berger (1978) as it is considered most accurate for the present (1950) and equivalent to the more recent 1991 calculations out to 800 Kybp. As the data comes by 10 degree latitude band, I have calculated the 65o N values by taking an area weighted average of the 70o (75-65o) and the 60o (65-55o) bands. This may result in a small error as an estimate of insolation at 60o N precisely, but a better estimate of the mean insolation over the band of most significant ice sheet melt. The calculated insolation difference for July at 65oN from the insolation minimum are for 0 Kybp, 9 Kybp and 15 Kybp are respectively, 7.4 W/m^2, 51.5 W/m^2 and 29.2 W/m^2.
2) tatelyle assumes peak montly mean daily insolation over the entire melt season.
As noted, tatelyle's estimate of a 90 W/m2 insolation increase was based on July at 65o N. The insolation increase in June and August, let alone April and October, is less. As a result the mean daily summer insolation change for 65o N for LGM to Holocene maximum (20-9 Kybp) is 44.1 W/m^2, 10% less than the July value.
Of course, tatelyle challenges the use of only summer insolation. He considers it obvious that the melt season lasts 40% of the year. That is far from obvious to me. I suspect the melt season depends on latitude, altitude and local conditions. That quibble aside, in Greenland melt occurs between April and October, with the vast majority of the melt occuring in the summer months of June-August. To estimate a melt season, I note that Peter Huybers (2006) notes prior reports that melt is ice ablation correlates with positive degree days, ie, days when the 2 M air temperature rises above 0 degrees. He shows that positive degree days are highly correlated with days when TOA insolation exceeds 275 W/m^2. Using that relationship, I use a melt season consisting of any month in which mean daily insolation averages 275 W/m^2 or more - which turns out to be April-August. So defined, the TOA insolation difference averaged over the melt season at 65o N turns out to be 2.4 W/m^2 between LGM and present (20-0 Kybp), 32.4 W/m^2 for LGM to Holocene peak (20-9 Kybp), and 25.7 W/m^2 for LGM to onset of rapid deglaciation (20-15 Kybp).
3) tatelyle ignores the effect of albedo.
Being as fair as possible to tatelyle, the 32.4 W/m^2 difference between insolation minimum and maximum is the value he wanted to compute, and is just over his revised estimate of 32 W/m^2. It might appear that his inaccurate calculation has cancelled out the effect of his theoretical errors. This would be the case were it not for his most fundamental error - ignoring albedo.
Solar forcing equals TOA insolation - reflected shortwave radiation at TOA. Therefore, to calculate the equivalent of the CO2 forcing, tatelyle needs to adjust the TOA insolation for albedo. Because in this instance we are examining only the impact over the ice sheets durring the glaciation, and as we are examining the no feedback case (both from tatelyle's hypothesis and because we are examining the regional forcing), the appropriate albedo is ice sheet albedo at the start of the melt season. For Greenland that is 0.835. Adjusting for Albedo then gives us a melt season 65o N mean daily insolation of 0.4 W/m^2 for the LGM to present (20-0 Kybp), 5.3 W/m^2 for LGM to peak insolation (20-9 Kybp), and 4.2 W/m^2 for LGM to onset of rapid deglaciation (20-15 Kybp). These are overestimates of the relevant values because the calculation does not include the impact of cloud cover, which further reduces the effective mean daily insolation at the top of the ice sheet.
These values (although upper limits) are the best comparitors to tatelyles calculated value of 32 W/m^2. In particular, the difference between the LGM and the onset of rapid deglaciation probably represents the best estimate of the upper limit on the necessary regional insolation forcing change to initiate deglaciation. Based on that, tatelyle overestimates it by 660%.
Note, this is for the change in regional forcing directly impacting on the icesheet. For TOA insolation, his estimate is reasonable, and for global forcing (ie, the most relevant value), the true figure is approximately 1.3 W/m^2 over the melt season and 0.5 W/m^2 averaged over the full years forcing.
-
PhilippeChantreau at 17:33 PM on 12 October 2015NASA Retirees Appeal to their Own Lack of Climate Authority
"Character assassination"? Really? Go read WUWT and see how puny we are in that department. Over there, calls for hanging scientists are routine. Posturing is truly better described by rep. Inhoffe bringing a snow ball in the House to argue that climate change isn't happening. That's posturing. So is passing laws that banned public servants from using certain words that pertain to rising sea level because the legislators don't like these words and it's bad for seaside real estate business. Seems you have your scales skewed.
-
PhilippeChantreau at 17:13 PM on 12 October 2015NASA Retirees Appeal to their Own Lack of Climate Authority
We are erring on the side of off-topic but since moderators are allowing, I'll follow up. Your humingbird analogy is inappropriate and you qualification of car accident is equally wrong. You don't understand the initial analogy because because you fail to graps the significance of the risk at the scale of an individual vs a population.
You say car accidents are a routine every day occurrence. They are at the level of a population, but not at that of the individual experiencing the accident. For the immense majority of people involved in accidents, they are an extremely rare occurrence. Some find them rare enough that they are confident that it won't happen to them and dispense of insurance. Most people, however do get insurance, not because of the likelihood of the event, but because of dangers involved. For any given person, car accidents are not routine at all. They cause trauma, physical and psychological. They can have very serious consequences, often life changing, and always put a nasty wrench in people's plans.
The initial analogy was about the thought process of an individual assessing his risk and need for an insurance. The probability of the occurrence is low but the implications of it are very significant. Furthermore, the probability is not that low if one looks at the actual numbers, and any individual knows the results of accidents. Therefore, purchasing the insurance is a no-brainer.
At the level of the world population, we need to do the same risk assessment. The people who recently died in floods in the SE US and in France certainly would agree that risk assessment is in order if they could still do so. The fact that most of the New Orleans levees were topped over during Kathrina, the enormous storm surge leading to seawater flooding the NY subway during Sandy, the heat wave in Moscow, the fires in Australia, all these are very real and were either predicted by scientists, or are fully consistent with the theory. We have already reached the level of a continuous background of climate related adverse events. People do die from them and the damages total in the billions.
This makes your hummingbird analogy even more wrong than its sheer absurdity could. We're not talking about a remote risk, dependent on a far fecthed theory at all. We're talking about risk that has already materialized as predicted. We're talking about occurrences happening on a regular basis. How many 1000 years type of events do we need in a decade year for you to understand? How many in a single year?
Your "extreme" mumbo jumbo is completely irrelevant. Responding to future risks identical to some that have already materialized does not constitute extreme risk aversion by any stretch of the imagination. Hence the question about what is extreme, which was in fact entirely justified.
To get back on topic, you still have not come close to demonstrating that the NASA retirees that are the subject of the OP have done a true in-depth examination of the science.
-
Tom Curtis at 17:08 PM on 12 October 2015NASA Retirees Appeal to their Own Lack of Climate Authority
zoo58 @62:
"How does one decide whether someone's opinion matters or not?"
1) Your opinion does not matter if you set unrealizable standards for those whose opinion you disagree with. Thus when the letter writers write:
"We, the undersigned, respectfully request that NASA and the Goddard Institute for Space Studies (GISS) refrain from including unproven remarks in public releases and websites."
if by "unproven" they mean lacking deductive proof, they set up an unrealistic standard in that no scientific statement can possibly be proved deductively. Of course, if they are not setting up so unrealistic a standard, NASA already complies with their request in that their public statements on climate are back by comprehensive evidence.
2) Your opinion does not matter if your argument depends essentially on applying a restrictive standard on those you disagree with that you do not accept for yourself. On this count, the NASA contrarian signatories clearly fail. They make numerous claims regarding matters of fact in the letter, and provide not even a single refference in support, let alone "proof". They expect us to take their claim, for example, that NASA's public statements on climate amount to "unbridled advocacy of CO2" on their authority alone. They do not even cite their qualifications to prove their authority, so that we are expected to accept mere interns (Thomas Wysmuller) as authorative simply because they were employed by NASA.
In stark contrast, the public statements by NASA are backed be extensive peer reviewed literature - much of which is available free to the public on the NASA website.
Indeed, it is plain that you also do not accept the standard demanded of NASA. You write, "As distinguished people with related skills and education who have attempted to conduct a non-biased and in-depth examination of the evidence ..." but offer not evidence that all or any have either or both of "related skills and education", that they are "unbiased", or that they have conducted any review of the evidence. Nor will you be able to for such a review is not to be found from most (if not all) of the authors of the letter; and description of NASA's statements as "advocacy" and "extreme" shows without doubt that they are biased.
-
Tom Curtis at 16:24 PM on 12 October 2015NASA Retirees Appeal to their Own Lack of Climate Authority
zoo58 @71, in your comment @68 you write:
"The risk analysis involved in something as big as climate change (it truly impacts everything on this planet) is really, truly, extremely complex."
If, as you insist, we shoud interpret your earlier use of "extreme" ("Risk aversion taken to the extreme...") to mean "utter extreme", we must do the same here. Transparently that is not the case, however. Climate, while extremely complex, is not so complex as the action of the brain, the interaction of genes to generate life, or even sociology or psychology. Yet surely your second use emphasises the extremity of the case far more than your first.
We can take home from this that you are mistaken in claiming that your first usage is "...not according to my definition, according to the standard definition of the term...", as your second usage is valid but does not comply with your interpretation of the definition. Your inconsistent usage shows that you do not in fact believe your extremist interpretation of the dictionary definition.
Regardless of your usage, of course, it could simply be pointed out that you have taken one of five senses of the word "extreme" (the fourth sense given) and reified to to be the only usage of the term (at least when it suites your argument). That is, "Risk aversion taken to the extreme" need only mean risk aversion taken to "great or exaggerated lengths" (sense 1b) or risk aversion "exceeding the ordinary, usual, or expected" lengths (sense 1c).
In scientific terms the later woud be glossed as "risk aversion in the upper 5%ile of the population" and the amount of risk aversion needed would be dependent on the distribution of risk aversion in the population. As it is not true that 5% of the population is so risk averse that they never do anything, that also means your original claim is not true.
-
Tom Curtis at 16:04 PM on 12 October 20152015: Still No Let Up in Ocean Warming
Most of bozza's comments strike me as being either meaningless, or nonsensical. As pure noise, obstructing debate rather than aiding it. His latest seams to indicate that:
1) He does not recognize that there is an SI unit for temperature (also measured in degrees); and that
2) He mistakenly thinks that Joules are a unit of temperature.
Or, of course, it may just be pure nonsense where his act of using vagueness to maskerade as profundity is caught out again.
-
bozzza at 15:57 PM on 12 October 20152015: Still No Let Up in Ocean Warming
@ 8,
..look up SI units and you will discover you are incorrect!
-
bozzza at 15:33 PM on 12 October 20152015: Still No Let Up in Ocean Warming
Dacama: science is all about definitions.
In a very real sense science- and thus the whole world- is based on consensus and it is called, "nomenclature".
-
zoo58 at 14:02 PM on 12 October 2015NASA Retirees Appeal to their Own Lack of Climate Authority
@DSL #69
No, not according to my definition, according to the standard definition of the term that you'll find in the dictionary.
1
a : existing in a very high degree
b : going to great or exaggerated lengths : radical
c : exceeding the ordinary, usual, or expected
2
archaic : last
3
: situated at the farthest possible point from a center
4
a : most advanced or thoroughgoing
b : maximum
5
a : of, relating to, or being an outdoor activity or a form of a sport (as skiing) that involves an unusually high degree of physical risk
b : involved in an extreme sportSee: http://www.merriam-webster.com/dictionary/extreme
Taken to "the extreme" means taken to the "maximum" or farthest possible extent.
Comprendes?
Moderator Response:[JH] If you persist in lacing your comments with inflamatory remarks, they will be deleted.
Please note that posting comments here at SkS is a privilege, not a right. This privilege can be rescinded if the posting individual treats adherence to the Comments Policy as optional, rather than the mandatory condition of participating in this online forum.
Please take the time to review the policy and ensure future comments are in full compliance with it. Thanks for your understanding and compliance in this matter.
-
michael sweet at 11:42 AM on 12 October 2015NASA Retirees Appeal to their Own Lack of Climate Authority
Zoo58,
I notice a complete absence of scientific references in your diatribes about AGW. Can you cite a source to support your absurd claim that scientists do not know the damages that AGW will cause if a business as usual case? Please cite the IPCC report to support your wild, baseless claims. Please propose a reason for the 1000 year floods last week in the USA if AGW is not influencing weather. You must account for the increase in flooding rains in the USA and the drought in California at the same time. Claims of wild coincidence do not hold water, provide a real explaination. These effects were projected in advance by the scientists who study GW.
This is a scientific blog. Posters are required to cite reliable sources to support their claims. You have completely failed to cite any sources, even unreliable ones. If you want to convince people that your claims have merit you need to start citing data.
Please no more absurd claims about humming birds.
-
scaddenp at 11:40 AM on 12 October 20152015: Still No Let Up in Ocean Warming
Forcings - if earth system is in equilibrium, (energy in = energy out), then 30-year temperature trend would be flat and the variations you see are those due to the uneven heating of a mostly water-covered planet. Forcings are a way of expressing perturbations to this energy balance - usually expressed as top-of-atmosphere energy fluxes, as if due to change in solar radiance. eg a reduction of the solar output, increased albedo due to land-use change, or volcanic dust sheilding are examples of negative forcings. Increases in GHG are positive forcings . Under the "resources" menu, there is a climate glossary for looking up terms. Here you find the formal definition: viz
"Radiative forcing is the change in the net, downward minus upward, irradiance (expressed in W m–2) at the tropopause due to a change in an external driver of climate change, such as, for example, a change in the concentration of carbon dioxide or the output of the Sun. Radiative forcing is computed with all tropospheric properties held fixed at their unperturbed values, and after allowing for stratospheric temperatures, if perturbed, to readjust to radiative-dynamical equilibrium. Radiative forcing is called instantaneous if no change in stratospheric temperature is accounted for. For the purposes of this report, radiative forcing is further defined as the change relative to the year 1750 and, unless otherwise noted, refers to a global and annual average value. Radiative forcing is not to be confused with cloud radiative forcing, a similar terminology for describing an unrelated measure of the impact of clouds on the irradiance at the top of the atmosphere."
-
dacama at 11:11 AM on 12 October 20152015: Still No Let Up in Ocean Warming
thanks for your time this evening... I will be back reading this site again later this week.
-
dacama at 10:53 AM on 12 October 20152015: Still No Let Up in Ocean Warming
I do not understand the expression "forcings." Would the following expression work too: "More precisely, caused by the net impact of natural and anthropogenic..."
-
scaddenp at 10:45 AM on 12 October 20152015: Still No Let Up in Ocean Warming
"the energy imbalance caused by excessive CO2 production?"
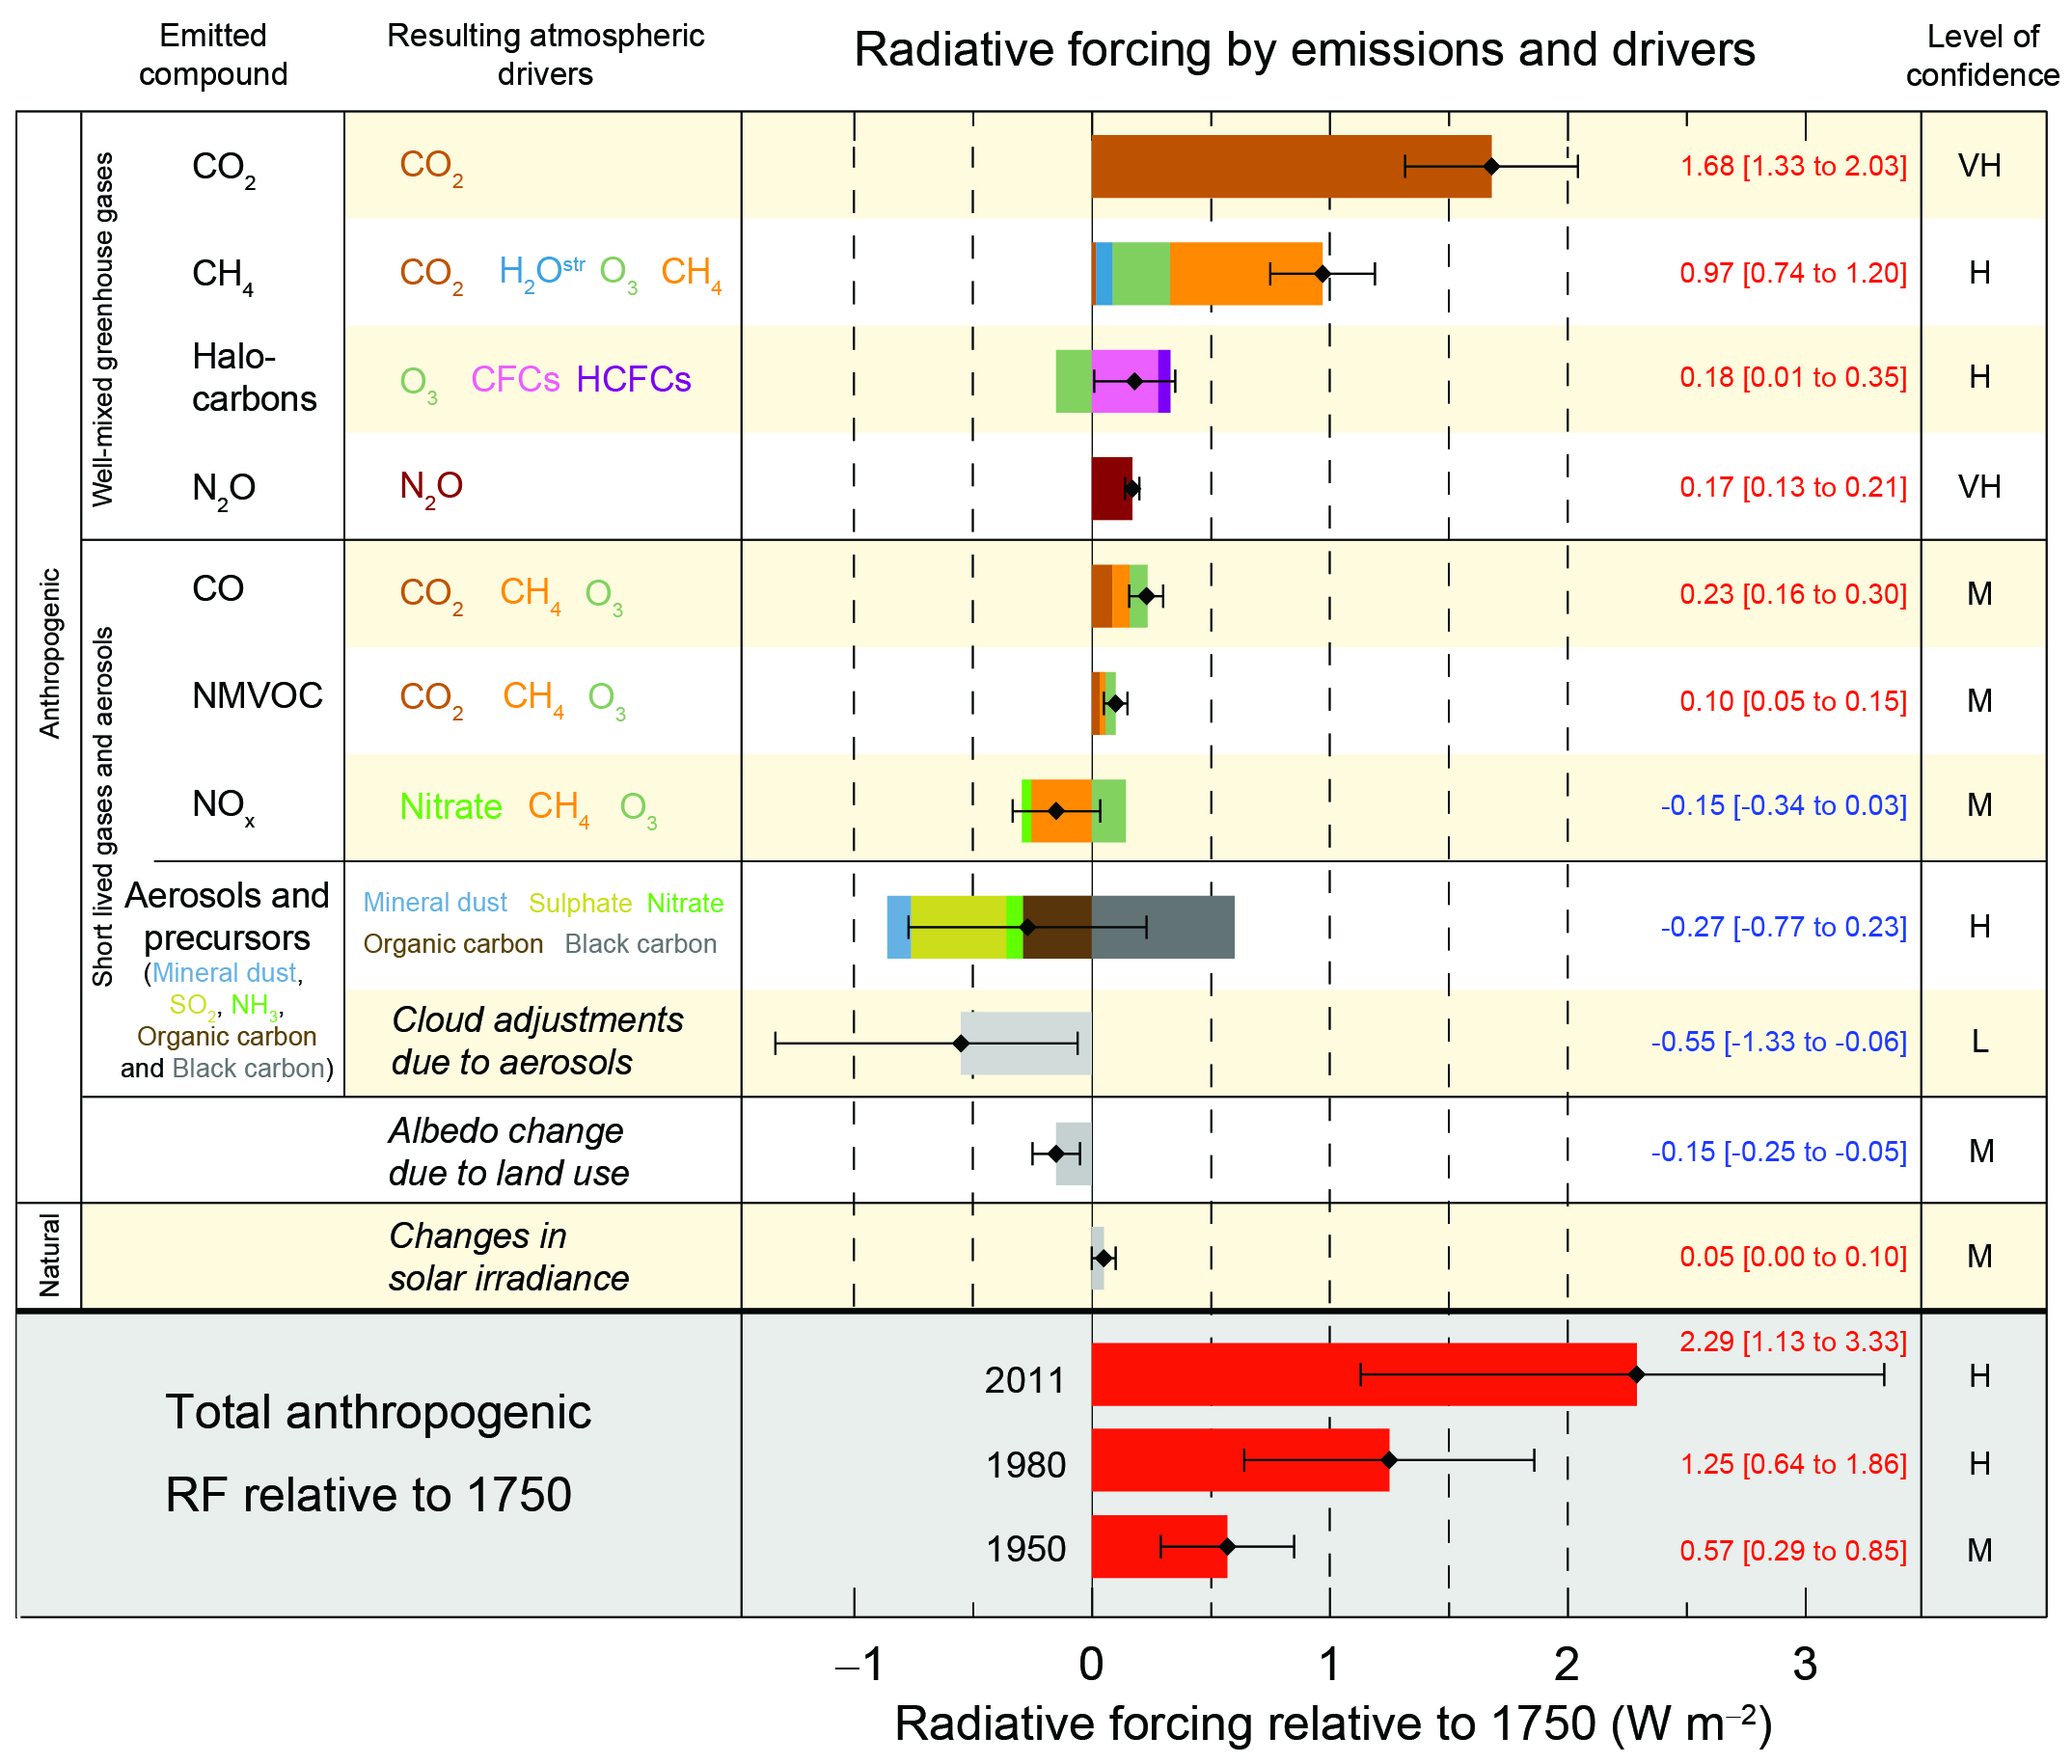
More precisely, caused by the net change in forcings, natural and anthropogenic, of which GHG, especially CO2, is the biggest component.
See this graph for the detail.
-
dacama at 10:35 AM on 12 October 20152015: Still No Let Up in Ocean Warming
Ok to #14...and thank you for your time.
-
dacama at 10:30 AM on 12 October 20152015: Still No Let Up in Ocean Warming
the energy imbalance caused by excessive CO2 production?
-
scaddenp at 10:26 AM on 12 October 20152015: Still No Let Up in Ocean Warming
"The oceans held heat energy before 1985, so why the zero on the y axis and what difference does it make?"
The OHC is an anomaly measurement. (An absolute measurement doesnt make a lot of sense). So what is measured is change of temperature since 1985 (or whatever the baseline is - I dont remember),and that is then converted to change in the amount of energy stored. Ie 17E22 Joules isnt the total energy stored in oceans (whatever that would mean), but the amount that has accumulated in the oceans since 1985.
-
scaddenp at 10:20 AM on 12 October 20152015: Still No Let Up in Ocean Warming
That is 0.09C averaged over all oceans down to 2km deep. (That amount of energy stored in the atmosphere instead of ocean would make us a fireball). Now this does not mean that oceans are going to boil anytime soon but then no one said they would. The IPCC reports detail the implications of continued temperature rise.
What is does do is confirm the energy inbalance and that it is at a rate consistent with calculated change in climate forcings. It means that earth will continue to warm till the energy does balance. The measure is interesting too because surface temperatures (where we live) are subject to a lot of internal variability (you dont need to transfer very much heat from ocean to atmosphere to warm up surface temperatures a lot as in say an El Nino) but the ocean heat content is a much better, less variable, indicator of the overall energy balance.
-
dacama at 10:13 AM on 12 October 20152015: Still No Let Up in Ocean Warming
Ok, I now understand that heat is energy and this small increase in temp means a lot of energy when spread over the entire ocean. The oceans held heat energy before 1985, so why the zero on the y axis and what difference does it make?
-
dacama at 10:01 AM on 12 October 20152015: Still No Let Up in Ocean Warming
In Levitus et al., 2012 it says in section 3 that the ocean temp has increased 0.09C since 1995. To the layman like myself I look at that number and say “what’s the big deal?” Anyone want to help me understand why it is a big deal?
-
scaddenp at 09:49 AM on 12 October 20152015: Still No Let Up in Ocean Warming
Appreciate that but temperature and energy are not same thing. Hence the "hiroshima bombs", Earthquakes, dynamite etc in the heat widget to the right of the screen.
-
DSL at 09:46 AM on 12 October 2015NASA Retirees Appeal to their Own Lack of Climate Authority
Zoo58: "Risk aversion taken to the extreme, as I qualified it, would indeed stop humanity from doing anything."
Oh, I get it now. According to your definition of "extreme," anyone who took risk aversion to the "extreme" would be bonkers. What, pray tell, is your definition of "extreme" risk aversion, and is anyone seriously advocating for it? -
zoo58 at 09:05 AM on 12 October 2015NASA Retirees Appeal to their Own Lack of Climate Authority
@DSL #65, @PhilippeChantreau #66
The analogy in this article is poor because one is a known, routine, predictable event that happens every day in America (a car collision), and the other a theoretical disaster scenario that we have never experienced (a rapid climate change disaster).
All analogies are limited, but this one is particularly bad because the author uses it to draw a connection between Americans buying collision insurance and Americans dramatically changing their energy sources in an attempt to avoid a theoretical problem. The difference should be obvious.
Admittedly, I struggled to think up a better analogy and picked a rather absurd one (from a scientific perspective), hastily, to try to demonstrate my point.
Perhaps a better analogy could be postulated in the area of infectious disease. I'm thinking out loud here... we know that high concentrations of humans in cities and frequent travel between them increases the danger of infectious outbreak and that an infectious outbreak could potentially dramatically harm humanity. Should humans cease to travel or cease building cities in an effort to reduce the risk of a large-scale outbreak?
You might argue "no" (I would) because we are smart enough that we can deal with infectious disease, get them under control, create vaccines or drugs, etc. Climate skeptics can argue analogously that we know enough about our world to mitigate to effects of and adapt to climate change.
I'm sure that you get my gist, so would either of you care to help think of strong analogy, rather than cut me down?
@PhilippeChantreau #66
The rest of the post is ripe with straw men, such as "stop humanity from doing anything", and indications of zoo58 lack of knowledge and understanding of the science underpinning the risk analysis he attempts to question.
Risk aversion taken to the extreme, as I qualified it, would indeed stop humanity from doing anything. There is unknown risk in every action. Scientific understanding of our world makes humans powerful. That power gives us more confidence that we can identify and deal with problems as they arise.
The risk analysis involved in something as big as climate change (it truly impacts everything on this planet) is really, truly, extremely complex. It's easy to blame others for not understanding it, but do you? What I perceive as cimate alarmists' penchant for character assassination and political posturing over elevating the discussion certainly does not inspire my confidence.
-
dacama at 08:54 AM on 12 October 20152015: Still No Let Up in Ocean Warming
found it ..thanks for the links.
-
dacama at 08:47 AM on 12 October 20152015: Still No Let Up in Ocean Warming
Most non scientist live in a degree world, not a joules world. Does that make sense?
-
scaddenp at 08:28 AM on 12 October 20152015: Still No Let Up in Ocean Warming
The OHC is derived from integration of temperature profile which of course means warmer at top. So when you ask for C, then temperature where? Or perhaps more importantly, why do you ask? If you want to how OHC is derived from ocean temperature measurement, then try this. If you want to know how accurately can you determine OHC given accuracy of measurement and float distribution, then try here with more recent discussion here.
-
dacama at 07:43 AM on 12 October 20152015: Still No Let Up in Ocean Warming
Hi, what does 17*10^22 joules mean in degress C or K?
Thank you.
-
PhilippeChantreau at 04:22 AM on 12 October 2015NASA Retirees Appeal to their Own Lack of Climate Authority
I would add that the OP appropriately disputes the fact the individuals mentioned have conducted a true "in depth" assessment of the science. I see nothing in zoo58's showing that their assessment really was in depth. In fact, it is abundantly clear from their declaration that it was not so.
-
PhilippeChantreau at 04:18 AM on 12 October 2015CO2 lags temperature
Thank you Tom, that is much more informative than Tatelyle assertions. The B,D and F graphs in the second figure of yout post are representations of what would be considered reliable ways to determine the presence of a cycle. I had no doubt that this work had been done and that a wide litterature existed on the subject. I am still wondering what is Tatelyle's basis to claim against that existing litterature, perhaps he will tell us more.
-
PhilippeChantreau at 04:01 AM on 12 October 2015NASA Retirees Appeal to their Own Lack of Climate Authority
"Theoretically, evolution could change hummingbirds into bloodthirsty killers at any moment"
This is one of the most ridiculous statements I've ever read. One ready to throw around such nonsense and in the same post comment on others' analogies being poor is almost funny. The rest of the post is ripe with straw men, such as "stop humanity from doing anything", and indications of zoo58 lack of knowledge and understanding of the science underpinning the risk analysis he attempts to question. I'm unimpressed.
-
DSL at 01:24 AM on 12 October 2015NASA Retirees Appeal to their Own Lack of Climate Authority
Zoo58: "Americans buy insurance for car collisions because they know that car collisions happen, they know how and why they happen, many have been in one before, and they wish to insure themselves against future collisions which they know with a high degree of likelihood will continue to occur."
Zoo58: "Unlike car collisions, humans do not know that anthropomorphic climate change disaster occurs, what effects it can have, or what factors primarily cause it. We haven't seen it happen before, haven't lived through it, and don't know what the best way to deal with it is. We cannot rationally insure against it because it only exists in our imagination."
The basis of your post is your claim that we don't understand how the climate works, past, present, and future. We know quite well why climate change happens. We know that it has happened in the past many times, and we know that it will happen in the future, regardless of what we're doing now. We know how the climate system works. We have direct surface measurement of the greenhouse effect. Indeed, the theory of the greenhouse effect is one of the most well-established theories science has produced. We know how our contributions to that effect are leading to an accumulation of energy within the climate system.
Just because you don't understand the science, doesn't mean the science isn't there. Perhaps you'd be more effective in arguing your position if you actually engaged the science.
-
zoo58 at 23:33 PM on 11 October 2015NASA Retirees Appeal to their Own Lack of Climate Authority
In response to the article...
This conclusion illustrates a risk management failure which is very common amongst climate contrarians. It's no different than saying "I don't think that I'll be in a car accident, so I won't purchase auto insurance." The average American has a 30% chance of being involved in a serious automobile accident in his or her lifetime, and the odds of very dangerous and damaging climate change are even higher if we continue on a business-as-usual path – in fact that is the most likely scenario.
That is a very poor analogy. Americans buy insurance for car collisions because they know that car collisions happen, they know how and why they happen, many have been in one before, and they wish to insure themselves against future collisions which they know with a high degree of likelihood will continue to occur.
Unlike car collisions, humans do not know that anthropomorphic climate change disaster occurs, what effects it can have, or what factors primarily cause it. We haven't seen it happen before, haven't lived through it, and don't know what the best way to deal with it is. We cannot rationally insure against it because it only exists in our imagination.
A more appropriate analogy would be for Americans to buy hummingbird attack insurance. Theoretically, evolution could change hummingbirds into bloodthirsty killers at any moment. One could argue that anthropomorphic changes to and pressures on our environment cause an increased rate of evolution. Alarmists could claim that the birds are just a couple genes away from devouring us. How many people do you think would buy this type of insurance? None, of course.
Climate contrarians like these NASA retirees essentially believe that the best case scenario will occur, that the net climate feedback and sensitivity will be near the low end of the possible range, and that we will be able to cope with future climate change.
This claim is false. As far as I'm aware, NASA retirees have not claimed that they believe the best case scenario will occur. On the contrary, they believe that there's insufficient evidence to determine whether the best or worst case scenario or something in the middle will occur.
This conclusion illustrates a risk management failure which is very common amongst climate contrarians. It's no different than saying "I don't think that I'll be in a car accident, so I won't purchase auto insurance." The average American has a 30% chance of being involved in a serious automobile accident in his or her lifetime, and the odds of very dangerous and damaging climate change are even higher if we continue on a business-as-usual path – in fact that is the most likely scenario.
You, on the other hand, appear to be advocating a strong risk aversion which would literally stop mankind from doing anything, if taken to the extreme, and have us walking around on tip-toes afraid of triggering disasters. You are claiming that when you don't know what will happen or whether the outcome will be positive or negative, or, generally, are afraid of change, that you should not act. Mankind would not have advanced nearly this far following such a principle.
Unfortunately, your principle is actually useless in this case since we're already in uncharted waters. It would've helped stop the industrial revolution before it began, but there's no going backwards. Sequestering carbon and building millions of windmills could be just as harmful, or even more harmful, than continuing to burn fossil fuels. Do we have enough evidence to pick one course of action over the other? Without sufficient evidence, the only difference between the two would be public perception based on political campaigning and, generally, lies: we've been told that CO2 will cause disaster, without proof, and we've been told that windmills will be good, without proof.
-
zoo58 at 22:50 PM on 11 October 2015NASA Retirees Appeal to their Own Lack of Climate Authority
@Glenn Tamblyn #46
Since the oceans are the primary source of protein for around a billion people, any decline in the biological productivity of the oceans must unavoidably lead to a reduction in available protein.
Oh really? What if the decline in biological productivity of the oceans lead to a subsequent, even greater increase in the biological productivity on land and available protein from land sources? That would result in an increase in available protein. Can you prove it impossible?
-
zoo58 at 22:47 PM on 11 October 2015NASA Retirees Appeal to their Own Lack of Climate Authority
@JasonB #36
If 20 unknown people got together and issued a report saying that they aren't convinced that global warming is a problem then nobody would pay it any attention at all. But when those same people attempt to draw attention to their report by pretending that their credentials, and therefore opinion, matter, then they are inviting people to examine those credentials to see whether their opinion really does matter.
How does one decide whether someone's opinion matters or not? It seems to me that this is far from a trivial problem.
Here are some possible criteria:
1. Their opinion matters if it is in agreement with your own.
2. Their opinion matters if their society or government has deemed them as an "expert".
3. Their opinion matters if wikipedia says that they're credible.
4. Their opinion matters if popular opinion says their opinion matters.And there are infinite other possible solutions. These ones I've outlined are actually commonly observed in practice, for better or for worse. They are all based on logical fallacies, but it's realistically not possible to hear every opinion, so we some way to be selective.
Personally, I think you've been far too harsh in your assessment of these NASA retirees. First of all, they explained in their introduction why they feel that their opinion should matter, and I tend to agree with them. As distinguished people with related skills and education who have attempted to conduct a non-biased and in-depth examination of the evidence, why should they not at least be heard? It's plausible that they could have something of value to say that hasn't been heard before, or at least that you could learn something from listening to them.
In politics, and this issue is highly political in nature, everything goes in terms of getting yourself heard, including appeal to credibility or to your ex-employer's reputation. The climate alarmists are surely guilty of as much with all the disaster scenarios they've come up with. If you're going to complain about it at all, then to be fair you ought to complain about similar behavior by those who lobby for the position that you happen to agree with.
-
Tom Curtis at 17:01 PM on 11 October 2015CO2 lags temperature
PhillipeChantreau @502, using the following image I calculated by pixel count that Antarctic temperature rose to 0 C, at succussive intervals of, 86 thousand, 91 thousand, 112 thousand and 120 thousand years ago (most ancient to most recent).

That takes us back to 400 Kya. Prior to that, interglacials are cooler, and more frequent. Using the initial -4 C line to characterize the frequency, we have intervals of 48, 24, 85, 45, 25, 34, 23, 73, 90, 92, 29, 85, 120 thousand years respectively (counting from 800 Kya). The underlined pair pair obviously show as a single cycle if we use 0 C to characterize successive cycles.
This simple count between years of particular phases is a crude method to characterize cycles as you know. If that was what we had to relly on, we would not be able to characterize the frequency of glaciations in any meaningful way. More advanced techniques show a clear dominance of the 41 Ky obliquity cycle over the last two million years (panels D and F), with the 100 Ky cycle becoming significantly more important in recent times:

Over the last 400 Ky, the 100 Ky cycle has become dominant, with the 41 Ky obliquity cycle still having a greater influence than precession cycles:

-
MA Rodger at 16:56 PM on 11 October 2015CO2 lags temperature
tatelyle @500.
Concerning your little cycling excursion, it is foolish to ignore apsidal precession which is the "difference" you say you are still "not sure about" and whose inclusion yields the net 21.6ky cycle in precession. I can't say I've ever seen a figure for the size of variation in this cycle length. (I imagine it to be small. Axial precession is 25.7+/0.4ky.) This regional/seasonal cycle is of course modulated by eccentricity that leads rise to talk of the 19ky & 23ky signals which when combined achieve the modulated ampitudes. That said, the graphic you reference @500 allows measurement of the length of the three last ice ages yielding (backward from the present) lengths of 119ky, 107ky & 88ky. I'm not sure how this squares with your measurements or with your attempts to fit climate data with the lengths of multiples of precession cycles. Your efforts in this specific matter appear to be mainly driven by what is a well-known incongruity. That is that the high levels of variation in NH insolation due to orbital precession have small climatic reactions while the low levels of variation due to global orbital eccentricity have very large climatic reactions. This finding is decades old so try not to get too bogged down in it - it is well trampled ground.
Concerning your resurrection of the incoherence you presented @498, the sentence at which I gave up all hope of identifying your meaning was "The exclusivity of NH insolation triggers strongly suggests that albedo is the key factor and the key feedback regulating Interglacials." I'm afraid that substituting the word "primary" for the word "key" doesn't make your meaning any clearer.
-
PhilippeChantreau at 02:37 AM on 11 October 2015Satellites show no warming in the troposphere
They'll just start a new "pause" in 2015, no worries. It's not like their audience is critical anyway. You can say anything to someone who wants to believe a certain way, as long as it goes that way, no matter how unreal.
-
PhilippeChantreau at 02:15 AM on 11 October 2015CO2 lags temperature
That's a lot of different cycles mentioned here. What are the statistical criteria to establish the existence of a cycle? What method did you use to identify the cycles? Does this fine cycle discrimination have any reference in the scientific litterature?
-
tatelyle at 21:16 PM on 10 October 2015CO2 lags temperature
>>Rodger
>>I am assuming that you have not yourself "counted
>>the years." For my own part, I have in the past been
>>content to take the word of others for the recent ice
>>age cycles being 100,000 years long, this being a
>>well-known and unchallenged finding.If you look at post 479, you will see that the gap between recent interglacials is 109 k years, not 100 k years. And this is supported by this alternate graphic of the Vostok data. And here you will see two 109 k year cycles,* preceded by two 88 k year cycles:**
https://i1.wp.com/www.brighton73.freeserve.co.uk/gw/paleo/400000yearslarge.gif
Quite clearly, the Interglacials are following the Milankovitch warming in the NH, with intervals of 4 cycles and 5 cycles (for the last two cycles).
* A 113 k cycle, and a 109 k cycle.
** The difference from my previous post is caused by some confusion over the length of the precessional cycle. It is given as 25,800 years in many texts, but if you look at these graphs they clearly show a 22,000 year cycle. I am not sure why the difference. I simply counted the precessional cycles, rather than counting the years. But if the precessional cycle really is 22,000 years, which is not how I understood it, then the Ice Age cycle lengths are shorter, but still not equal. But there are still two different cycle lengths to Ice ages, and averaging them is not a valid methodology.
>>I am at a loss with what you mean by the
>>phrases "key factor" and "key feeback"The primary feedback. It is highly unlikely that all feedbacks are equal in effect. My point was the albedo feedbacks are probably more important than CO2 feedbacks, because Interglacials react to high latitude NH forcing. That strongly suggests that forcing and feedbacks are a result of changes in albedo, rather than a function of CO2.
>>The full mix of forcings that result in ice age cycles is not
>>yet fully determined which makes any informed response
>>to you a tad harder still.I thought the 'science was settled'?
Moderator Response:[DB] Inflammatory tone snipped.
-
longjohn119 at 18:35 PM on 10 October 2015The Republican Party stands alone in climate denial
Comparing Republicans to actual Conservatives in other nations is pure folly because Republicans are Fictional Conservatives. Any notion that their ideas are Conservative is as fictional as the WMD's in Iraq ..... True Conservative Stalwart Barry Goldwater predicted and warned us about exactly what we are seeing today
Mark my word, if and when these preachers get control of the [Republican] party, and they're sure trying to do so, it's going to be a terrible damn problem. Frankly, these people frighten me. Politics and governing demand compromise. But these Christians believe they are acting in the name of God, so they can't and won't compromise. I know, I've tried to deal with them.
- Barry Goldwater, November 1994
Shortly afterward he told the Republican Leadership
"Do not associate my name with anything you do. You are extremists, and you've hurt the Republican party much more than the Democrats have."
I'm sure this will be deemed too political but you cannot solve a problem by being nice and ignoring it's cause and history
-
Tom Curtis at 17:58 PM on 10 October 20152015: Still No Let Up in Ocean Warming
uncletimbrob @4, I, on the other hand, have seen deniers use claimed assymptotic behaviour as an argument. There is the claim that Sea Surface Temperatures have an upper limit just over 30oC; and the claim that the greenhouse effect is saturated. They do not use the language of assymptotes, but clearly the idea underlies their thinking. Having said that, I do not think a vertical assymptote in OHC, that forces greater and greater increases in OHC with less and less forcing, will be appealing to deniers. Nor is if physically possible (apparently contrary to RobH @2).
-
Leslie Graham at 11:13 AM on 10 October 2015Satellites show no warming in the troposphere
Can anyone estimate when the RSS data is likely to show peak reaction to the current El Nino?
So far as I can tell, during the '98 event SST's peaked in around Nov/Dec 97 and RSS peaked around March/April. To judge from the current (9th Oct) very strong WWB west of the dateline this event is not going to peak until around Dec/Jan. So am I right in assuming that the RSS data is likely to break the '98 peak temperature record sometime around April 2016?
I'm curious as to how the denial industry will spin a new record high temperature on the RSS graph.
-
uncletimrob at 17:59 PM on 9 October 20152015: Still No Let Up in Ocean Warming
@RobH I've not seen assymptotic behavior used by conrtarians - why did you alert them to it?
-
scaddenp at 12:39 PM on 9 October 20152015: Still No Let Up in Ocean Warming
It is not an asymptote - just an illusion from noisy data. Look at the blue and black lines. Expect to see the vertical scale expand however.
-
RobH at 12:21 PM on 9 October 20152015: Still No Let Up in Ocean Warming
There is an asymptote in Figure 1 - which looks incredibly scary. Would any of the experts monitoring this site provide comment?
-
michael sweet at 09:43 AM on 9 October 2015Global warming's one-two punch: extreme heat and drought
Kanon,
Most water cycles through the weather system in a few weeks. Temperature changes are really a decadal change (or longer) for a significant effect. The water will be able to stay in equilibrium with the temperature.
We are still likely to see many unexpected changes in the weather system as AGW progresses.
-
XRAY1961 at 03:18 AM on 9 October 2015Skeptical Science reader survey - thanks for your feedback!
Thank you for the update. I appreciate the direct answer to my question in the survey regarding updates to the rebuttals and I look forward to seeing the updated information.
-
kanon at 01:05 AM on 9 October 2015Global warming's one-two punch: extreme heat and drought
Is there a delay effect where higher temperature reduces rainfall while net evaporation increases due to a higher saturation point? In other words, could we have a period of drought while the water vapor increases and then a new precipitation pattern is formed? Thanks
-
MA Rodger at 23:34 PM on 8 October 2015CO2 lags temperature
tatelyle @498.
Thank you for your response to #495. It is always refreshing to meet new ideas.
I am assuming that you have not yourself "counted the years." For my own part, I have in the past been content to take the word of others for the recent ice age cycles being 100,000 years long, this being a well-known and unchallenged finding. Thus your contrary assertion would certainly tumble much scientific work, for example, Abe-Ouchi et al (2013) which is titled "Insolation-driven 100,000-year glacial cycles and hysteresis of ice-sheet volume." That is to say, your assertion would certainly tumble such work if your assertion were based on a shred of truth. So I did some measuring. I see no evidence for a 102ky/128ky cycle. My measurements are cursory but I feel they are adequate. They show cycles in orbital eccentricity to average 97ky(s.d. 7ky) and the ice age cycles to average 100ky(s.d. 10ky). I conclude that your bold assertion "equalls" wrong presumption.
I would be interested to learn why you assert "There are always greater and lesser feedbacks." Certainly, as a general rule systems are driven by simple mechanisms rather than complex ones but it is well known that 'general rules' do not apply "always".
Sadly, the remainder of your comment tumbles into incoherence. I am, for instance at a loss with what you mean by the phrases "key factor" and "key feeback" or what you mean by 'regulating interglacials.' You rely on a finding of your own calculation (presented less than confidently "correct me if I am wrong" @494 ) but you may have already noted @499 that I refute that "back of a fag-packet calculation"@494. Indeed (and here adding substance to the moderation Response@494), within the ice age dynamics it would be a surprise if any realistic calculation of Δ(NH ice albedo forcing) were greatly different to the Δ(global ice albedo forcing), which is the value presented by Hansen & Sato (2012): a surprise as all here do appear in agreement that these two quantities are effectively equivalent. The other 'back of a fag-packet calculation' you present (@498) is more of a mystery despite the list of assumptions provided. It is not at all clear by what means you convert peak 65ºN Milankovitch insolation figures for July into a figure for "over the whole interglacial" or indeed how you define that term "over the whole interglacial". I think these exemplars of the error & the lack of precision that you have managed to entwine together @498 adequately illustrate the level of incoherence @498.
To paraphrase my comment @492 - You create bizarre answers but that is because you appear set on answers that are simpler than the situation merits. Do also bear in mind that the full mix of forcings that result in ice age cycles is not yet fully determined which makes any informed response to you a tad harder still.
-
uncletimrob at 17:56 PM on 8 October 20152015: Still No Let Up in Ocean Warming
Oh God, I can just see the comments of the contrarians on those graphs! And, I'll bet I can tell anyone which parts of the graphs will be selected to show that "the books have been cooked' or some such rubbish
Anyway back to normality - thanks for an informative post
Tim
Prev 537 538 539 540 541 542 543 544 545 546 547 548 549 550 551 552 Next


