


 Arguments


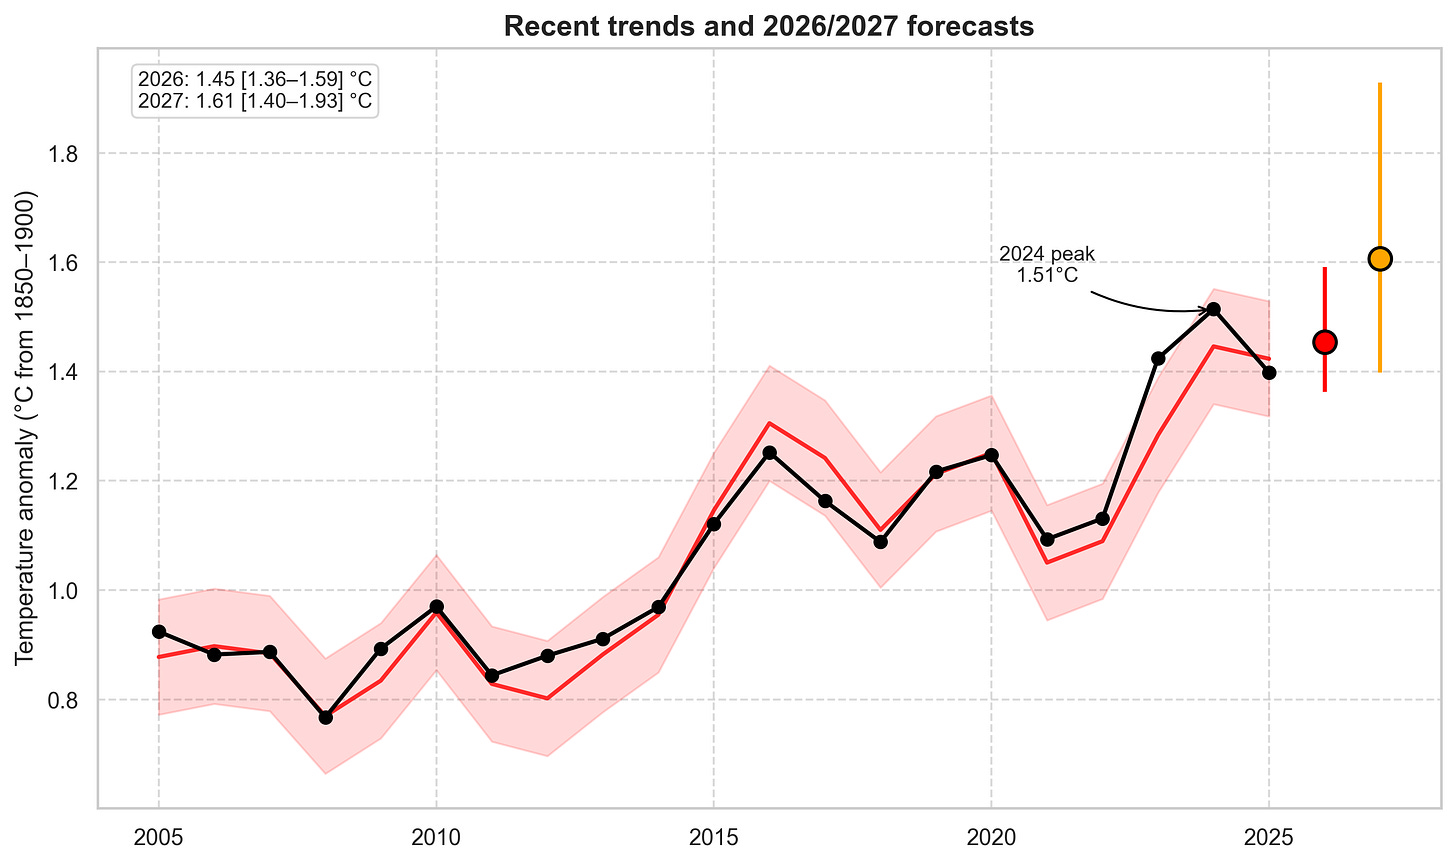
Higher warming predictions for 2026 and 2027
Posted on 13 May 2026 by Zeke Hausfather
This is a re-post from The Climate Brink
Back in December I provided some initial projections of where both 2026 and 2027 global mean surface temperatures might end up.
A lot has happened since then. We’ve gotten the first three months of data in for 20261 (and have a good sense of where April 2026 will end up in reanalysis data – see our Climate Dashboard for daily updates).
More importantly, models are converging on a doozy of an El Niño event developing in the latter part of 2026, with the latest multi-model median projection of a peak anomaly of 2.7C in the ENSO3.4 region of the tropical Pacific. While the prediction remains uncertain (we remain within the “spring predictability barrier” when its historically hard to predict ENSO2 development), this would put the 2026/2027 roughly on par with the “super” El Niño the world experienced in 2015/2016.
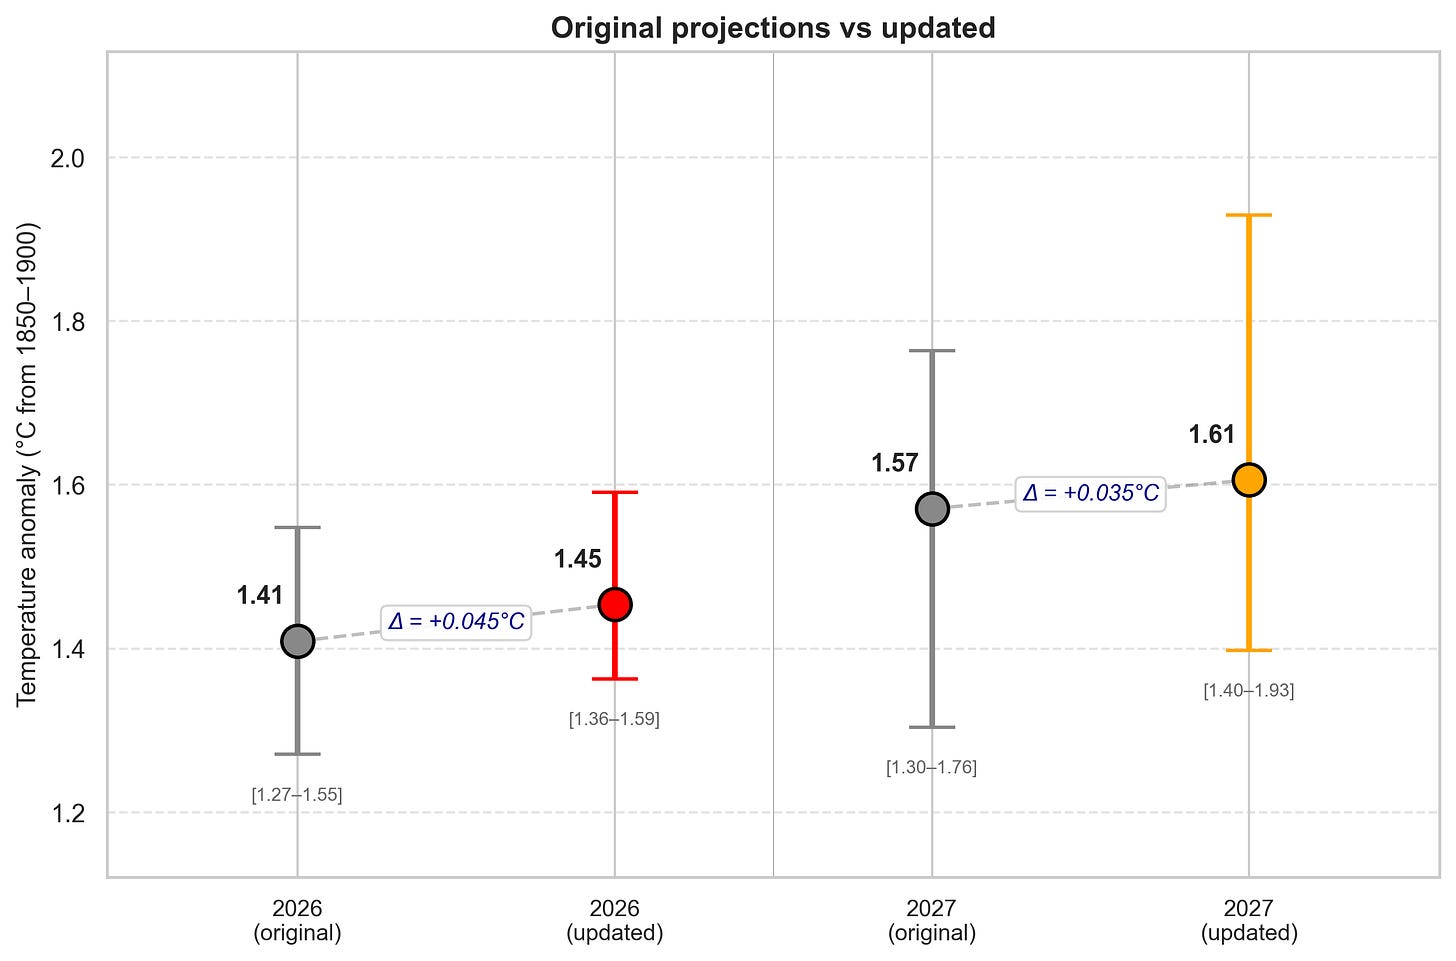
I’ve updated the models I use for both my 2026 and 2027 projections. I’ll go into the gory methodological details shortly, but the headline numbers are in the figure below: the estimate for 2026 has risen from 1.41C (with a range of 1.27C to 1.55C) to 1.46C (1.36C to 1.59C). The 2027 estimate has similarly increased from 1.57C (1.3C to 1.76C) to 1.61C (1.4C to 1.93C).
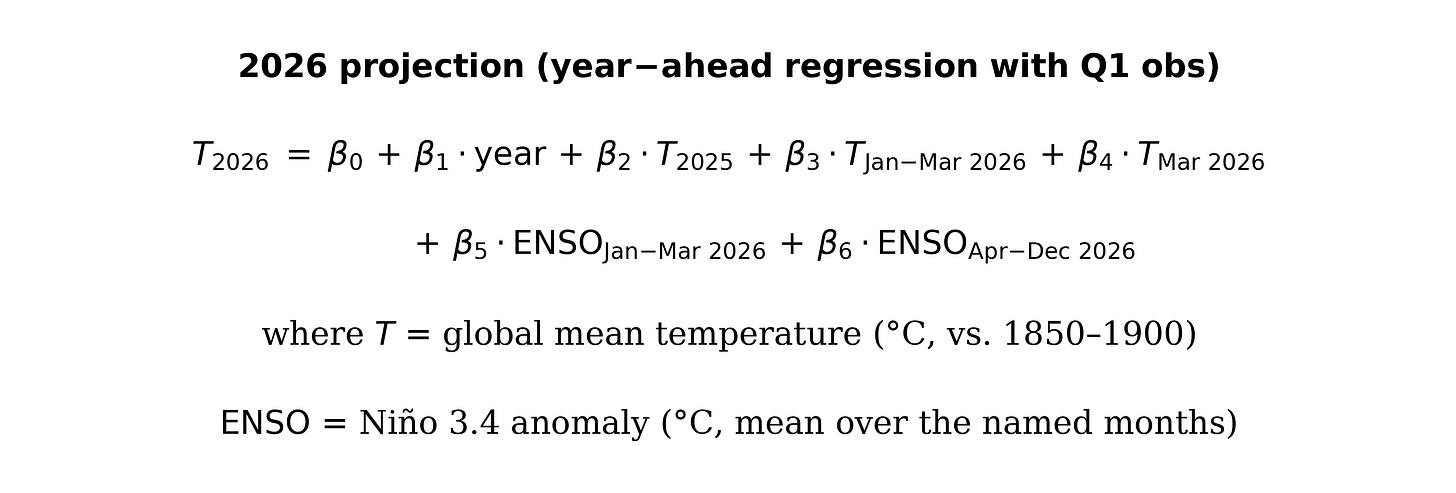
So what changed? Before the start of the year I was using a pretty simple regression model. It estimate what the annual temperature anomaly would be based on the prior year’s anomaly, the last month of the prior year, the predicted ENSO state over the next three months, as well as a year count (and year count squared) to reflect linear and non-linear aspects of the trend since 1970.
I’ve updated this to use the equation below, which includes the year count, prior year’s temperature anomaly, the anomaly over the year to date for 2026 (currently Jan-Mar), the latest month, the observed ENSO state over the year to date, and the forecasted ENSO state over the remainder of the year.3 The uncertainty in the 2026 prediction also accounts for the uncertainty in the ENSO forecast using a Monte Carlo sampling approach.4
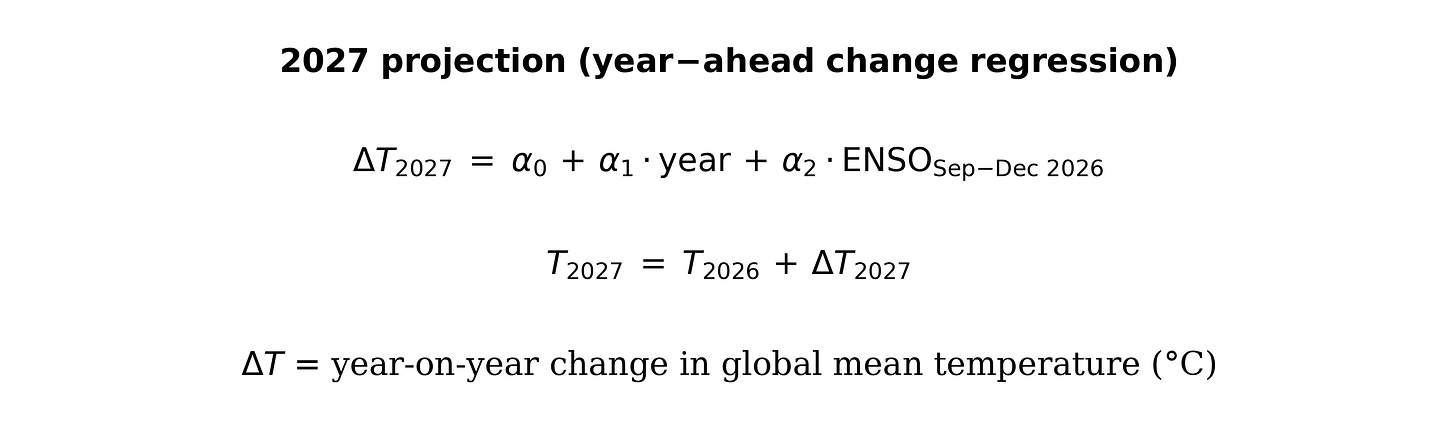
Similarly, the original 2027 calculation was pretty ad hoc; I just took the 2026 estimate and added the current warming trend (0.026C per year) that we calculated in our Forster et al 2025 paper. I then added a range of possible boosts from El Niño ranging from 0C (no El Niño develops) to 0.2C (very strong El Niño), roughly encompassing the range we’ve seen across past events.
Now I’ve converted it into a proper regression model. It calculates the expected year-over-year change in temperatures based on the year count (reflecting the trend) and the ENSO forecast for the latter part of the year (September-December, reflecting the period over which the currently developing El Niño will likely peak).5 This is then added to the 2026 estimates, with their uncertainty (and the uncertainty in future ENSO forecast) propagated through using the same Monte Carlo approach. This actually slightly increases the error bars from the original 2027 estimate, reflecting the uncertainty in both the 2026 estimate and the El Niño forecast.
One way to test how well this approach works is to see how well it predicts year-over-year temperature changes during past strong El Nino events (e.g. with a peak >2C and a Sept-Dec average of >1.5C), as shown in the figure below:
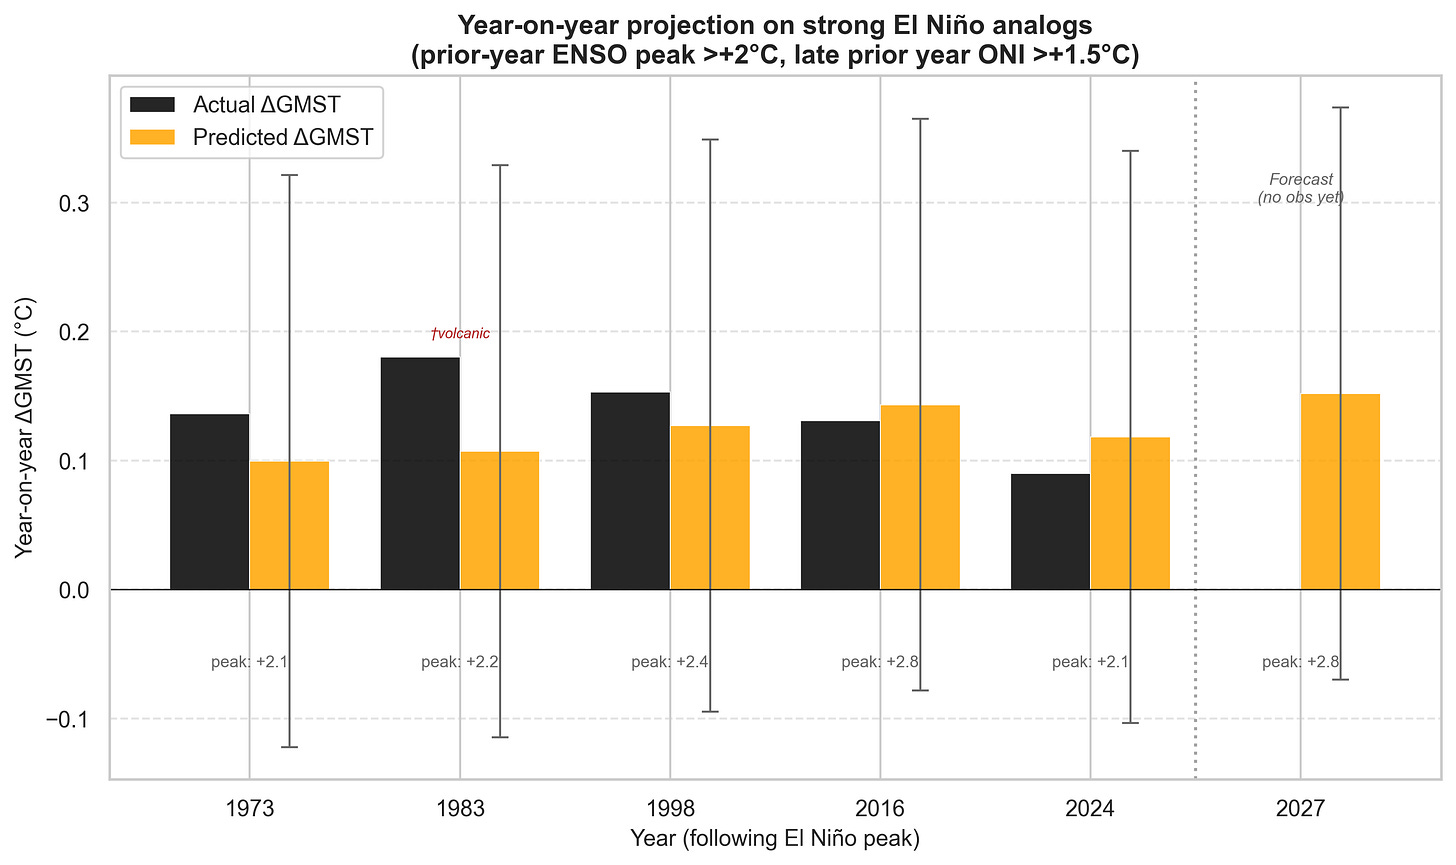
In general the model does pretty well; it slightly underestimates the year-over-year increase in 1973, 1983, and 1998, gets 2016 pretty spot on, and slightly overestimates the increase between 2023 and 2024. This is, of course, contingent on where 2026 annual temperatures end up, so a warmer 2026 in this model would result in a warmer 2027.
We can also look at how well the model “hindcasts” past years by applying the 2026 prediction model to past years using the same year-to-date and temperature and ENSO values:
Overall the development of a strong El Niño event in 2026 (and its effects on 2027 temperatures) have bumped my predictions up a bit from where they were at the start of the year.
But 2026 remains more likely than not to end up as the second warmest year on record (~56% chance), but has a non-trial chance of being the warmest year (~26%) with a somewhat larger change (34%) of being above 1.5C.
2027, by contrast, is likely (~85% chance) to be the warmest year on record and has a 88% chance to be above 1.5C. My updated estimate central estimate (1.61C) remains a bit lower than Hansen’s (1.7C),6 but its consistent with the size of the year-over-year bumps we’ve seen in past strong El Niño events.


Comments