


 Arguments


Mapped: How climate change affects extreme weather around the world
Posted on 7 July 2017 by Guest Author
This is a re-post from Carbon Brief by Roz Pidcock
In the early 2000s, a new field of climate science research emerged that began to explore the human fingerprint on extreme weather, such as floods, heatwaves, droughts and storms.
Known as “extreme event attribution”, the field has gained momentum, not only in the science world, but also in the media and public imagination because of the power it has to link the seemingly abstract concept of climate change with our own tangible experiences of the weather.
Scientists have published more than 140 studies looking at weather events around the world, from Typhoon Haiyan to the California drought. The result is mounting evidence that human activity is raising the risk of some types of extreme weather, especially those linked to heat.
Carbon Brief’s analysis suggests 63% of all extreme weather events studied to date were made more likely or more severe by human-caused climate change. Heatwaves account for nearly half of such events (46%), droughts make up 21% and heavy rainfall or floods account for 14%.
To track how the evidence on this fast-moving topic is stacking up, Carbon Brief has mapped – to the best of our knowledge – every extreme event attribution study published in a peer-reviewed journal. Our aim is to update the map periodically, as new studies are published, so that it serves as a real-time tracker for the evolving field of “extreme event attribution”.
Using the map
The map shows 143 extreme weather events across the globe for which scientists have carried out attribution studies. The different symbols show the type of extreme weather; for example, a heatwave, flood or drought. The colours tell you whether or not the attribution study found climate change had played a role in that event (see the key on the right-hand side).
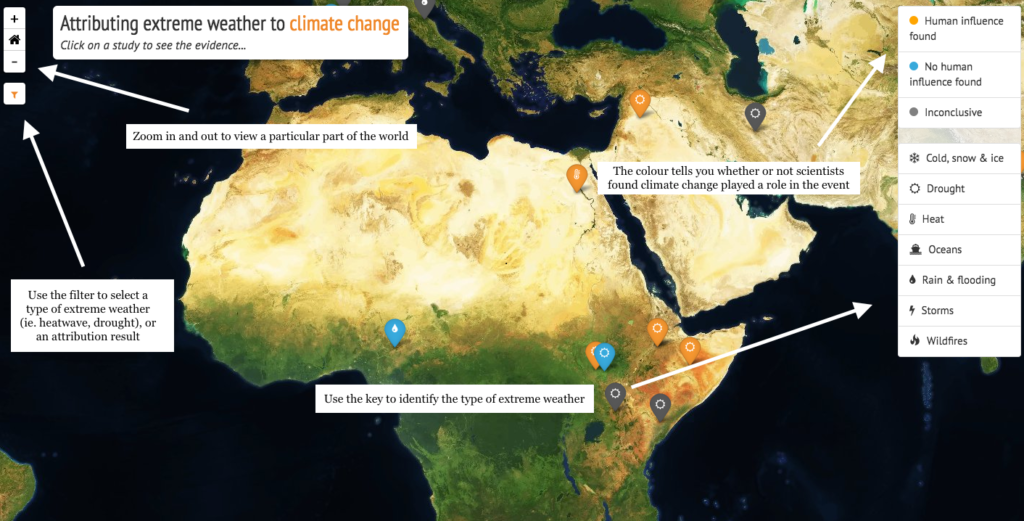
Use the plus and minus buttons in the top-left corner, or double click anywhere, to zoom in on any part of the world. Click on a weather event to reveal more information, including a quote from the original paper to summarise the findings and a link to the online version.
Using the filter on the left, you can select a specific type of weather event to look at or, for example, only those found to be influenced by climate change. Click the “house” symbol to reset.
The software we used to make the map currently only works with a Mercator projection. We acknowledge that this – like all map projections – offers a somewhat distorted view of the world.
It is important to note that the weather events scientists have studied so far are not randomly chosen. They can be high-profile events, such as Hurricane Sandy, or simply the events that occurred nearest to scientific research centres. We’ll come back to this point a little bit later on.
Weather types
The 143 weather events in the map are covered by 137 individual scientific papers. Where a single study covers multiple events in different locations, these have been separated out.
Combining the evidence over the past 20 years, the literature is heavily dominated by studies of extreme heat (34%), drought (23%) and rainfall (20%). Together, these make up more than three quarters of all published studies (77%). You can view the full list in this Google sheet.
The number of events studied has grown rapidly over time; from eight in 2012, to 34 in 2016 and 42 the year before. As you can see in the chart below, heatwaves were the most-studied weather event in 2012, 2014 and 2016. In 2013, it was rainfall, while in 2015 it was drought. You can select which types of weather to look at by clicking on the category names at the top.
Most categories of extreme weather in our analysis are self-explanatory, but “storms” and “oceans” require a bit of explanation. For ease of presentation, the “storms” category includes both tropical cyclones (i.e. hurricanes, typhoons) and extratropical storms. The “oceans” category encompasses studies looking at sea surface temperatures and the storm surges generated by Typhoon Haiyan in the Philippines and Hurricane Sandy along the eastern US seaboard.
So far, 2017 has seen a handful of extreme event attribution studies. More will come with the release of the sixth annual Bulletin of the American Meteorological Society (BAMS) later this year. More than three quarters (77%) of all studied extreme events to date have been published as part of these bumper volumes.
Human influence
Turning to the results of the attribution studies that have been done so far, scientists found that human-caused climate change has altered the likelihood or severity of an extreme weather event in 68% of cases studied. These events are coloured orange in the main map.
For the majority of events affected by climate change, the balance shifted in the same direction. That is, rising temperatures made the event in question more severe or more likely to occur. These events are represented by the dark orange in the chart below. If you click on the dark orange “slice”, you can see how heatwaves account for nearly half of such events (46%). Droughts account for 21% and rainfall for a further 14%. Return to the original chart, and do the same with the other slices to see the proportion of different weather types in each category.
In 14% of extreme weather events studied, scientists found no discernible influence from human activity. These are coloured blue in the map and the chart above. For a further 18% of events, the observational data or modelling techniques used in the study were insufficient to reach a reliable conclusion (grey in the map and pie chart).
In 5% of studied weather events, scientists found climate change had made the event less likely or less severe (pale orange in the chart above). Unsurprisingly, this category includes blizzards and extreme cold snaps. Less intuitively, perhaps, one studysuggested climate change had lessened the chances of prolonged heavy rain in September in Northeast Colorado. Another found rising temperature has made agricultural drought in California less likely.
Drought is complicated, as we’ll come to in a moment. Briefly, though, it’s worth noting that four other studies looking at different aspects of the California drought foundclimate change had played a role. Two found no discernible link (pdf, p7-15) while one was inconclusive (pdf, p3).
To dig deeper into this increasingly nuanced picture, we’ll now turn to the evidence for the three most-studied types of extreme weather – heatwaves, heavy rain and droughts. We’ll also explore some of the main issues in event attribution and where the field as a whole is heading.
Heatwaves
Of the 48 attribution studies that have looked at extreme heat around the world, 85% found that climate change had made an event of that kind more likely or more severe. This means a bigger proportion of studied heatwaves have been altered by climate change than any other studied type of weather.
One study suggests that the Korean heatwave in the summer of 2013 had become 10 times more likely due to climate change, for example (pdf, p48). Only one study on extreme heat didn’t find a role for climate change – an analysis of the Russian heatwave in 2010.
The most studied region for heatwaves in the literature is Australia, with nearly a quarter of heat-related attribution studies (24%) dedicated to it. All but one of the 12 studies on Australian heatwaves found climate change played a role. It’s worth noting, however, that the twelfth study was inconclusive for the city of Melbourne in southeast Australia, but the authors did detect a human influence on extreme heat just up the coast in Adelaide (pdf, p145).
This raises a few important points. First, finding that climate change contributed to an event is not the same as saying it caused that event. Attribution is about working out if the chance of a particular event happening now is different from what it would be in a world that wasn’t warming.
A useful analogy – as explained in the first BAMS report in 2012 – is of a baseball player who starts taking steroids. If the player begins hitting 20% more home runs than before, you can’t know for sure whether a particular home run is because of the steroids or the player’s spontaneous skill. But you can say how the steroids have altered the likelihood that the player hits a home run, by comparing their current and historical performances. As the report put it:
“Given that steroids have resulted in a 20% increased chance that any particular swing of the player’s bat results in a home run, you would be able to make an attribution statement that, all other things being equal, steroid use had increased the probability of that particular occurrence by 20%.”
Another important point is that in cases where attribution science tells us that climate change is making a given type of extreme weather more likely, it does not necessarily follow that the chance of experiencing that kind of weather gets incrementally higher each year. Natural variability means that we should still expect to see ups and downs from one case to another.
Finally, there is usually a level of confidence attached to attribution results. So, while two studies might both find a role for human influence in a given weather event, the signal may be stronger for one than the other. For the purposes of this analysis, we have not distinguished between high- and low-confidence results, but you can click through to the study for more details.
Heavy rain and flooding
Of the 29 studies to look at heavy rainfall and flooding, 45% found human activity had made the event more likely or more severe – a far smaller proportion than for heat-related studies.
Only one study found that climate change had made the whole event less likely to occur – the aforementioned paper on heavy rainfall in northeast Colorado. Of the remaining studies on heavy rainfall, 28% found no evidence of a link to climate change while 24% were inconclusive.
That there is a more divided set of results for extreme rainfall than for heatwaves could suggest several things. In some cases, limited data might make it difficult to detect a clear “signal” of climate change above the “noise” of weather considered normal for a particular region. In other cases, an inconclusive result could reflect the fact that rainfall and flooding events are inherently more complex than heatwaves, with many ways for natural variability to play a role. Human factors, such as land use and drainage, also play a part in whether heavy rain leads to flooding.
Take the UK, for example. While one study found climate change had increased the risk of floods in England and Wales in Autumn 2000 by at least 20% (and even up to 90%), another found little influence on summer rainfall in 2012 (pdf, p36).
This raises another important point. When it comes to interpreting the results of event attribution studies, it matters what the question is. For example, a 2013 study asked whether recent wet summers in northwestern European were a response to retreating Arctic sea ice (pdf, p32). The answer from the study was “no”. But, as a foreword from that year’s BAMs report explained:
“Given the numerous ways climate change could influence precipitation in this region, a ‘no’ result for the role of Arctic sea ice should not be interpreted as an absence of any role at all for climate change.”
Another example is the Russian heatwave in 2010. One study looking at the severity of the event did not find a role for climate change. Yet another one, that did find an influence, looked at the likelihood. Dr Friederike Otto, deputy director of the Environmental Change Institute at the University of Oxford and author of a study reconciling the two papers, tells Carbon Brief:
“The studies thus only appear to be contradictory, but are in fact complementary.”
As well as leading to a warmer climate overall, rising temperatures affect circulation patterns. These, in turn, affect where it rains and at what time of year, adds Otto. This can either amplify or dampen the effect from the warming alone, but not all studies include both effects, she notes.
It’s also important to stress that the absence of evidence for a link to climate change isn’t the same as evidence of absence. In other words, it doesn’t necessarily mean there wasn’t a human influence, just that a particular analysis didn’t find one. This is why a single study should never be considered the final word on how climate change influences a given type of extreme weather.
Drought
Of the 33 published studies on drought, 58% found that climate change had increased the severity of the event in question, or the likelihood of it occurring. A further 15% of studies found no discernible link with human activity, while 24% were inconclusive.
This mixed bag of results reflects the inherent complexity of droughts. And, again, the specific question matters. Conclusions about the role of climate change in a specific drought could depend on whether a study looks at temperature, precipitation or soil moisture, for example.
As the 2015 BAMS report explains:
“Drought continues to be an event type where the results require significant context, and easy answers often remain elusive because of the many meteorological, hydrological, and societal drivers that combine to cause drought.”
Geographical reach
While much has been achieved in the field of extreme event attribution in a short space of time, scientists are constantly looking for ways to tailor their work to suit the people who might use it.
One major goal since the early days of the field has been to expand extreme event attribution to cover a larger and more diverse geographical area. Where in the world scientists can do attribution studies – and for what kind of events – will always be limited by the quality of the data record. But at the moment, there is a heavy leaning towards weather events that are local to the modelling groups, or that have a particular scientific interest. Otto explains:
“For example, scientists often do attribution studies because an event occurs on their doorstep. The UK, California and Boulder [in Colorado] are, therefore, studied much more than other parts of the world, but that does not necessarily make them to places particularly impacted by climate change.”
This means that while the studies carried out so far are indicative of the role of climate change is playing in extreme weather worldwide, they shouldn’t be considered representative of all types of extreme weather everywhere, says Otto. She tells Carbon Brief:
“[The studies so far] are part of a picture, but we don’t know what’s on the missing puzzle pieces. And, crucially, we don’t know how many pieces are missing.”
Real-time
As well as expanding the science to cover different types of weather and more of the world, scientists are getting faster at turning the handle on extreme event attribution studies – sometimes crunching the numbers just days after an event has occurred. The hope within the science community is that rapid, scientifically rigorous assessments of extreme weather could be put to use in a “real-time” attribution service. As a study on flooding in Louisiana put it:
“The field of rapid attribution analysis is still nascent and may one day lead to such assessments being the normal course of action in response to an extreme event, in order to help provide scientific basis for real-time discussions and in longer-term disaster response and rebuilding.”
Much of the real-time event attribution work happening today is carried out as part of the World Weather Attribution (WWA) project – a partnership coordinated by Climate Central and involving the University of Oxford Environmental Change Institute, the Royal Netherlands Meteorological Institute (KNMI), the University of Melbourne and the Red Cross Red Crescent Climate Centre (the Climate Centre). A separate EU-funded project project, EUCLEIA, looks specifically at climate change and extreme weather in Europe. You can have a look through Carbon Brief’s past articles on attribution for more information on the various methods the different groups use.
Although the specific results of “real-time” studies aren’t peer reviewed at the point they are made public, the methods that underpin them are. As the 2014 BAMS report explained:
“Much like other routine analysis, such as an operational seasonal forecast, statements made about heat events using these methods do not necessarily need to go through the peer-reviewed literature to be considered credible.”
That said, many real-time analyses have gone on to be published in the scientific literature a few months later. For this reason, we have included only published studies in our analysis, though we acknowledge that this may temporarily omit the most recent “real-time” studies.
Prof Peter Stott, professor of detection and attribution at University of Exeter and acting director of Met Office Hadley Centre, has been a co-editor of the BAMS reports since they began five years ago. He tells Carbon Brief how the reports have grown substantially in that time, in terms of geographical coverage and the type of extreme event covered:
“When we started these reports we wanted to encourage the development of studies that explained the causes of extreme weather events from a climate perspective on a relatively rapid timescale when the events were still fresh in people’s minds. It has been very encouraging to see how the scientific capability to carry out such analyses has developed and how much interest there is in many parts of the world in understanding better the links between extreme weather events and climate variability and change.”
There is a growing interest within the attribution community in connecting climate change to the societal impacts of extreme weather. The first such “impact attribution” study estimated that 506 of the 735 fatalities in Paris during the 2003 European heatwave were down to the fact that climate change had made the heat more intensethan it would otherwise have been. The same was true for 64 of the 315 fatalities in London. As the BAMS report for that year explained:
“This year, for the first time, attribution scientists partnered with public health officials to assess the role climate change played in increased mortality from a specific event – the 2003 European heatwave.”
An evolving science
As the science of extreme event attribution has matured and become more nuanced, so has the way we talk about extreme weather and climate change.
While some attest that all extreme weather must be affected by a world that is warming, this warrants some caution. As the first BAMS report in 2012 noted:
“While it has been argued that in the Anthropocene, all extreme weather or climate events that occur are altered by human influence on climate…this does not mean that climate change can be blamed for every extreme weather or climate event. After all, there has always been extreme weather.”
But while it would be premature to suggest that any single study is the last word, it is clear that in many cases the science can do better than that. Similarly, scientific thinking has clearly moved on from the unsatisfactory, but oft-repeated, statement that it is not possible to attribute any individual weather event to climate change.
Ultimately, there are no blanket rules in event attribution. Scientists need to examine the circumstances of each individual weather event. It’s only by combining evidence from all around the world that they can begin to draw broader conclusions. The evidence from the scientific literature – as it stands – suggests that of the extreme weather events scientists have studied so far, climate change has made more than 60% of them more likely or more damaging. The majority of these events have been heatwaves, but the fingerprint of climate change has also been felt on drought, heavy rain, wildfires and even tropical cyclones.
Carbon Brief aims to periodically add new extreme event attribution studies to our map, and accompanying analysis, as they are published. We’d appreciate your help in staying up to date – so please let us know if you think anything is missing.


What an extremely impressive map. One nit pick, some of the explanations towards Australia are partly hidden under the key.
We have the majority of evidence pointing to the human fingerprint, but it's interesting that a few studies find otherwise. This shows the lack of the great conspiracy theory the denialists talk about, but will be utterly lost on them.
I have heard sceptics say "theres no evidence climate change caused this event" which may be true, but no matter how many times you explain climate change made the events more probable, or more numerous or more severe, it fails to shift their views. They just repeat their mantra. It's like they dont register what we say.
Maybe their mind literally switches off to anything that contradicts their world view, or vested interests etc, and they aren't even aware this mind filtering is happening. It could be a form af sensory gating.
www.scientificamerican.com/article/your-hidden-censor-what-your-mind-will-not-let-you-see/
@ Nigelj:
My screen is touch-sensitive: I can drag the map with a finger tip.
I can also double-click to re-centre the map and thus bring the full text out from behind the other graphics.
So, problem solved! If only they were all this simple.
Singelton Engineer, thanks. I had another look at the map and realise it has a zoom key. I didn't see this originally, as the way I manipulated the page hid the key, and I never noticed it. My fault. I'm a twit.